. 2015 Jun;34(25):3315-24.
doi: 10.1038/onc.2014.264. Epub 2014 Aug 18.

Anoikis resistance is a critical feature of highly aggressive ovarian cancer cells

Affiliations

Anoikis resistance is a critical feature of highly aggressive ovarian cancer cells

Q Cai et al. Oncogene. 2015 Jun.

Abstract

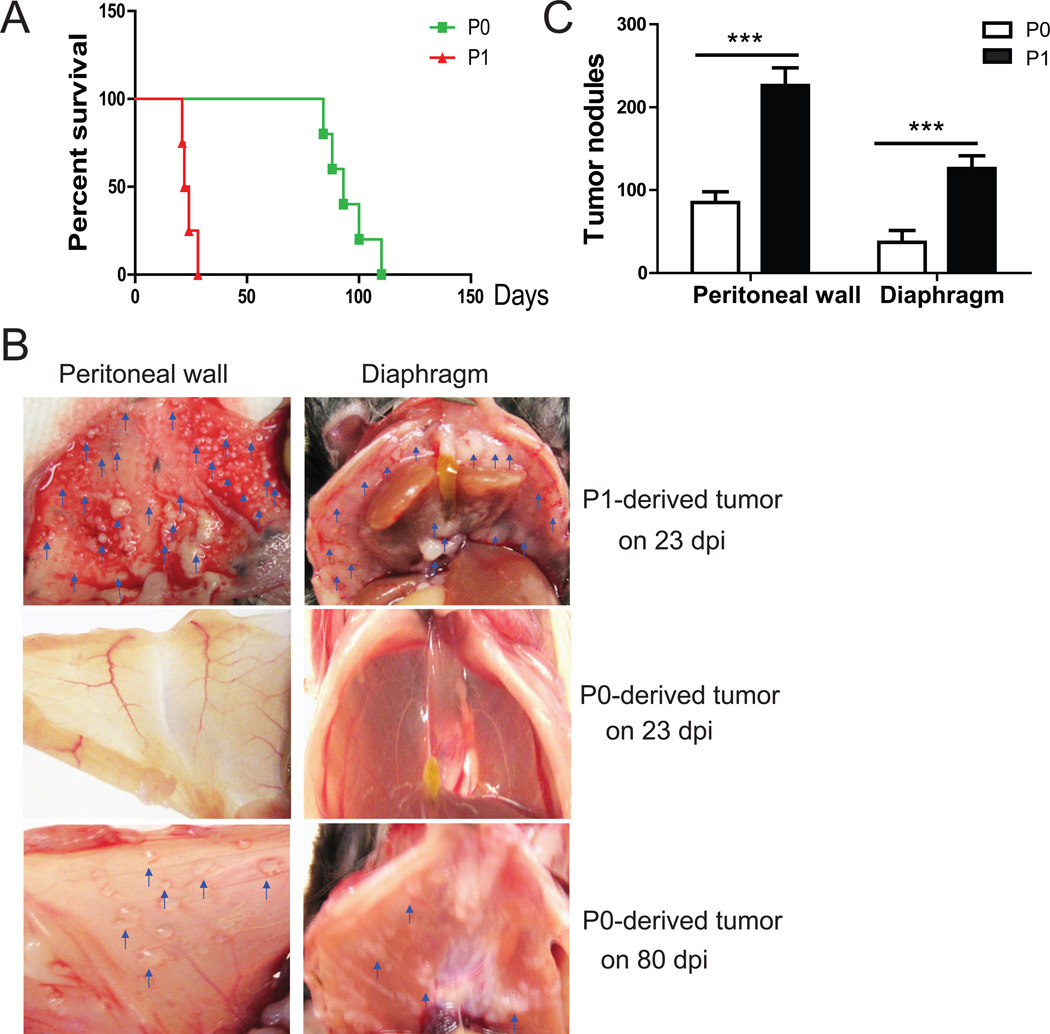
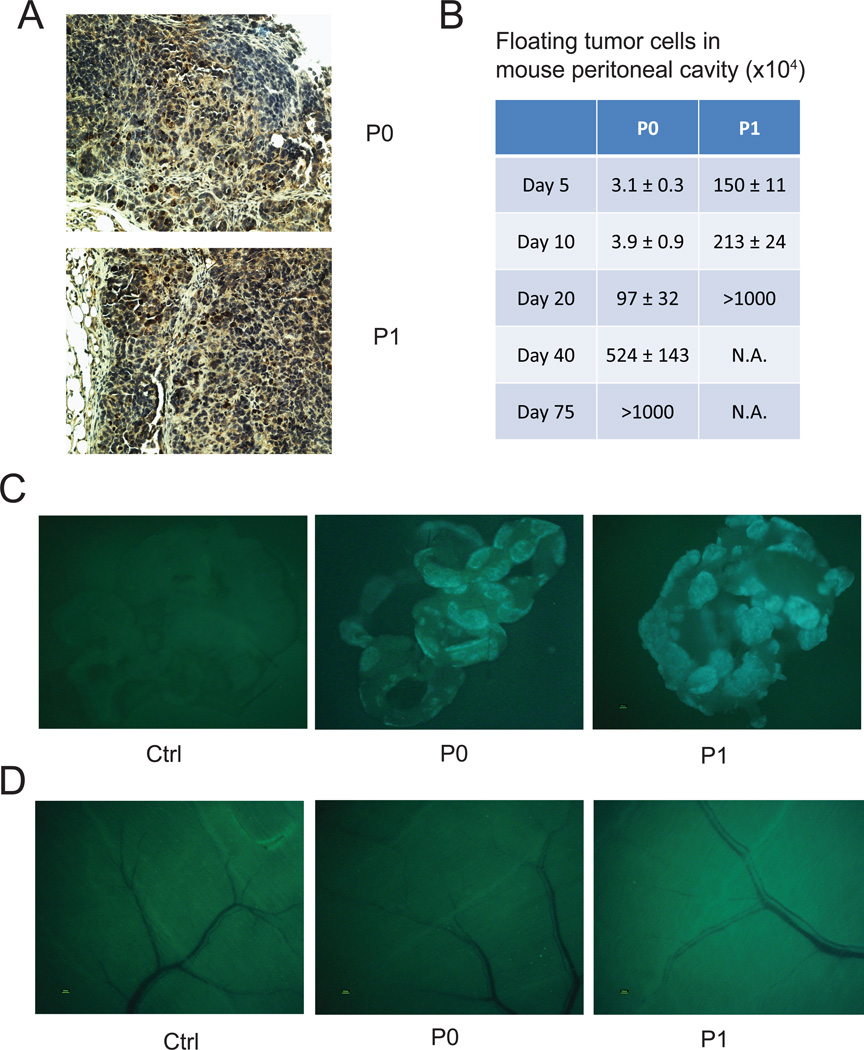
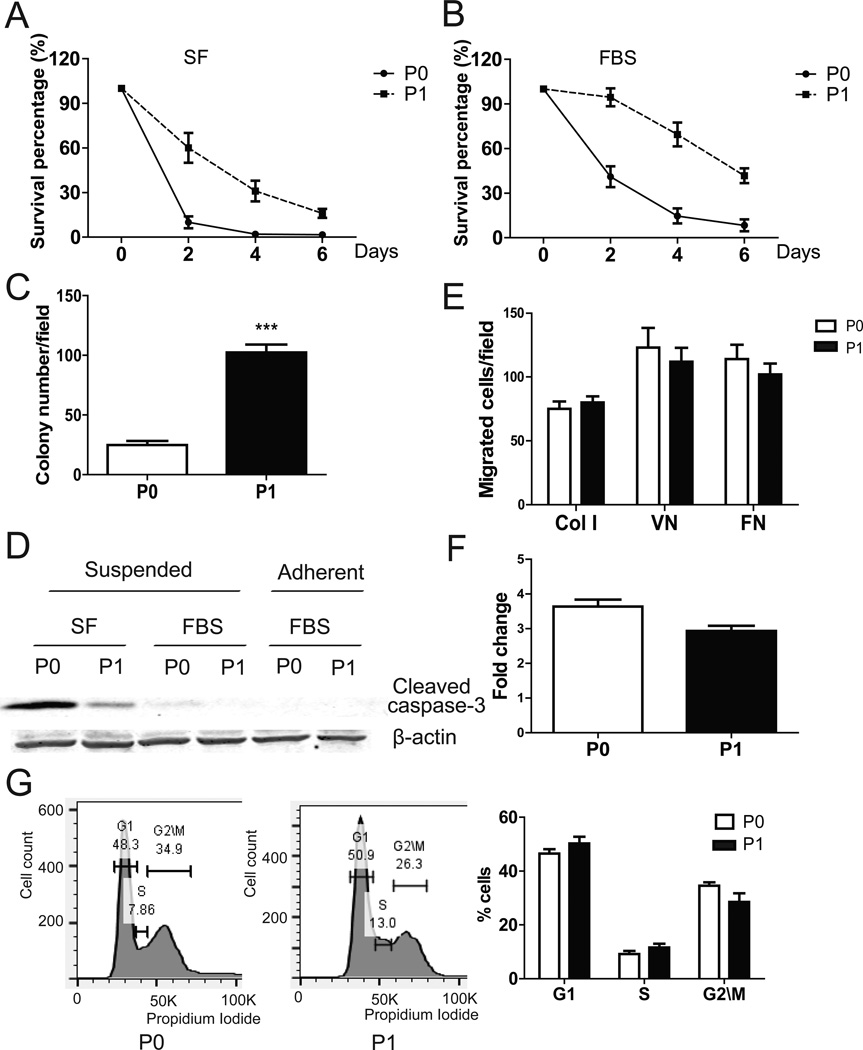
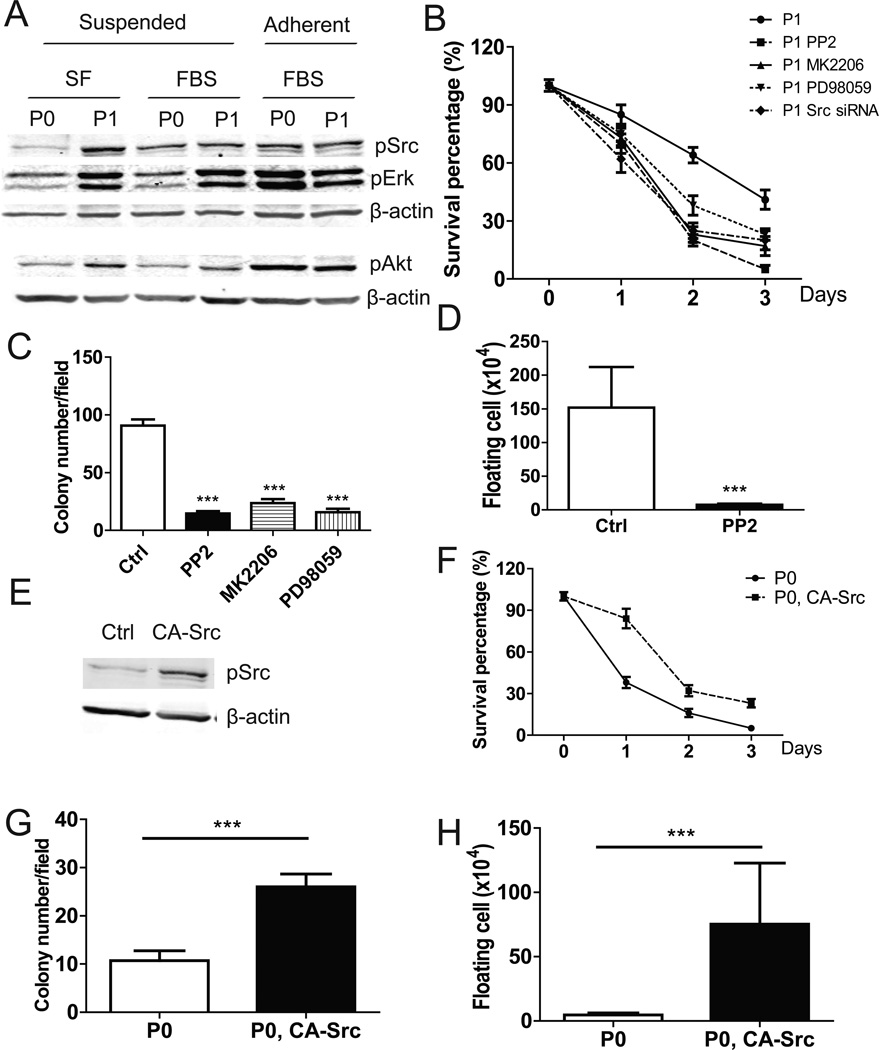
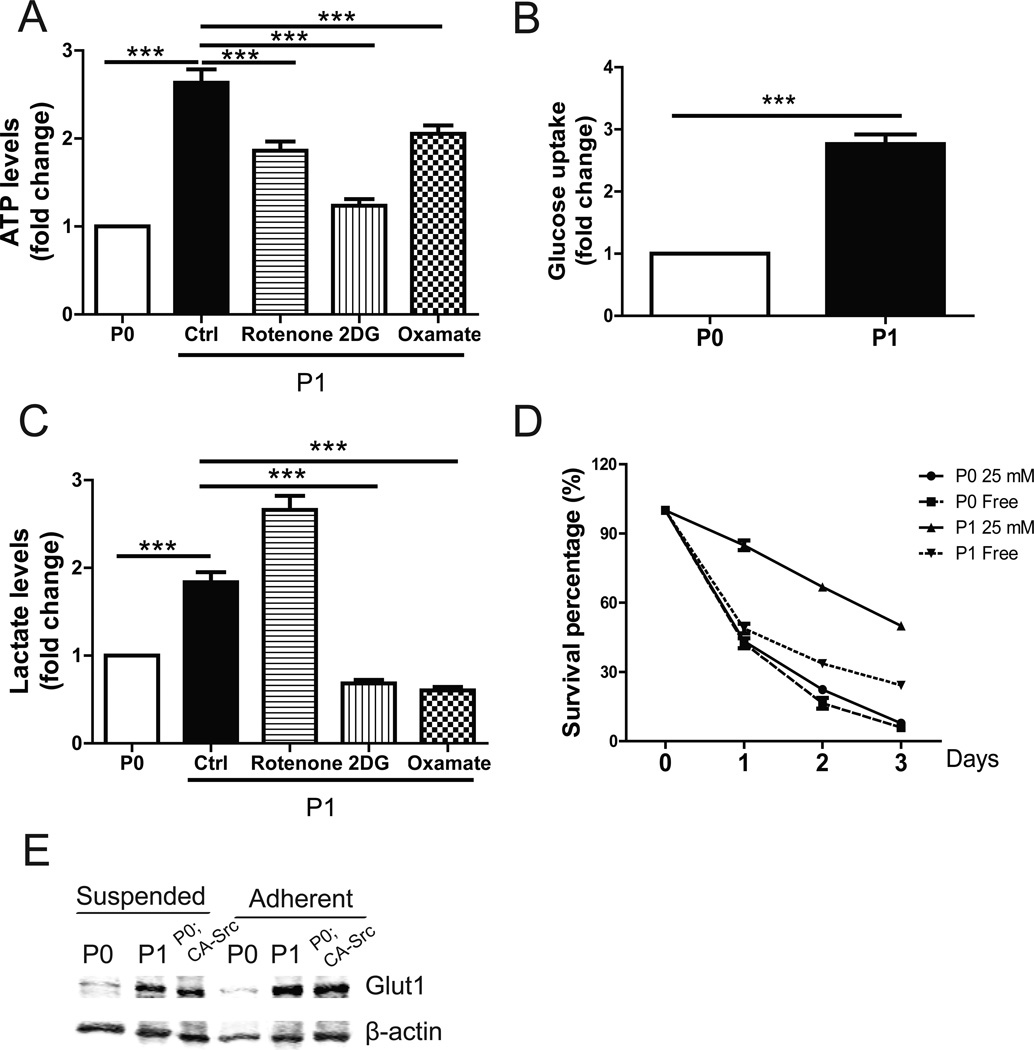
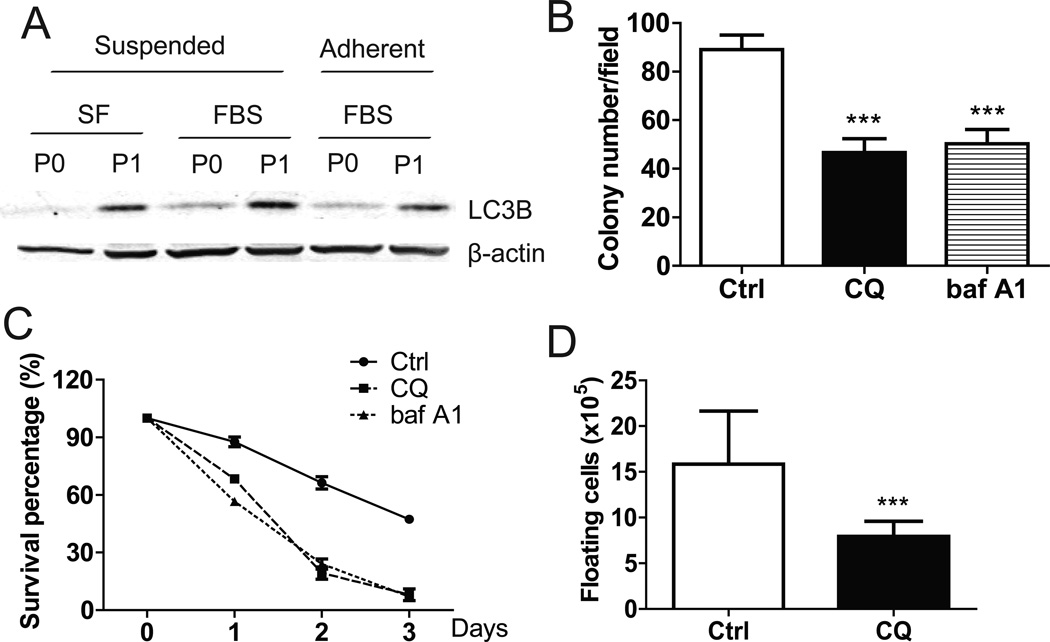
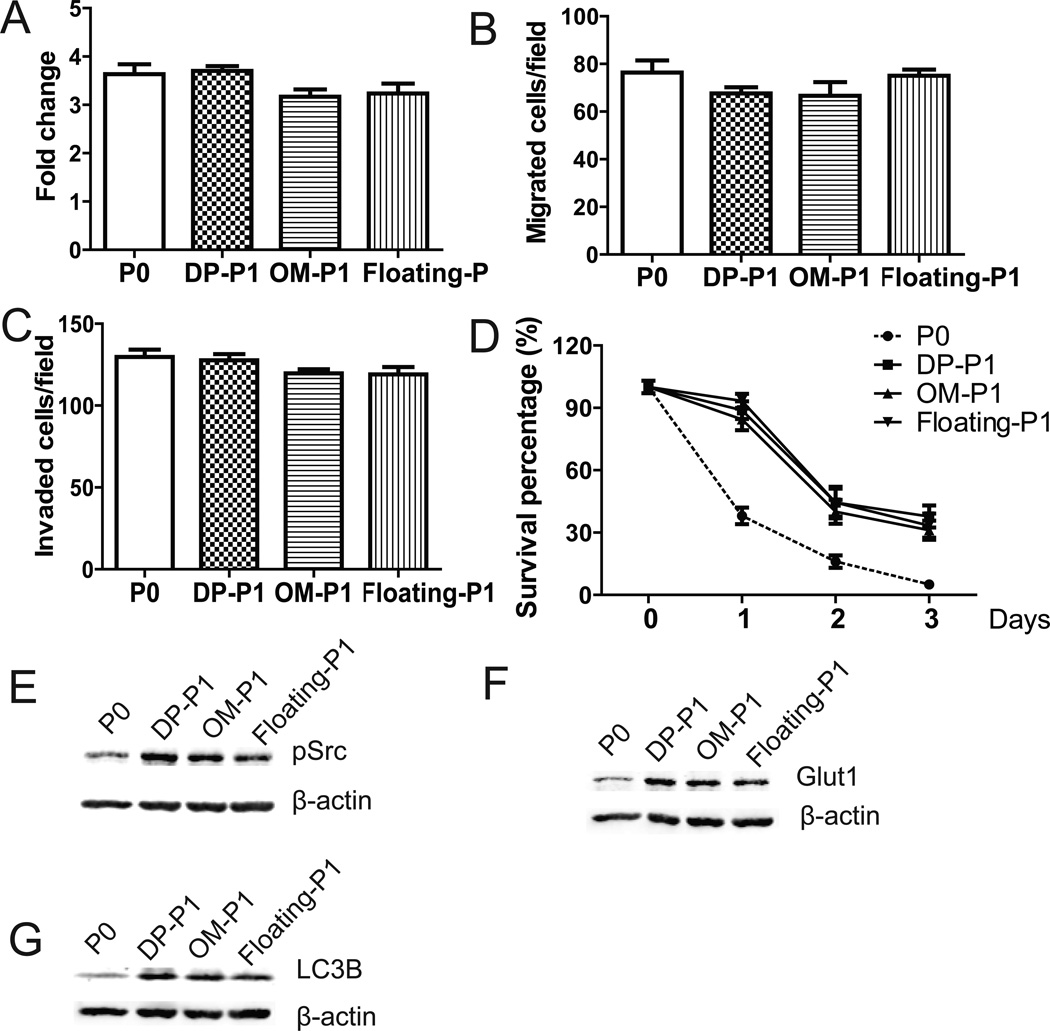
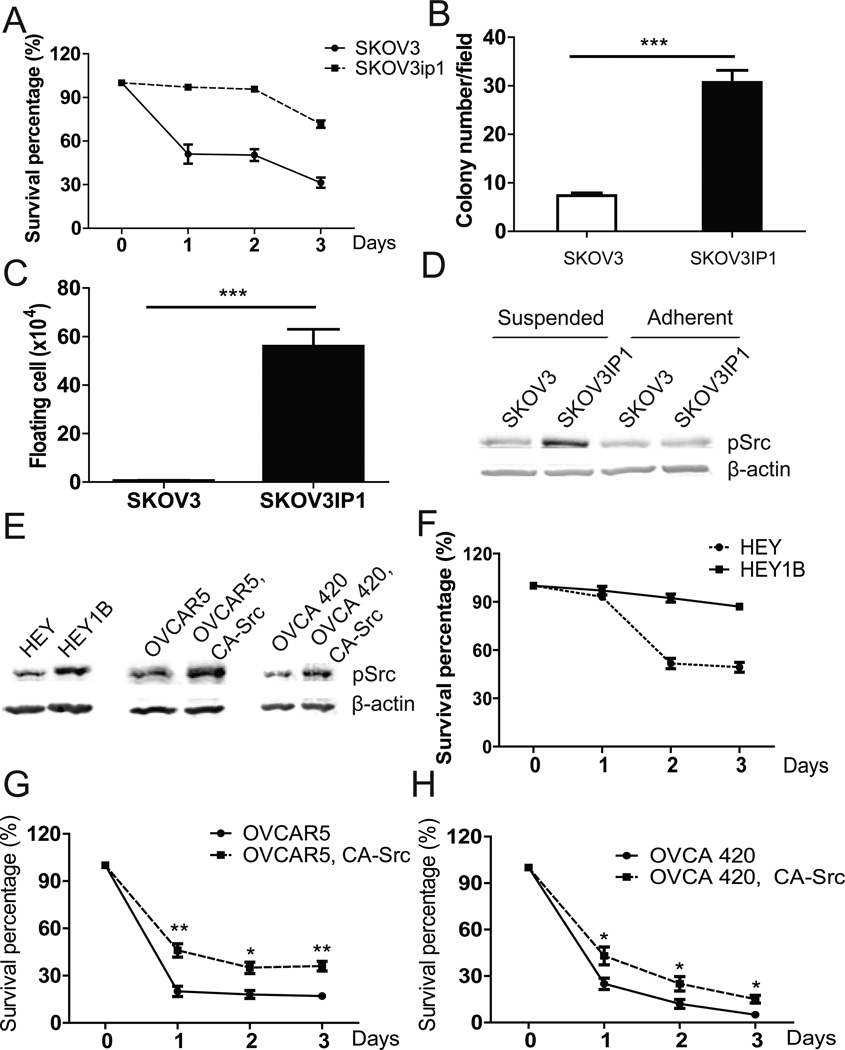
High-grade serous ovarian cancer is an aggressive form of epithelial ovarian cancer (EOC), and accounts for the majority of deaths due to EOC. The critical cellular processes and underlying molecular mechanisms that define this malignancy remain poorly understood. Using a syngeneic murine model, we investigated the changes that accompanied the progression to increased aggressiveness induced by in vivo passage of mouse EOC cells. We found that enhanced anoikis resistance was a key cellular process associated with greater aggressiveness and tumorigenicity in vivo. Biochemical studies revealed that the enhanced anoikis resistance was associated with the activation of the Src/Akt/Erk signaling pathway. A higher rate of metabolism and autophagy were also associated with increased anoikis resistance. Blocking these pathways with specific inhibitors and/or genetic modifications significantly increased anoikis in vitro and inhibited tumor development in vivo. In addition, we demonstrated that similar signaling pathways were also involved in a human EOC cell line model. Collectively, our data suggest that anoikis resistance represents a critical and a distinguishing feature underlying the aggressiveness of ovarian cancer cells.


Conflict of interest statement

Conflict of interest:

The authors declare no conflict of interest.

Figures

Figure 1
Figure 1. ID8-P1 cells were more aggressive than ID8-P0 cells in vivo
A. Kaplan-Meier survival curves of mice i.p. injected with ID8-P0 or ID8-P1 cells (n=10 per group). B. Representative images of tumors on the peritoneal wall and diaphragm of the mice injected with ID8-P0 or ID8-P1 cells on the indicated days post-injection (dpi). C. The average numbers of tumor nodules on the peritoneal wall and diaphragm in mice injected with ID8-P0 or ID8-P1 cells. *** P<0.001.
Figure 2
Figure 2. ID8-P1 cells survived longer than ID8-P0 cells in the mouse peritoneal cavity
5×10⁶ ID8-P0 or ID8-P1 cells were i.p. injected into C57BL6 mice. At designated time points after injection, mice were sacrificed. A. Representative images of Ki67 staining of ID8-P0 and ID8-P1 tumors. B. Fluorescent tumor cells in peritoneal washes were counted (n=3 per time point per group). C. Fluorescent tumor cells that attached to peritoneal organs were detected (n=3 per time point per group). Representative images of tumor metastases on omentum of the mice 5 days after injection. D. Representative images of tumor metastasis on the peritoneal wall of the mice 5 days after injection.
Figure 3
Figure 3. ID8-P1 displayed enhanced anoikis resistance in vitro
A–B. Survival of ID8-P0 and ID8-P1 cells under suspended conditions with or without FBS (SF: serum free; FBS 5%). C. Colony numbers of ID8-P0 and ID8-P1 cells in soft agar. D. Western blot analysis showing cleaved caspase-3 levels in ID8-P0 and ID8-P1 cells under different culture conditions. E. Migration of ID8-P0 and ID8-P1 cells through Transwell membranes coated with collagen I (Col I), vitronectin (VN), or fibronectin (FN). F. Proliferation of ID8-P0 and ID8-P1 cells on plastic plates over 3 days with FBS (5%). G. Flow cytometric analyses of ID8-P0 and ID8-P1 cell cycles. Representative results are shown in the left panels and the summary of 3 repeated experiments is shown in the right panel. *** P<0.001.
Figure 4
Figure 4. Src/Akt/Erk signaling was constitutively activated and functionally involved in anoikis resistance in ID8-P1 cells
A. pSrc, pAkt, pErk levels in ID8-P0 and ID8-P1 cells under different culture conditions by Western blot analyses. B. Survival of ID8-P1 cells under suspended conditions treated with Src siRNA (100 µM) and selective inhibitors: PP2 (10 µM), MK2206 (1 µM), PD98059 (30 µM). C. Quantification of soft agar colony numbers of ID8-P1 cells treated with inhibitors. D. Number of floating ID8-P1 cells in mouse peritoneal cavities treated with the Src selective inhibitor PP2 (daily i.p. injection at a dose of 2 mg/kg, n=3). E–G. Ectopic expression of CA-Src in ID8-P0 increased anoikis resistance. E. pSrc levels in ID8-P0 and ID8-P0-CA-Src cells by Western blot analyses. F. Anoikis assays of ID8-P0 and ID8-P0-CA-Src cells in SF medium. G. Colony formation of ID8-P0 and ID8-P0-CA-Src cells in soft agar. H. Numbers of floating ID8-P0 and ID8-P0-CA-Src cells in mouse peritoneal cavities. * P<0.05; **, P< 0.01; *** P<0.001.
Figure 5
Figure 5. Enhanced metabolism was important for anoikis resistance in ID8-P1 cells
A–C, ID8-P0 and ID8-P1 cells were cultured in 1 mL DMEM with 25 mM glucose with or without an inhibitor [(rotenone (5 µM), 2-deoxyglucose (2DG) (10 mM), or oxamate (20 mM)] for 24 hours. Cells and culture medium were separated by centrifugation and cell number was counted. Results are normalized by cell number. A. Comparison of ATP levels of suspended ID8-P0 and ID8-P1 cells. B. Glucose consumption of suspended ID8-P0 and ID8-P1 cells over 24 hours. C. Comparison of lactate secretion of ID8-P0 and ID8-P1 cells. D. Survival of ID8-P0 and ID8-P1 cells in glucose-free medium and 25 mM glucose medium. E. Glut1 level in ID8-P0, ID8-P1 and ID8-P0; CA-Src cells by Western blot. *** P<0.001.
Figure 6
Figure 6. Increase of autophagy protected ID8-P1 cells from anoikis
A. Expression of LC3B in ID8-P0 and ID8-P1 cells by Western blot analyses. B. Quantification of soft agar colony numbers of ID8-P1 cells treated with CQ (30 µM) and baf A1 (5 µM). C. Survival of ID8-P1 cells under suspended conditions treated with selective autophagy inhibitors: CQ (30 µM) and baf A1 (5 µM). D. Numbers of floating ID8-P1 cells when treated with selective autophagy inhibitor CQ (daily i.p. injection at a dose of 50 mg/kg, n=3) in mouse peritoneal cavities. * P<0.05; **, P< 0.01; *** P<0.001.
Figure 7
Figure 7. Characterization of ID8-P1 cells from other organ sites
A. Cell proliferation of ID8-P0, ID8-DP-P1, ID8-OM-P1, and ID8-floating-P1 cells on 2D cell culture plates over 3 days in the presence of FBS (5%) analyzed by MTT assays. B. Cell migration of ID8-P0, ID8-DP-P1, ID8-OM-P1, and ID8-floating-P1 cells through Transwell membranes coated with collagen I (Col I). C. Cell invasion of ID8-P0, ID8-DP-P1, ID8-OM-P1, and ID8-floating-P1 cells through Transwell membranes coated Matrigel. D. Cell survival of ID8-P0, ID8-DP-P1, ID8-OM-P1, and ID8-floating-P1 cells under suspended conditions in serum-free medium. E–G. Expression levels of pSrc, Glut1, and LC3B in ID8-P0, ID8-DP-P1, ID8-OM-P1 and ID8-floating -P1 cells by Western blot analyses.
Figure 8
Figure 8. Increased anoikis and Src activation in SKOV3ip1 cells
A. Survival of SKOV3 and SKOV3ip1 in the anoikis assay. B. Colony numbers of SKOV3 and SKOV3IP1 grown in soft agar. C. Numbers of floating living tumor cells recovered in washes of NOD/SCID mouse peritoneal cavities (n=3). D. pSrc levels in SKOV3 and SKOV3ip1 cells analyzed by Western blot. E. pSrc levels in HEY, HEY1B, OVCAR5, OVCA420, and their CA-Src overexpression cells by Western blot analyses. F. Anoikis assays of HEY and HEY1B cells in SF medium. G. Anoikis assays of OVCAR5 and OVCAR5, CA-Src cells in SF medium. H. Anoikis assays of OVCA 420 and OVCA 420, CA-Src cells in SF medium. * P<0.05; **, P< 0.01; *** P<0.001.

References

    1. Integrated genomic analyses of ovarian carcinoma. Nature. 2011;474(7353):609–615. Epub 2011/07/02. - PMC - PubMed
    1. Janat-Amsbury MM, Yockman JW, Anderson ML, Kieback DG, Kim SW. Combination of local, non-viral IL12 gene therapy and systemic paclitaxel chemotherapy in a syngeneic ID8 mouse model for human ovarian cancer. Anticancer Res. 2006;26(5A):3223–3228. Epub 2006/11/11. - PubMed
    1. Said NA, Najwer I, Socha MJ, Fulton DJ, Mok SC, Motamed K. SPARC inhibits LPA-mediated mesothelial-ovarian cancer cell crosstalk. Neoplasia. 2007;9(1):23–35. Epub 2007/02/28. - PMC - PubMed
    1. Roby KF, Taylor CC, Sweetwood JP, Cheng Y, Pace JL, Tawfik O, et al. Development of a syngeneic mouse model for events related to ovarian cancer. Carcinogenesis. 2000;21(4):585–591. Epub 2000/04/07. - PubMed
    1. Sher I, Adham SA, Petrik J, Coomber BL. Autocrine VEGF-A/KDR loop protects epithelial ovarian carcinoma cells from anoikis. Int J Cancer. 2009;124(3):553–561. Epub 2008/11/13. - PubMed

Publication types

Substances