. 2014 Oct;297(10):1865-84.
doi: 10.1002/ar.23000. Epub 2014 Aug 18.

Laminar and neurochemical organization of the dorsal cochlear nucleus of the human, monkey, cat, and rodents

Affiliations

Laminar and neurochemical organization of the dorsal cochlear nucleus of the human, monkey, cat, and rodents

Joan S Baizer et al. Anat Rec (Hoboken). 2014 Oct.

Abstract

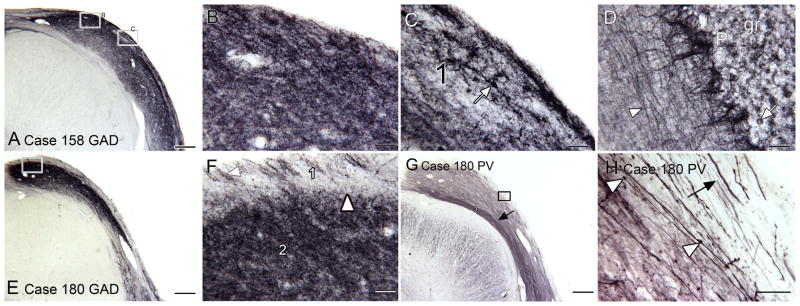
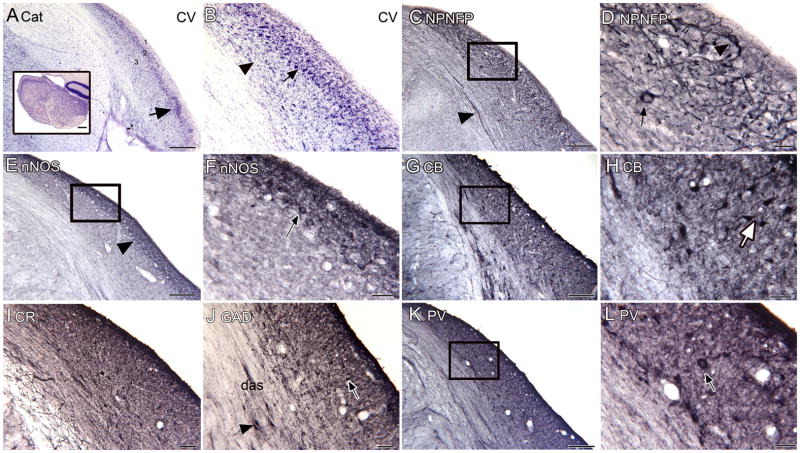
The dorsal cochlear nucleus (DCN) is a brainstem structure that receives input from the auditory nerve. Many studies in a diversity of species have shown that the DCN has a laminar organization and identifiable neuron types with predictable synaptic relations to each other. In contrast, studies on the human DCN have found a less distinct laminar organization and fewer cell types, although there has been disagreement among studies in how to characterize laminar organization and which of the cell types identified in other animals are also present in humans. We have reexamined DCN organization in the human using immunohistochemistry to analyze the expression of several proteins that have been useful in delineating the neurochemical organization of other brainstem structures in humans: nonphosphorylated neurofilament protein (NPNFP), nitric oxide synthase (nNOS), and three calcium-binding proteins. The results for humans suggest a laminar organization with only two layers, and the presence of large projection neurons that are enriched in NPNFP. We did not observe evidence in humans of the inhibitory interneurons that have been described in the cat and rodent DCN. To compare humans and other animals directly we used immunohistochemistry to examine the DCN in the macaque monkey, the cat, and three rodents. We found similarities between macaque monkey and human in the expression of NPNFP and nNOS, and unexpected differences among species in the patterns of expression of the calcium-binding proteins.

Keywords: auditory system; brainstem; cochlea; hair cells; tinnitus.


Figures

Figure 1
Figure 1
Cytoarchitectural appearance of the human DCN in three different cases, CV staining. Two images are shown for each case, a lower magnification image on the left (A, C, E) and a higher magnification image on the right (B, D, F). A rectangle on the left panel outlines the region shown in higher magnification. The arrows indicate neurons. The number 1 in A, C, E indicates the outer band with few somata and the number 2 indicates the deeper band that includes the stained somata shown in B, D, F. Abbreviations: CV, cresyl violet; das, dorsal acoustic stria; DCN, dorsal cochlear nucleus; icp, inferior cerebellar peduncle; VCN, ventral cochlear nucleus. Scale bars: A, C, E = 500 μm; B, D, F = 50 μm.
Figure 2
Figure 2
NPNFP immunostaining in the human DCN. A. NPNFP shows three distinct bands (1, 2, and 3). The laminar pattern is not as clear on an adjacent section stained for CV (inset). The rectangle shows the location of the image in B. B. The outer band (1) contains a few stained processes and somata. Band 2 is broader and is comprised of many stained somata and processes. In the innermost band (3) there are stained fibers running parallel to the border with the icp (example at arrowhead). The rectangles show the locations of the images in C and D. C. The arrowhead indicates a stained soma in band 1; the arrow indicates a neuron with an elongated soma at the outer border of band 2. D. The arrow shows a stained soma embedded in a dense meshwork of stained processes. Abbreviations: icp, inferior cerebellar peduncle; VCN, ventral cochlear nucleus. Scale bars: A = 1 mm; inset = 500 μm; B, C, D = 100 μm.
Figure 3
Figure 3
nNOS, CR, and CB immunoreactivity in the human DCN. A. nNOS. The rectangles show the locations of the images in panels B, C. B. nNOS immunostaining. Labeled somata are scattered in 2 with larger neurons deeper in the band. The rectangle shows the location of the image in C. There are a few stained somata (arrowheads) deep to 2. C. Labeled somata in band 2 are of different shapes from oval to multipolar (examples at arrows). D. The arrow shows a large stained soma in the outermost band (1). E. CR. Low magnification image of the DCN showing that CR immunoreactivity defines an outer narrow lightly stained band (1), a broad middle band (2) and a lightly stained, narrow, inner band (3). The asterisk is an alignment point for the image in F. The rectangles show the locations of the images in G and H. F. There are long stained processes in the outer band that run parallel to the surface of the DCN (example at arrowhead). In band 2 there are scattered stained small somata (example at arrow) and stained processes. G. Higher magnification image of the stained somata (examples at arrow) in band 2. H. The deepest band (3) includes stained processes (example at arrowhead). I. CB immunostaining shows a lightly stained outer band (1) with a few fine beaded fibers (example at arrowhead) running parallel to the pial surface. Below that is a more darkly stained band (2) with small stained profiles (example at arrow) and stained processes running parallel to the surface (example at arrowhead). J. In band 1 there are two fascicles of CB-ir fibers (black arrows) and a long, thin beaded process (white arrowhead) all running parallel to the surface. K. CB-ir Purkinje-like cell. L. CB-ir Purkinje-like cell from a second case. Scale bars: A = 1 mm; B, C, F, G, H, I, J, L = 100 μm; D, K = 50 μm; E = 500 μm.
Figure 4
Figure 4
GAD and PV immunoreactivity in the human DCN. A. Low magnification view of immunoreactivity for GAD in the DCN of Case 158 showing uniformly dark staining across the entire width of the DCN. The rectangles show the location of the images in B and C. B. The staining is fine and punctate. C. Staining of a soma (arrow) in the outer band (1). D. GAD in the cerebellar cortex. The arrowhead indicates a stained fiber. E. GAD staining in the DCN of another case. The rectangle shows the location of the image in F. F. Higher magnification showing the contrast in staining between bands 1 and 2. The arrow shows stained processes in band 1 running roughly perpendicular to the surface. G. The same three bands are seen with PV staining, a narrow lightly stained outer band a broader middle band (2) and a narrow inner band (arrow) that with PV is more darkly stained. The rectangle shows the location of the image in H. H. At this magnification the lightly stained outer band is more apparent. There are stained processes (example at arrow) running parallel to the border of the DCN in this band. There are also stained processes running parallel to the surface in the middle band, some of which are beaded (examples at arrowheads). Scale bars: A, E, G = 500 μm; B, C, D, F, H = 50 μm. Abbreviations: P, Purkinje cells; gr, granule cell layer.
Figure 5
Figure 5
The DCN in the macaque monkey. A. On a CV-stained section there is an outer, lightly stained band (1) and a row of larger, darkly stained somata (arrow). Deep to that row is a broader region of scattered somata. The inset shows a more rostral CV-stained section showing a region of densely stained small somata (arrow), the granule cell domain (GCD). B. NPNFP immunoreactivity in the DCN shows is a narrow lightly stained outer band (1). The arrowhead marks the approximate boundary of a broad band of stained somata. The rectangle shows the location of the image in C. C. The NPNFP immunostained neurons have round or oval cell bodies (example at arrow). D. nNOS immunostaining labels a few elongated somata and processes. The small rectangle shows the location of the image in E. The inset shows the DCN on a section double-labeled for nNOS (red) and NPNFP (green). The arrow shows a neuron that is NPNFP-ir and the arrowhead a neuron that is nNOS-ir. E. Elongated nNOS-ir somata. F. CR. Scattered CR-ir somata (example at arrow) and a few processes (arrowhead). G. There are occasional stained CB-ir elements that resemble stained processes (example at arrow). H. Punctate GAD staining. Scale bars: A = 500 μm; B, D, F = 250 μm; C, D- inset, E, G, H = 100 μm.
Figure 6
Figure 6
The DCN of the cat. A. CV-stained coronal section through the cat DCN showing an outer, lightly stained molecular layer (1), a broad, darkly stained pyramidal cell layer (2) and a deeper layer (3) with scattered stained somata. The arrow marks a region of dense staining at the ventral edge of the DCN, the GCD. The inset shows the DCN in a parasagittal section (cropped screenshot of an image from the parasagittal atlas of the cat brain from brainmaps.org); the same laminar organization is apparent. B. Higher magnification image of the coronal section showing the large, darkly stained somata of a variety of shapes, (example at arrow) and large elongated somata in the deep layer (example at arrowhead). C. Low magnification image showing NPNFP staining in the outer half of the DCN. The rectangle shows the location of the image in D. D. Higher magnification image showing occasional stained somata (arrow and arrowhead) and fragments of processes. E. nNOS in the cat DCN shows darker staining in an outer band of the DCN (arrowhead). The rectangle shows the image in F. F. There are nNOS-ir somata (arrow) in the outer band. G. CB staining shows a broad layer of scattered stained somata. The rectangle shows the location of the image in H. H. Stained round and elongated (example at arrow) somata and proximal dendrites. I. CR staining marks only a few stained profiles. J. With GAD-ir there are some stained small round profiles (example at arrow) and a few stained somata in the das (arrowhead). K. PV gives uniform light staining with a few stained somata. The rectangle shows the location of the image in L. L. There are occasional PV-ir large somata (arrow) in the deep layers. Scale bars A, C, E, G, K = 250 μm; A, inset= 500 μm; B, I, J = 100 μm; D, F, H, L = 50 μm.
Figure 7
Figure 7
Cytoarchitectural organization in the rat (A, B), guinea pig (C, D) and chinchilla (E, F). A. Low magnification image of the brainstem of the rat at a level where the DCN and VCN are both present. The arrowhead indicates the GCD. The outer lightly stained layer is marked with a “1.” The rectangle shows the area in B. B. Higher magnification image of the rat DCN showing scattered neurons with large somata in layer 2 (example at arrow). C. Guinea pig the outer layer (1) again has relatively few stained somata and a large region of granule cells (arrowhead) is inserted between the DCN and the VCN. The rectangle shows the location of the image in D. D. Layer 2 is distinguished by dense granule cells and scattered larger somata (example at arrow). E. Low magnification image of a CV-stained section through the DCN of a chinchilla. The arrows indicate several pools of darkly stained small neurons. F. Higher magnification image shows CV-stained somata of a variety of shapes, sizes and orientations. The arrowhead shows a small neuron, the arrow shows a neuron with an elongated soma located deep in the cell layers of the DCN. Scale bars: A, C, E= 500 μm; B, D, F= 100 μm.
Figure 8
Figure 8
The DCN in the rat. The images are arranged in pairs with a low magnification image on the left (A, C, E, G, I, K). The rectangles show the location of the higher magnification images to the right (B, D, F, H, J, L). A. NPNFP immunostaining is relatively uniform through the depth of the DCN. B. The higher magnification image shows that NPNFP is expressed in puncta and scattered fragments of processes; some staining surrounds large somata (example at arrow). C. With nNOS, there is a band of darker staining along approximately the outer 50 μm of the DCN. There are scattered stained somata in that band (arrowhead). D. There are scattered larger somata in the outer band (arrowhead) as well as deeper in the DCN (arrow). E. GAD staining is punctate and denser in the outer half of the DCN. F. The punctate nature of GAD staining with occasional stained somata is clear at this magnification. G. Relatively uniform CB immunostaining with scattered somata in the outer layers. H. This higher magnification image shows scattered stained somata (example at arrow) in the outer layers of the DCN. I. CR immunostaining in the DCN; the outermost layer has fewer stained elements. J. Higher magnification image showing small, round, stained somata (example at arrow). K. PV immunoreactivity in the DCN. L. Higher magnification image showing stained somata (arrow) in the outer layer. Scale bars: A, C, E, G, K = 250 μm; B, D, F, H, J, L= 50 μm; I = 100 μm.
Figure 9
Figure 9
The DCN in the guinea pig. A. NPNFP immunostaining marks a more darkly stained outer layer (arrowhead). The rectangle shows the region in B. The staining is composed of small stained somata (arrow) and processes, many of which are oriented perpendicular to the surface. C. nNOS immunostaining is relatively light and uniform. A few stained somata are seen deep in the DCN (arrow). The rectangle shows the region in D. The higher magnification images show scattered puncta of a variety of sizes. E. GAD immunostaining is punctate and again relatively uniform. F. The punctate nature of GAD immunostaining shown at higher magnification. G. CB staining marks an outer darker band (arrowhead). H. The band is comprised of stained small somata and processes. I. CR immunostaining marks stained processes and puncta. J. Eps8 staining shows many stained widely distributed somata. K. Parvalbumin immunostaining distinguishes the outer third of the DCN. The rectangle shows the region in L. L. Neurons with fusiform somata (example at arrow) oriented perpendicular to the surface are stained with PV. Scale bars: A, C, E, K = 250 μm; B, D, F, H, I, L = 50 μm; J = 100 μm.
Figure 10
Figure 10
The DCN in the chinchilla. A. NPNFP immunostaining is denser in the outer layers; arrowhead marks the border of the darker staining. B. There are stained processes (example at arrow) in the outer 200 μm of the DCN, many oriented perpendicular to the surface. C. nNOS immunoreactivity is darker in the outer region (arrowhead at border). The rectangle shows the location of the image in D. D. There are scattered nNOS-ir somata (example at arrow). E. CB-ir. The outer layer (arrowhead) is more darkly stained. Note the circular regions of lighter staining. The rectangle shows the location of the image in F. F. There are many stained somata (example at arrow) and processes in the outer layer. G. CR. The outer layer is lightly stained; beneath it are stained somata and processes. The inset shows that immunoreactivity for Eps8 overlaps but is not co-extensive with the CR immunoreactivity. H. PV-ir somata in the superficial DCN. Scale bars: A, C, E = 250 μm; B, D, F, H = 50 μm; G and inset = 100 μm.

References

    1. Adams JC. Neuronal morphology in the human cochlear nucleus. Arch Otolaryngol Head Neck Surg. 1986;112:1253–1261. - PubMed
    1. Adams JC, Warr WB. Origins of axons in the cat’s acoustic striae determined by injection of horseradish peroxidase into severed tracts. J Comp Neurol. 1976;170:107–121. - PubMed
    1. André VM, Cepeda C, Vinters HV, Huynh M, Mathern GW, Levine MS. Pyramidal cell responses to gamma-aminobutyric acid differ in type I and type II cortical dysplasia. J Neurosci Res. 2008;86:3151–3162. - PubMed
    1. Arai R, Winsky L, Arai M, Jacobowitz DM. Immunohistochemical localization of calretinin in the rat hindbrain. J Comp Neurol. 1991;310:21–44. - PubMed
    1. Armstrong C, Szabadics J, Tamas G, Soltesz I. Neurogliaform cells in the molecular layer of the dentate gyrus as feed-forward gamma-aminobutyric acidergic modulators of entorhinal-hippocampal interplay. J Comp Neurol. 2011;519:1476–1491. - PMC - PubMed

Publication types

LinkOut - more resources