

Neutralizing antibodies inhibit HIV-1 infection of plasmacytoid dendritic cells by an FcγRIIa independent mechanism and do not diminish cytokines production
- PMID: 25132382
- PMCID: PMC4135332
- DOI: 10.1038/srep05845
Neutralizing antibodies inhibit HIV-1 infection of plasmacytoid dendritic cells by an FcγRIIa independent mechanism and do not diminish cytokines production
Abstract
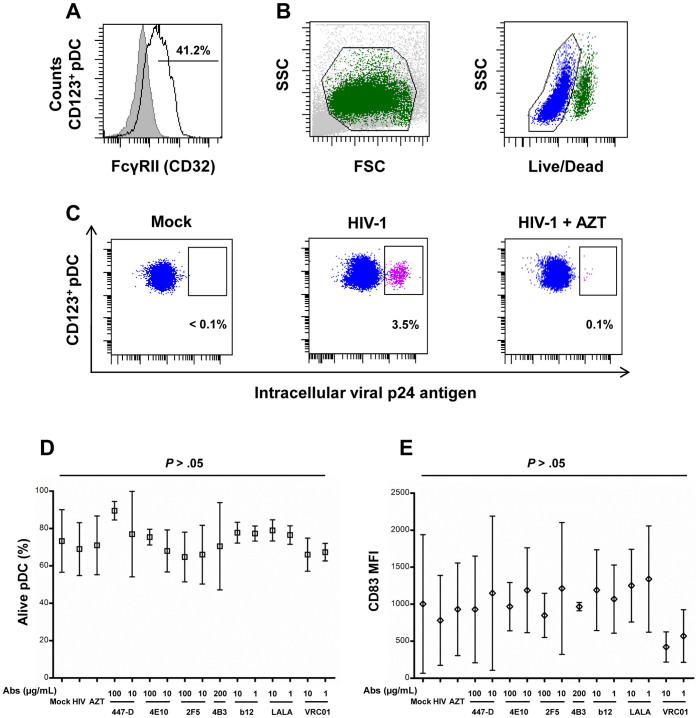
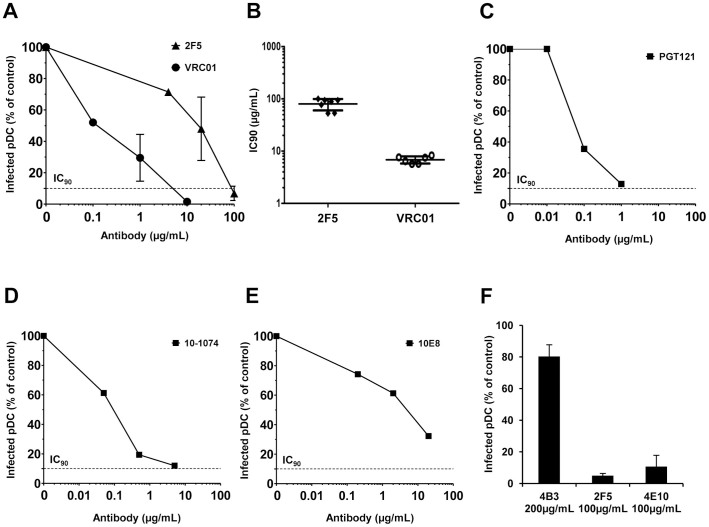
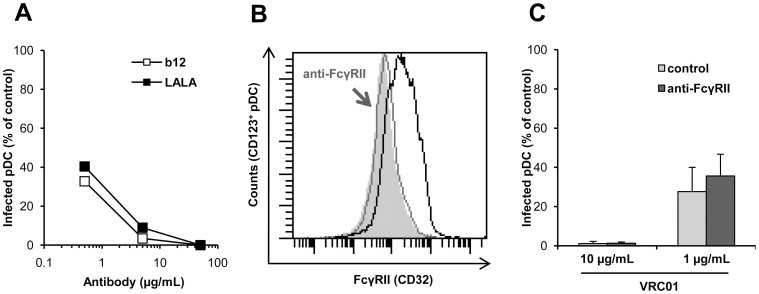
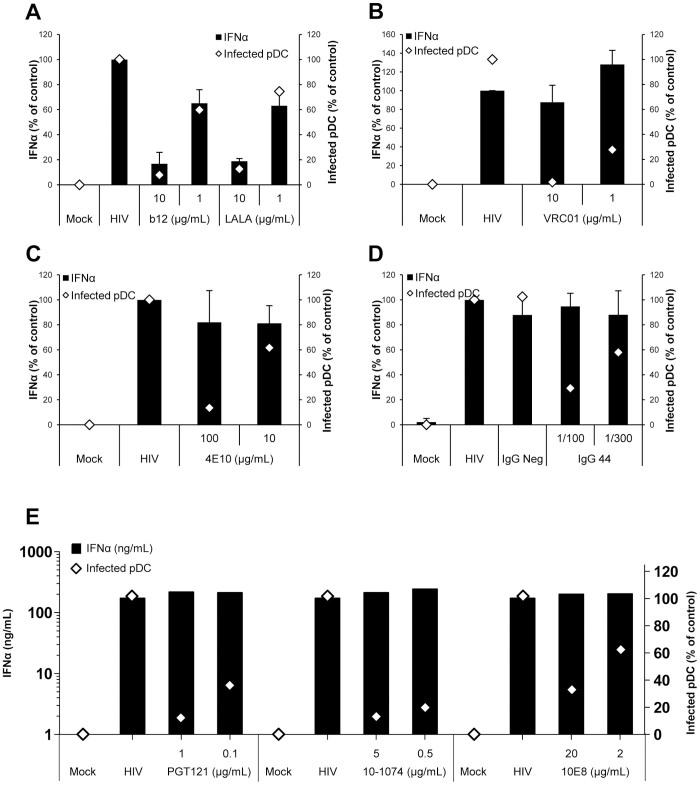
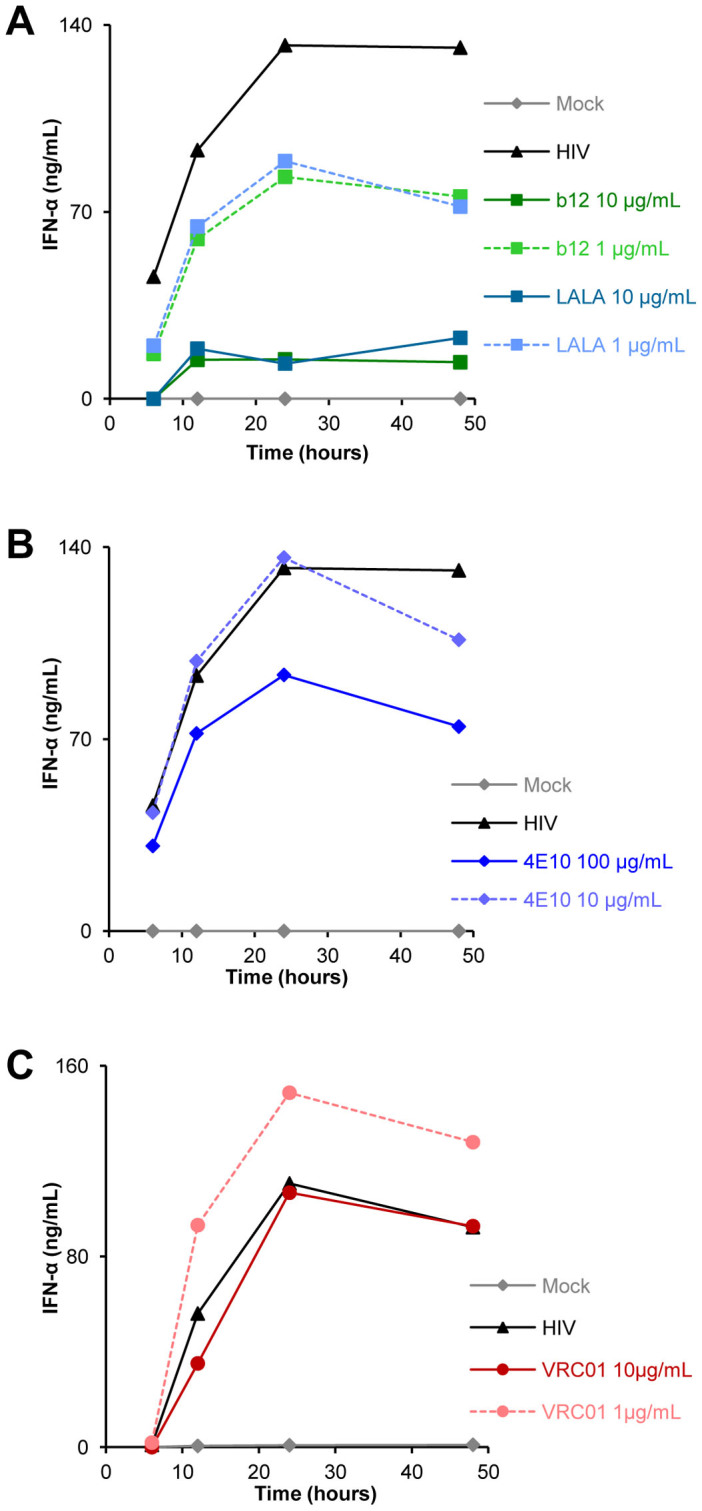
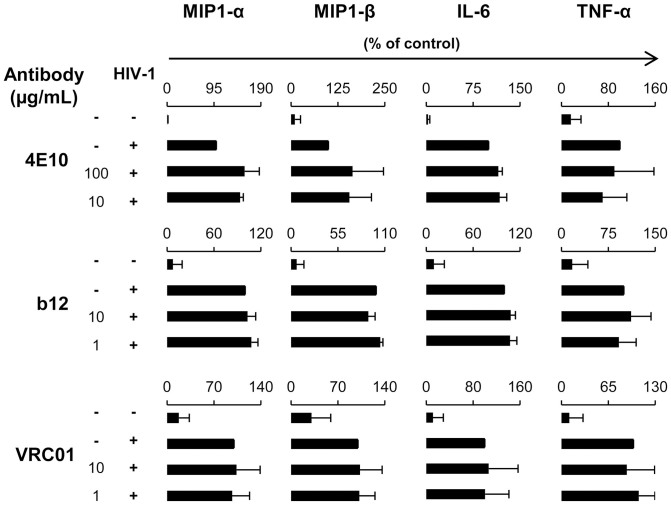
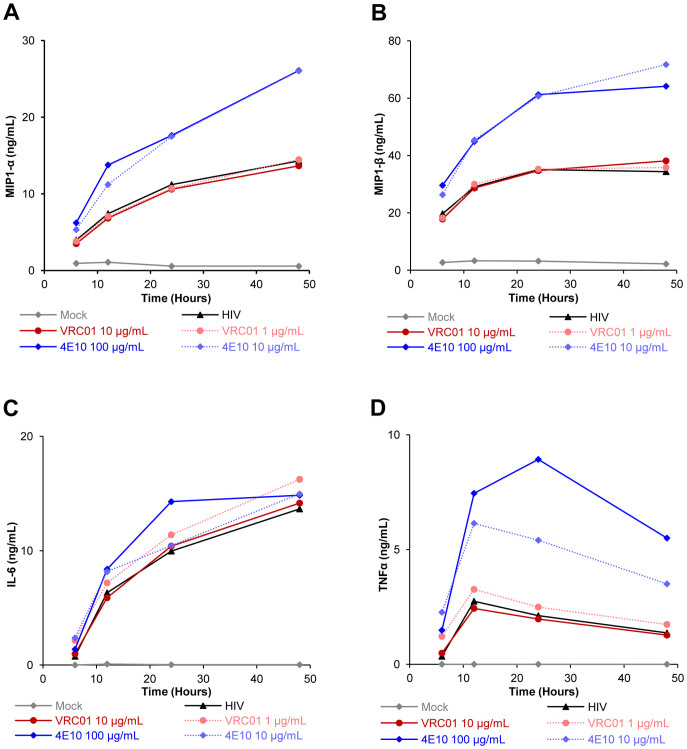
Plasmacytoid dendritic cells (pDC) expressing FcγRIIa are antigen-presenting cells able to link innate and adaptive immunity and producing various cytokines and chemokines. Although highly restricted, they are able to replicate HIV-1. We determined the activity of anti-HIV-1 neutralizing antibodies (NAb) and non-neutralizing inhibitory antibodies (NNIAb) on the infection of primary pDC by HIV-1 primary isolates and analyzed cytokines and chemokines production. Neutralization assay was performed with primary pDC in the presence of serial antibodies (Ab) concentrations. In parallel, we measured the release of cytokines and chemokines by ELISA and CBA Flex assay. We found that NAb, but not NNIAb, inhibit HIV-1 replication in pDC. This inhibitory activity was lower than that detected for myeloid dendritic cells (mDC) infection and independent of FcγRIIa expressed on pDC. Despite the complete protection, IFN-α production was detected in the supernatant of pDC treated with NAb VRC01, 4E10, PGT121, 10-1074, 10E8, or polyclonal IgG44 but not with NAb b12. Production of MIP-1α, MIP-1β, IL-6, and TNF-α by pDC was also maintained in the presence of 4E10, b12 and VRC01. These findings suggest that pDC can be protected from HIV-1 infection by both NAb and IFN-α release triggered by the innate immune response during infection.
Figures
Similar articles
-
HMGB1 Is Involved in IFN-α Production and TRAIL Expression by HIV-1-Exposed Plasmacytoid Dendritic Cells: Impact of the Crosstalk with NK Cells.PLoS Pathog. 2016 Feb 12;12(2):e1005407. doi: 10.1371/journal.ppat.1005407. eCollection 2016 Feb. PLoS Pathog. 2016. PMID: 26871575 Free PMC article.
-
Characterization of the Plasmacytoid Dendritic Cell Response to Transmitted/Founder and Nontransmitted Variants of HIV-1.J Virol. 2018 Sep 12;92(19):e00157-18. doi: 10.1128/JVI.00157-18. Print 2018 Oct 1. J Virol. 2018. PMID: 29997203 Free PMC article.
-
Fc gamma RIIa is expressed on natural IFN-alpha-producing cells (plasmacytoid dendritic cells) and is required for the IFN-alpha production induced by apoptotic cells combined with lupus IgG.J Immunol. 2003 Sep 15;171(6):3296-302. doi: 10.4049/jimmunol.171.6.3296. J Immunol. 2003. PMID: 12960360
-
HIV-1 infection and induction of interferon alpha in plasmacytoid dendritic cells.Curr Opin HIV AIDS. 2011 Sep;6(5):373-8. doi: 10.1097/COH.0b013e328349592a. Curr Opin HIV AIDS. 2011. PMID: 21734568 Review.
-
Role for plasmacytoid dendritic cells in anti-HIV innate immunity.Immunol Cell Biol. 2005 Oct;83(5):578-83. doi: 10.1111/j.1440-1711.2005.01394.x. Immunol Cell Biol. 2005. PMID: 16174110 Review.
Cited by
-
Neutralizing Antibodies Against a Specific Human Immunodeficiency Virus gp41 Epitope are Associated With Long-term Non-progressor Status.EBioMedicine. 2017 Aug;22:122-132. doi: 10.1016/j.ebiom.2017.07.007. Epub 2017 Jul 11. EBioMedicine. 2017. PMID: 28712768 Free PMC article.
-
The Syk-Coupled C-Type Lectin Receptors Dectin-2 and Dectin-3 Are Involved in Paracoccidioides brasiliensis Recognition by Human Plasmacytoid Dendritic Cells.Front Immunol. 2018 Mar 20;9:464. doi: 10.3389/fimmu.2018.00464. eCollection 2018. Front Immunol. 2018. PMID: 29616019 Free PMC article.
-
Flow virometry analysis of envelope glycoprotein conformations on individual HIV virions.Sci Rep. 2017 Apr 19;7(1):948. doi: 10.1038/s41598-017-00935-w. Sci Rep. 2017. PMID: 28424455 Free PMC article.
-
An efficient method for gene silencing in human primary plasmacytoid dendritic cells: silencing of the TLR7/IRF-7 pathway as a proof of concept.Sci Rep. 2016 Jul 14;6:29891. doi: 10.1038/srep29891. Sci Rep. 2016. PMID: 27412723 Free PMC article.
-
HIV-antibody complexes enhance production of type I interferon by plasmacytoid dendritic cells.J Clin Invest. 2017 Dec 1;127(12):4352-4364. doi: 10.1172/JCI95375. Epub 2017 Oct 30. J Clin Invest. 2017. PMID: 29083319 Free PMC article.
References
-
- Kwong P. D., Mascola J. R. & Nabel G. J. Broadly neutralizing antibodies and the search for an HIV-1 vaccine: the end of the beginning. Nat Rev Immunol 13, 693–701 (2013). - PubMed
-
- Mascola J. R. & Montefiori D. C. The role of antibodies in HIV vaccines. Annu Rev Immunol 28, 413–444 (2010). - PubMed
-
- Polonis V. R. et al. Recent advances in the characterization of HIV-1 neutralization assays for standardized evaluation of the antibody response to infection and vaccination. Virology 375, 315–320 (2008). - PubMed
Publication types
MeSH terms
Substances
LinkOut - more resources
Full Text Sources
Other Literature Sources
