. 2014 Sep 8;26(3):331-343.
doi: 10.1016/j.ccr.2014.07.001. Epub 2014 Aug 14.

ER stress cooperates with hypernutrition to trigger TNF-dependent spontaneous HCC development

Affiliations

ER stress cooperates with hypernutrition to trigger TNF-dependent spontaneous HCC development

Hayato Nakagawa et al. Cancer Cell. .

Abstract

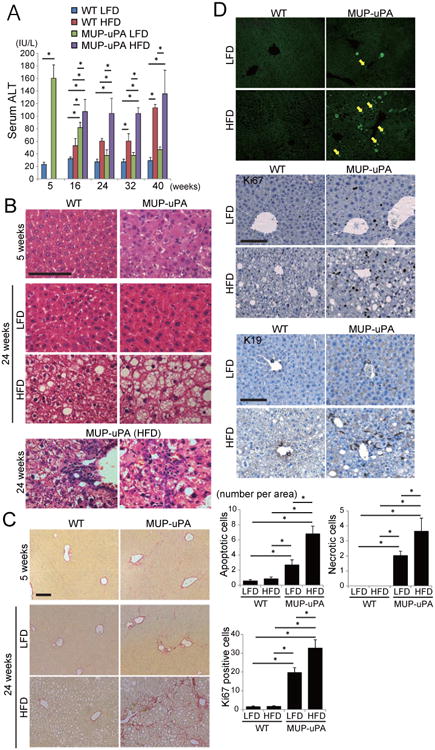
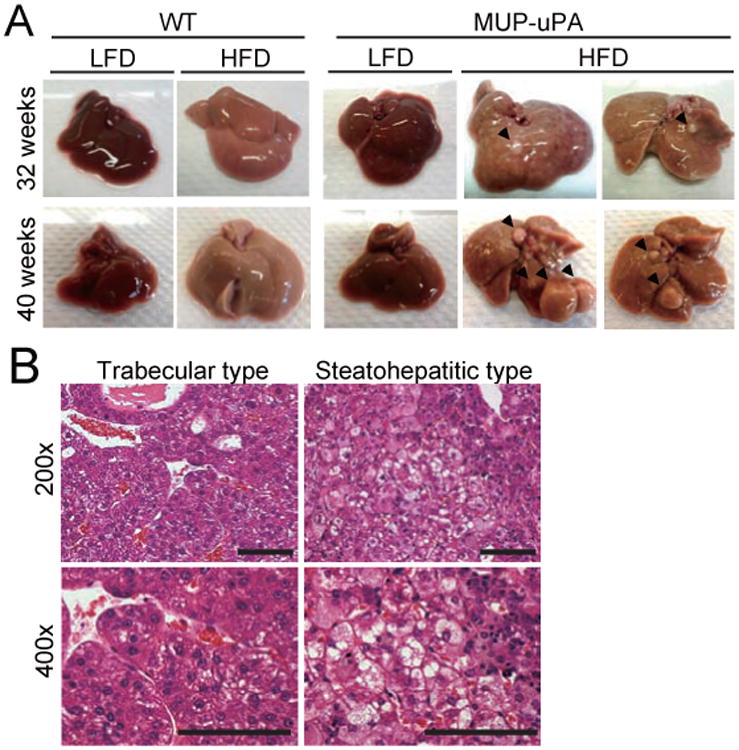
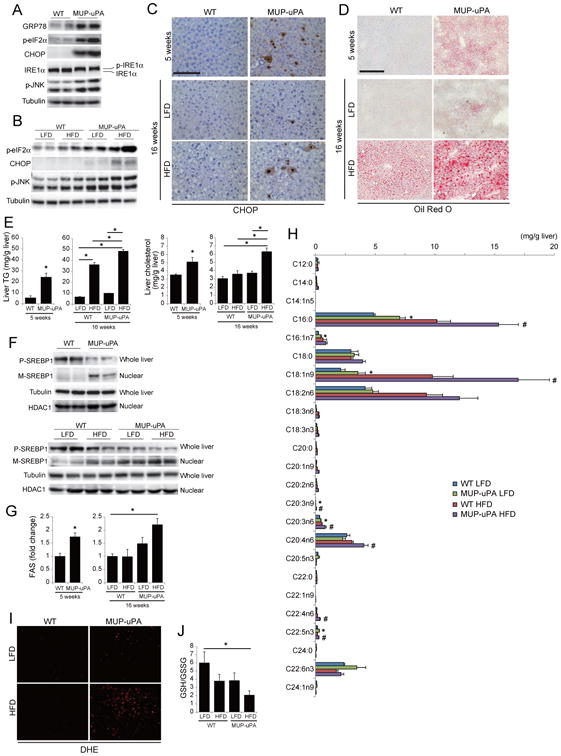
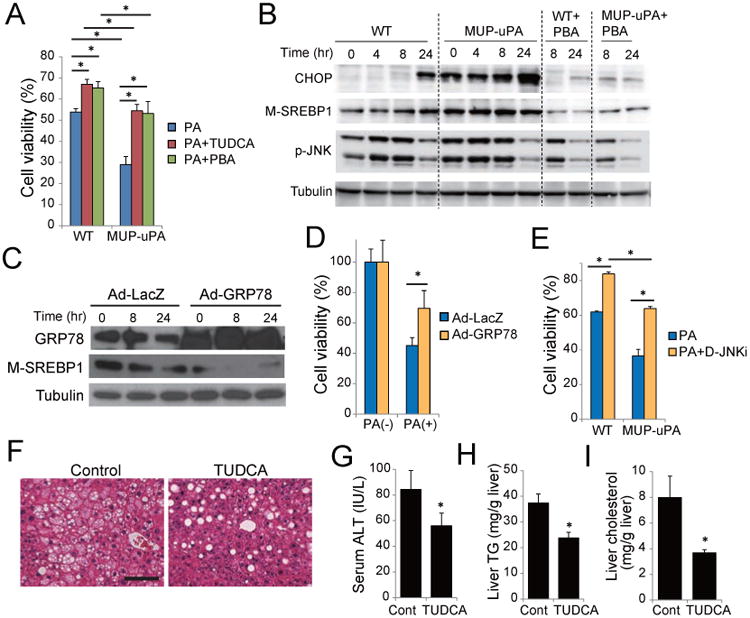
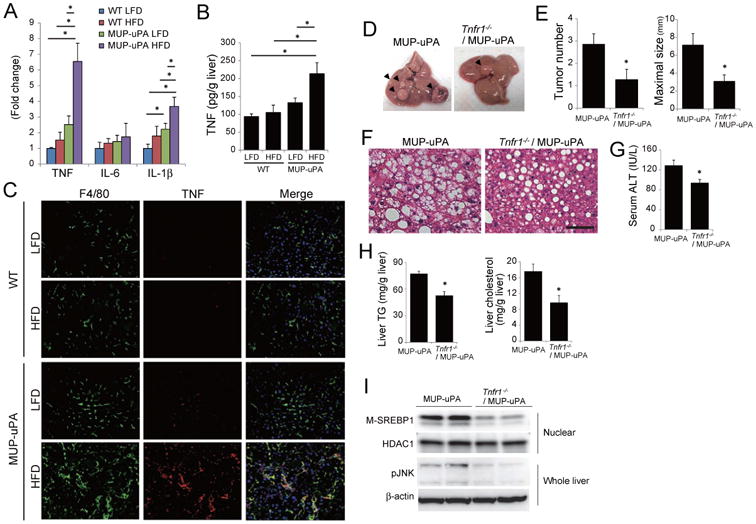
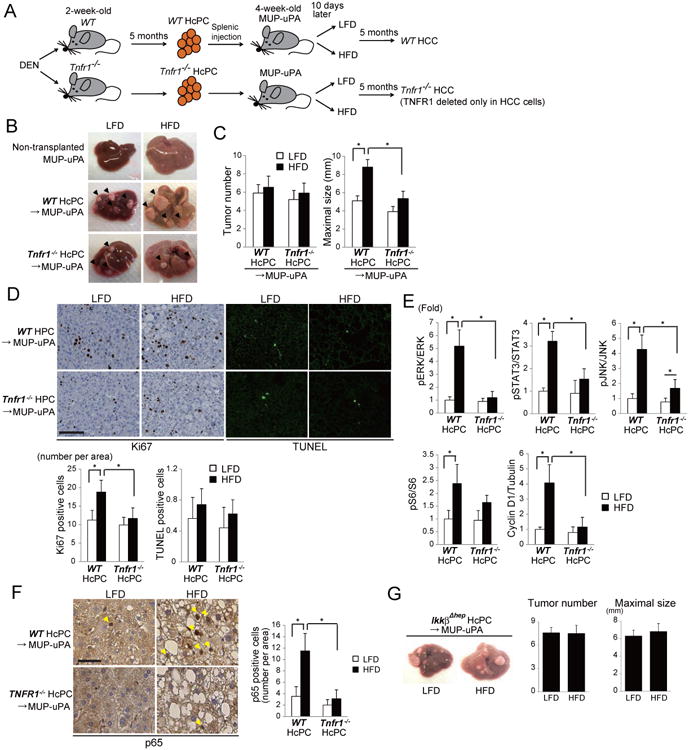
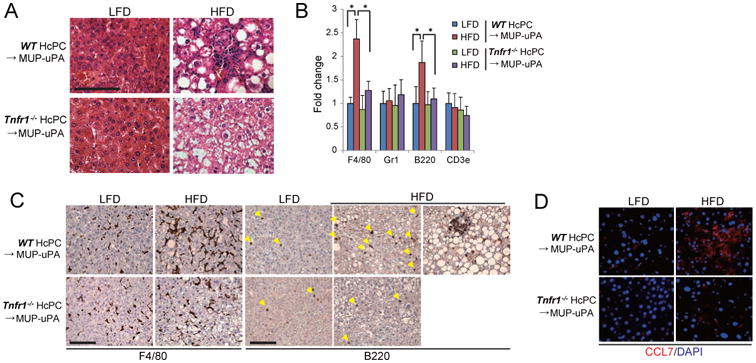
Endoplasmic reticulum (ER) stress has been implicated in the pathogenesis of viral hepatitis, insulin resistance, hepatosteatosis, and nonalcoholic steatohepatitis (NASH), disorders that increase risk of hepatocellular carcinoma (HCC). To determine whether and how ER stress contributes to obesity-driven hepatic tumorigenesis we fed wild-type (WT) and MUP-uPA mice, in which hepatocyte ER stress is induced by plasminogen activator expression, with high-fat diet. Although both strains were equally insulin resistant, the MUP-uPA mice exhibited more liver damage, more immune infiltration, and increased lipogenesis and, as a result, displayed classical NASH signs and developed typical steatohepatitic HCC. Both NASH and HCC development were dependent on TNF produced by inflammatory macrophages that accumulate in the MUP-uPA liver in response to hepatocyte ER stress.


Figures

Figure 1
Figure 1. HFD-fed MUP-uPA mice display classical NASH signs
(A) Serum ALT in LFD- or HFD-fed WT and MUP-uPA mice was measured at indicated ages. HFD feeding was initiated at 6 weeks. Data are means ± S.D. (n = 3-5 per group). *p < 0.05. (B) H&E staining of liver sections from 5 weeks old mice on LFD and 24 weeks old mice kept on LFD or HFD (scale bar = 100 μm). Bottom two panels show infiltration of immune cells in HFD-fed MUP-uPA mouse livers (left, portal area; right, liver parenchyma). (C) Sirius red staining of liver sections described in B (scale bar = 100 μm). (D) TUNEL and IHC analyses of Ki67 and K19 in 24 weeks old mice that were kept on LFD or HFD (scale bar = 100 μm). Yellow and white arrows indicate apoptotic and necrotic cells, respectively. Bar graphs show numbers of apoptotic and necrotic cells and Ki67-positive cells per 200× field. Data are means ± S.D. (n = 5 per group). *p < 0.05. See also Figure S1.
Figure 2
Figure 2. NASH to HCC progression in MUP-uPA mice
(A) Representative images of livers from 32 and 40 weeks old mice that were kept on LFD or HFD. (B) Representative H&E staining of tumor sections from 40 weeks old HFD-fed MUP-uPA mice. Left two panels show trabecular HCC and right two panels show steatohepatitic HCC (scale bar = 100 μm). See also Figure S2.
Figure 3
Figure 3. ER stress enhances lipogenesis and promotes steatohepatitis
(A, B) IB analysis of ER stress markers in livers of 5 weeks old WT and MUP-uPA mice (A) and 16 weeks old WT and MUP-uPA mice kept on LFD or HFD (B). (C) IHC analysis of CHOP in livers of 5 weeks old mice on LFD and 16 weeks old mice kept on LFD or HFD (scale bar = 100 μm). (D) Oil Red O staining of mouse livers described in C (scale bar = 100 μm). (E) TG and cholesterol content of mouse livers described in C. (F) IB analysis of unprocessed precursor SREBP1 (P-SREBP1) in whole liver extract and mature SREBP1 (M-SREBP1) in liver nuclei of mice described in A (upper panels) and B (lower panels). (G) Real time PCR analysis of liver FAS mRNA. (H) Hepatic FA composition in 16 weeks old mice kept on LFD or HFD, analyzed by gas-chromatography. *p < 0.05, compared with LFD-fed WT mice. #p < 0.05, compared with HFD-fed WT mice. (I,J) ROS accumulation in 16 weeks old mice that were kept on LFD or HFD. Images of DHE staining (scale bar = 100 μm) (I) and GSH:GSSG ratio (J) are shown. All bar graphs represent means ± S.D. (n = 3 per group). *p < 0.05. See also Figure S3.
Figure 4
Figure 4. Chemical chaperons attenuate lipotoxicity and liver damage in MUP-uPA mice
(A) Primary hepatocytes from WT and MUP-uPA mice were incubated with 300 μM PA for 24 hr with or without 500 μM TUDCA or 1 mM 4-PBA. Cell viability was assessed using Cell Counting Kit-8 assay. Data are means ± S.D. of triplicate wells. *p < 0.05. (B) Primary hepatocytes from WT and MUP-uPA mice were incubated with 200 μM PA with or without 4-PBA as above. CHOP expression, SREBP1 maturation, and JNK phosphorylation were assessed by IB. (C-D) Effect of GRP78 overexpression. MUP-uPA hepatocytes were infected with adenoviruses encoding LacZ or GRP78 and then incubated with PA. SREBP1 maturation (C) and cell viability (D) were assessed as above. (E) Hepatocytes from WT and MUP-uPA mice were incubated with 300 μM PA for 24 hr with or without 10 μM D-JNKi, and cell viability was assessed. Data are means ± S.D. of triplicate wells. *p < 0.05. (F-I) Effect of TUDCA on NASH in HFD-fed MUP-uPA mice. 16 weeks old HFD-fed MUP-uPA mice were i.p. injected with TUDCA (250 mg/kg) or vehicle, and after 4 weeks of daily treatment, liver histology (scale bar = 100 μm) (F), serum ALT (G), liver TG (H) and liver cholesterol (I) were evaluated. Bar graphs are means ± S.D. (n = 5 per group). *p < 0.05. See also Figure S4.
Figure 5
Figure 5. TNFR1 signaling promotes tumor growth
(A) Relative inflammatory cytokine mRNA in livers of 24 weeks old mice kept on LFD or HFD determined by real-time Q-PCR. Data are means ± S.D. (LFD-fed WT, n = 3; others, n =5 per group). *p < 0.05. (B) TNF protein in livers from A was measured by ELISA. Means ± S.D. *p < 0.05. (C) Double IF analysis of F4/80 (green) and TNF (red) of liver sections from A (scale bar = 100 um). Nuclei were labeled with DAPI (blue). (D-H) Effect of TNFR1 ablation on NASH and tumorigenesis in HFD-fed MUP-uPA mice. MUP-uPA and Tnfr1-/-/MUP-uPA mice were fed HFD from 6 to 40 weeks of age. Representative images of livers (D), tumor numbers and maximal sizes (E), H&E staining of non-tumor areas (scale bar = 100 μm) (F), and serum ALT (G) are shown. Bar graphs represent means ± S.E.M. (MUP-uPA, n = 14; Tnfr1-/-/MUP-uPA, n = 11). *p < 0.05. (H) TG and cholesterol content in non-tumor tissue of HFD-fed MUP-uPA and Tnfr1-/-/MUP-uPA mouse livers. Bar graphs represent means ± S.D. (n = 7 per group). *p < 0.05. (I) IB analyses showing effects of TNFR1 ablation on SREBP1 maturation and JNK phosphorylation in non-tumor tissue of HFD-fed MUP-uPA mice. See also Figure S5.
Figure 6
Figure 6. TNFR1 signaling promotes tumor growth
(A) HcPC isolation from DEN-treated WT and Tnfr1-/- mice and transplantation into MUP-uPA mice. HcPC-transplanted MUP-uPA mice were divided into two groups that were fed with either LFD or HFD, and 5 months later tumorigenesis was assessed. (B) Representative images of non-transplanted and HcPC-transplanted MUP-uPA mouse livers. (C) Tumor numbers and maximal sizes. Results are means ± S.E.M. (n = 10-11 per group). *p < 0.05. (D) Ki67 IHC and TUNEL staining of tumor areas in livers from C (scale bar = 100 μm). Bars represent numbers of apoptotic and necrotic cells and Ki67-positive cells per field. Results are means ± S.D. (n = 6 per group). *p < 0.05. (E) Tumor tissues from WT or Tnfr1-/- HcPC-transplanted MUP-uPA mice kept on LFD or HFD were IB analyzed for phosphorylation of ERK, STAT3, JNK, and S6, and expression of cyclin D1. Data were quantified using Image J software and are presented as means ± S.D. (n = 5-6 per group). *p < 0.05. (F) Activation of NF-κB analyzed by p65/RelA IHC in tumor tissues from MUP-uPA transplanted with WT or Tnfr1-/- HcPC and kept on LFD or HFD (scale bar = 25 μm). Bars show numbers of nuclear p65 positive cancer cells per 200× field. Data are means ± S.D. (n = 6 per group). *p < 0.05. (G) Effect of IKKβ ablation on HFD-stimulated HcPC progression. HcPCs isolated from DEN-injected liver-specific IkkβΔhep were transplanted into MUP-uPA mice as in A and the HcPC-transplanted mice were kept on LFD or HFD. 5 months later, tumor multiplicity and maximal sizes were determined. Data are means ± S.E.M. (n = 10 per group). See also Figure S6.
Figure 7
Figure 7. TNFR1 signaling in cancer cells promotes tumor-elicited inflammation
(A) H&E analysis of tumors from WT or Tnfr1-/- HcPC in MUP-uPA mice that were kept on LFD or HFD (scale bar = 100 μm). (B) Real time PCR determination of immune cell marker mRNAs in tumor tissues. Data are means ± S.D. (n = 5 per group). *p < 0.05. (C) IHC analysis of F4/80- and B220-positive cells in tumor tissues from A (scale bar = 100 μm). (D) IF analysis of CCL7 expression in tumor tissues (scale bar = 25 μm). See also Figure S7.

Comment in

References

    1. Anderson EJ, Lustig ME, Boyle KE, Woodlief TL, Kane DA, Lin CT, Price JW, 3rd, Kang L, Rabinovitch PS, Szeto HH, et al. Mitochondrial H2O2 emission and cellular redox state link excess fat intake to insulin resistance in both rodents and humans. J Clin Invest. 2009;119:573–581. - PMC - PubMed
    1. Brunt EM. Nonalcoholic steatohepatitis: definition and pathology. Semin Liver Dis. 2001;21:3–16. - PubMed
    1. Caldwell S, Ikura Y, Dias D, Isomoto K, Yabu A, Moskaluk C, Pramoonjago P, Simmons W, Scruggs H, Rosenbaum N, et al. Hepatocellular ballooning in NASH. J Hepatol. 2010;53:719–723. - PMC - PubMed
    1. Calle EE, Teras LR, Thun MJ. Obesity and mortality. N Engl J Med. 2005;353:2197–2199. - PubMed
    1. Chen CL, Yang HI, Yang WS, Liu CJ, Chen PJ, You SL, Wang LY, Sun CA, Lu SN, Chen DS, Chen CJ. Metabolic factors and risk of hepatocellular carcinoma by chronic hepatitis B/C infection: a follow-up study in Taiwan. Gastroenterology. 2008;135:111–121. - PubMed

Publication types

MeSH terms

Substances