

Spatial Resolution Requirements for Traffic-Related Air Pollutant Exposure Evaluations
- PMID: 25132794
- PMCID: PMC4131205
- DOI: 10.1016/j.atmosenv.2014.05.065
Spatial Resolution Requirements for Traffic-Related Air Pollutant Exposure Evaluations
Abstract
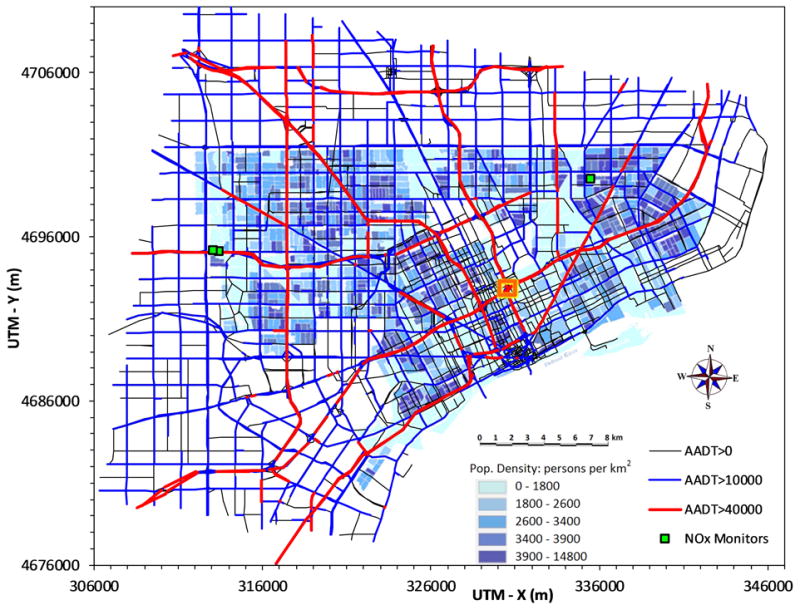
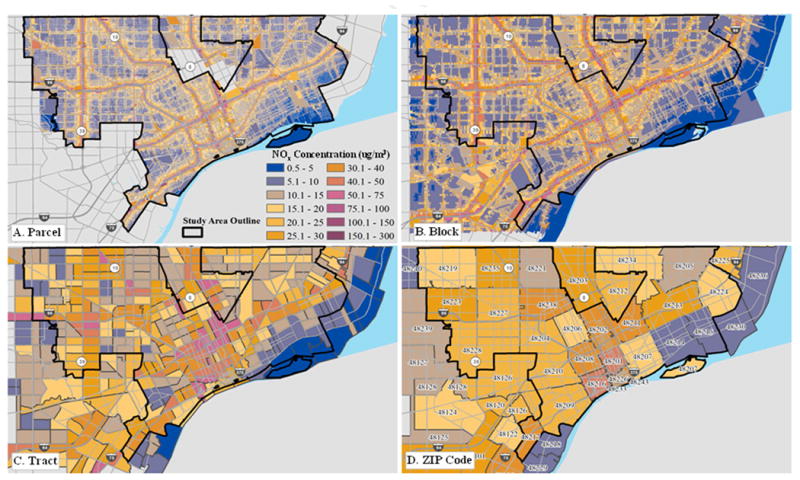
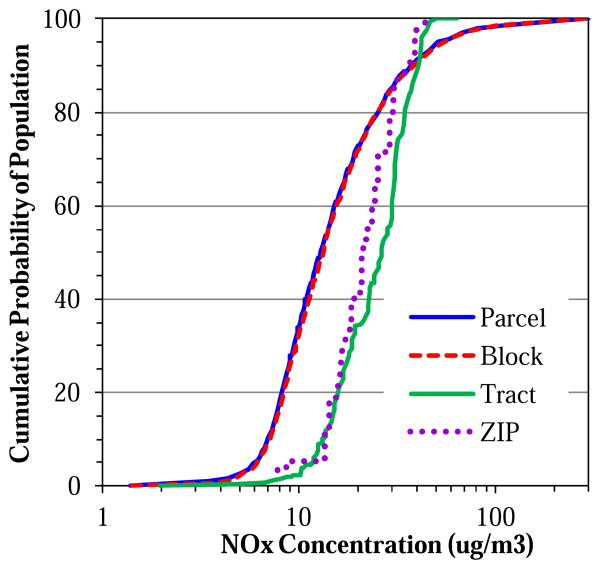
Vehicle emissions represent one of the most important air pollution sources in most urban areas, and elevated concentrations of pollutants found near major roads have been associated with many adverse health impacts. To understand these impacts, exposure estimates should reflect the spatial and temporal patterns observed for traffic-related air pollutants. This paper evaluates the spatial resolution and zonal systems required to estimate accurately intraurban and near-road exposures of traffic-related air pollutants. The analyses use the detailed information assembled for a large (800 km2) area centered on Detroit, Michigan, USA. Concentrations of nitrogen oxides (NOx) due to vehicle emissions were estimated using hourly traffic volumes and speeds on 9,700 links representing all but minor roads in the city, the MOVES2010 emission model, the RLINE dispersion model, local meteorological data, a temporal resolution of 1 hr, and spatial resolution as low as 10 m. Model estimates were joined with the corresponding shape files to estimate residential exposures for 700,000 individuals at property parcel, census block, census tract, and ZIP code levels. We evaluate joining methods, the spatial resolution needed to meet specific error criteria, and the extent of exposure misclassification. To portray traffic-related air pollutant exposure, raster or inverse distance-weighted interpolations are superior to nearest neighbor approaches, and interpolations between receptors and points of interest should not exceed about 40 m near major roads, and 100 m at larger distances. For census tracts and ZIP codes, average exposures are overestimated since few individuals live very near major roads, the range of concentrations is compressed, most exposures are misclassified, and high concentrations near roads are entirely omitted. While smaller zones improve performance considerably, even block-level data can misclassify many individuals. To estimate exposures and impacts of traffic-related pollutants accurately, data should be geocoded or estimated at the most-resolved spatial level; census tract and larger zones have little if any ability to represent intraurban variation in traffic-related air pollutant concentrations. These results are based on one of the most comprehensive intraurban modeling studies in the literature and results are robust. Recommendations address the value of dispersion models to portray spatial and temporal variation of air pollutants in epidemiology and other studies; techniques to improve accuracy and reduce the computational burden in urban scale modeling; the necessary spatial resolution for health surveillance, demographic, and pollution data; and the consequences of low resolution data in terms of exposure misclassification.
Keywords: Air pollution; Exposure; Exposure misclassification; Traffic.
Figures
References
-
- Barzyk TM, George BJ, Vette AF, Williams RW, Croghan CW, Stevens CD. Development of a distance-to-roadway proximity metric to compare near-road pollutant levels to a central site monitor. Atmospheric Environment. 2009;43(4):787–797.
-
- Bell ML, Morgenstern RD, Harrington W. Quantifying the human health benefits of air pollution policies: Review of recent studies and new directions in accountability research. Environmental Science & Policy. 2011;14(4):357–368.
-
- Brauer M. How Much, How Long, What, and Where. Proceedings of the American Thoracic Society. 2010;7(2):111–115. - PubMed
Grants and funding
LinkOut - more resources
Full Text Sources
Other Literature Sources