Review
. 2014 Jul 31:5:362.
doi: 10.3389/fpls.2014.00362. eCollection 2014.

Leaf development: a cellular perspective

Affiliations
Review

Leaf development: a cellular perspective

Shweta Kalve et al. Front Plant Sci. .

Abstract

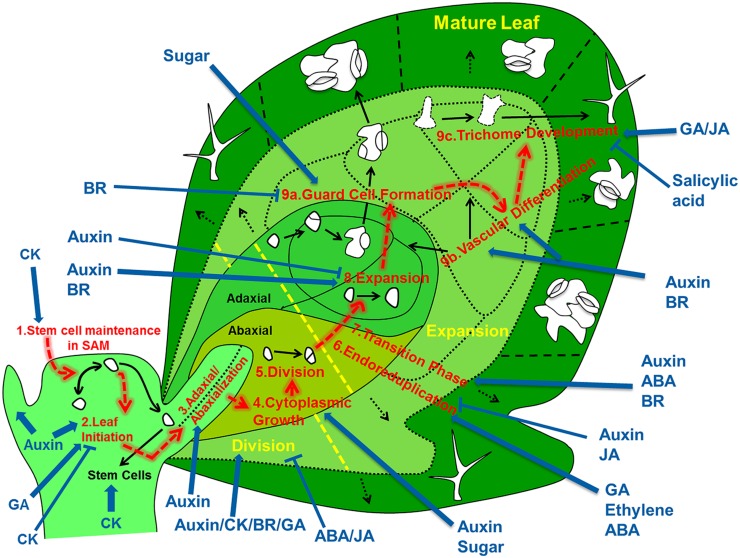
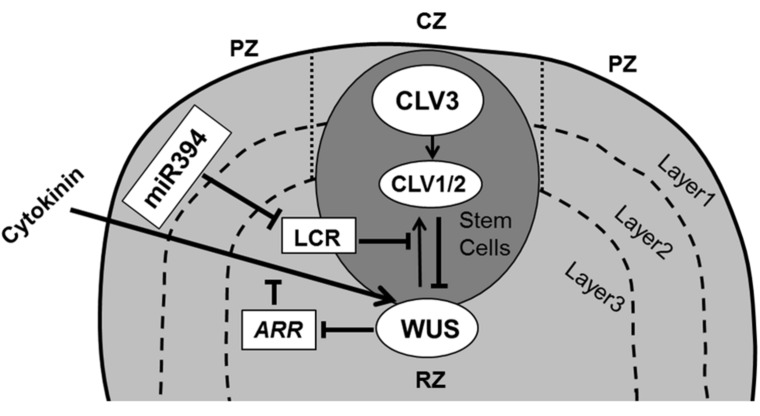
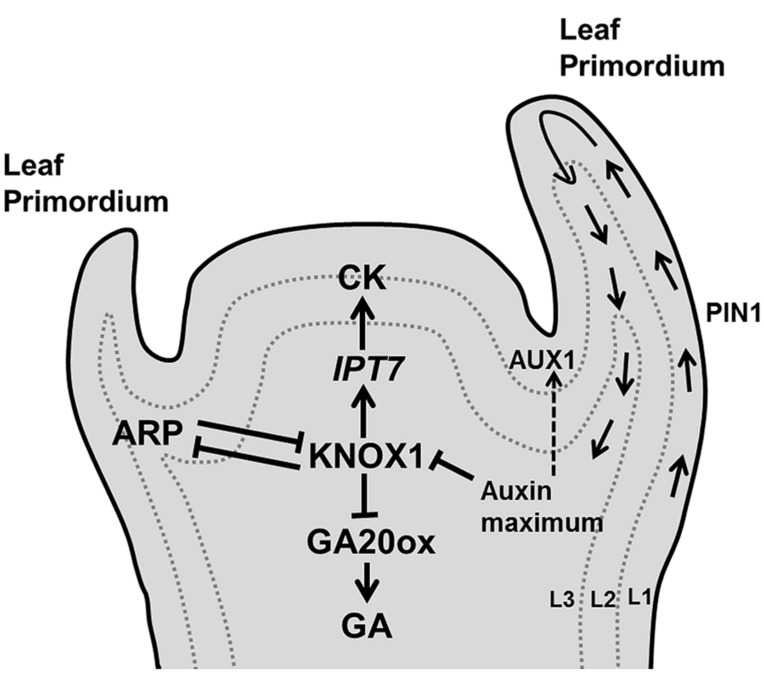
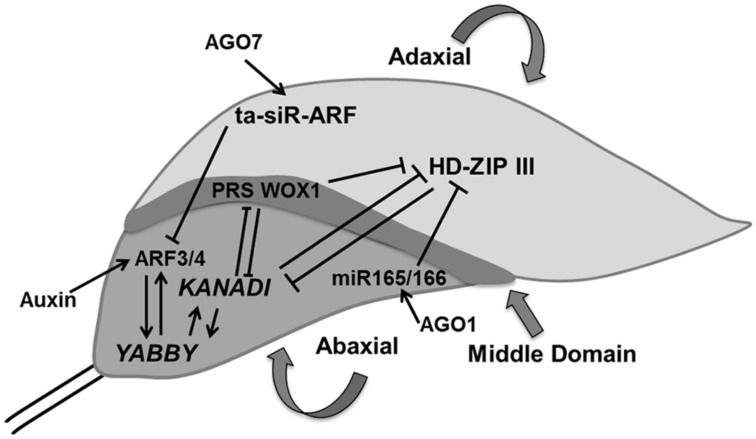
Through its photosynthetic capacity the leaf provides the basis for growth of the whole plant. In order to improve crops for higher productivity and resistance for future climate scenarios, it is important to obtain a mechanistic understanding of leaf growth and development and the effect of genetic and environmental factors on the process. Cells are both the basic building blocks of the leaf and the regulatory units that integrate genetic and environmental information into the developmental program. Therefore, to fundamentally understand leaf development, one needs to be able to reconstruct the developmental pathway of individual cells (and their progeny) from the stem cell niche to their final position in the mature leaf. To build the basis for such understanding, we review current knowledge on the spatial and temporal regulation mechanisms operating on cells, contributing to the formation of a leaf. We focus on the molecular networks that control exit from stem cell fate, leaf initiation, polarity, cytoplasmic growth, cell division, endoreduplication, transition between division and expansion, expansion and differentiation and their regulation by intercellular signaling molecules, including plant hormones, sugars, peptides, proteins, and microRNAs. We discuss to what extent the knowledge available in the literature is suitable to be applied in systems biology approaches to model the process of leaf growth, in order to better understand and predict leaf growth starting with the model species Arabidopsis thaliana.

Keywords: developmental pathway; leaf growth; modeling; plant hormones; stress.


Figures

FIGURE 1
FIGURE 1
Overview of the regulatory processes that determine the development of a leaf. The cells that form the leaf originate from the stem cell niche at the shoot apical meristem. As a first step in their development, cells need to loose stem cell identity (1). A leaf primordium is initiated in groups of cells that migrate into the lateral regions of the SAM (2), which further acquires upper (adaxial) and lower (abaxial) sides through leaf-polarity control (3). Afterward, the transformation of the small leaf primordium to a mature leaf is controlled by at least six distinct processes: cytoplasmic growth (4), cell division (5), endoreduplication (6), transition between division and expansion (7), cell expansion (8) and cell differentiation (9) into stomata (9a), vascular tissue (9b), and trichomes (9c). Most of these processes are tightly controlled by different signaling molecules, including phytohormones. The developmental path of cells is indicated with red arrows, key regulatory processes are numbered and indicated and regulation of these processes by phytohormones/sugar is shown by blue arrows (pointed and T shaped arrows indicate positive and negative regulation, respectively).
FIGURE 2
FIGURE 2
Maintenance of stem cells in shoot apical meristem. The SAM is organized in three functional zones [central zone (CZ), peripheral zone (PZ), and rib zone (RZ)] and three layers where the antagonistic relation between WUS and CLV is essential to preserve cells in the meristem. WUS activates CLV3, which further binds with CLV1/2 and in turn inhibits expression of WUS. Cytokinin positively controls WUS expression where ARRs are negative regulators of cytokinin and are inhibited by WUS. The L1 specific miR394 negatively affects the LCR protein, which interferes in WUS/CLV based stem cell maintenance (pointed and T shaped arrows indicate positive and negative regulation, respectively).
FIGURE 3
FIGURE 3
Decision of leaf initiation. Accumulation peaks of auxin at the flank of the SAM through PIN1/AUX1 mediate polar auxin transport, triggers development of a primordium where KNOX1 plays key role in stem cell maintenance. Additionally, KNOX1 positively regulates CK whereas it negatively affects GA signaling through IPT7 and GA20 oxidases, respectively. Opposite to it, ARP regulates the emergence of a young primordium (pointed and T shaped arrows indicate positive and negative regulation, respectively).
FIGURE 4
FIGURE 4
Polarity control. The young leaf primordium has three domains which are determined by domain specific transcription factors such as HD-ZIP III, KANADI, and PRS WOX1 for adaxial, abaxial, and middle regions, respectively. These transcription factors inhibit expression of each other and thereby control their expression in another domain. AGO1 regulates miR165/66 which inhibits HD-ZIP III whereas AGO7 stabilizes ta-siR-ARF which causes the degradation of ARF3/4, which itself is controlled by auxin. YABBY determines the abaxial side in cross talk with KANADI (pointed and T shaped arrows indicate positive and negative regulation, respectively).
FIGURE 5
FIGURE 5
Cytoplasmic growth. TOR is the central regulator of diverse growth processes. TOR, RAPTOR, and LST8 are major components of TORC1 in plants. TOR has been reported to regulate different metabolic processes and positively controls cell expansion, cell cycle, translation, ribosome biogenesis (through phosphorylation of S6 kinase/EBP1). TOR activity inhibits autophagy and accumulation of carbon resources such as starch and lipids like triacylglycerides (TAGs). Auxin positively regulates EBP1 proteins. It has been reported that sucrose positively affects TOR activity (pointed and T shaped arrows indicate positive and negative regulation and question mark indicates an unknown mechanism, respectively).
FIGURE 6
FIGURE 6
Molecular mechanism for cell cycle regulation. Four phases of cell cycle (G1, S, G2, and M) are operated by successive activation and deactivation of cyclin dependent kinases (CDKs). During the cell cycle these kinases bind with cyclins and get activated through phosphorylation by CDK activating kinases (CDKD and CDKF) whereas KRPs inhibit the complexes. G1 to S transition is controlled by CDKA–CYCD which phosphorylates the RBR proteins and releases the E2F transcription factor, which activates S phase related genes. The G2–M transition is dependent on CDKA/B and CYCA/B/D. The CDK complex is inactivated by phosphorylation through WEE1. The exit from mitosis requires proteolytic degradation of CYCs which as mediated by the Anaphase-Promoting Complex/Cyclosome (APC/C) bind with CCS52 and CDC20. Phytohormones like auxin, cytokinin, gibberellins (GA), brassinosteroids, abscisic acid (ABA) and methyl jasmonate (MeJA) impact cell cycle regulation at different points (pointed and T shaped arrows indicate positive and negative regulation and question mark indicates unknown regulation, respectively).
FIGURE 7
FIGURE 7
Regulation of endoreduplication. CDKA/B and CYC activity is inhibited by cell cycle inhibitors KRPs/SIM/SMRs that induce endoploidization. Cyclin A is inhibited by the ILP1 proteins whereas down-regulation of MYB3R causes decreased CYCB and ultimately induces endoploidization. Proteolytic degradation of G2–M cyclins by the APC/C complex causes endocycle onset. Other factors like, UVI4 and DEL1 suppress the endocycle by inhibiting the APC/C complex. Plant hormones like auxin and jasmonic acid suppress the endocycle whereas gibberellins (GA), abscisic acid (ABA), and ethylene stimulate it by regulating expression and activity of different components (pointed and T shaped arrows indicate positive and negative regulation and question mark shows the unknown regulation, respectively).
FIGURE 8
FIGURE 8
Regulation of the transition between proliferation and cell expansion. The transition between division and expansion is shown by a dashed line which separates these two growth processes according to their regulators. ARGOS promotes cell division via DNA binding protein ANT and CYCD3 which is regulated by auxin. TCP and GIF/GRF transcription factors promote division and are negatively regulated by miRNAs. Other factors like KLU and SWP also promote proliferation. Some factors like ORS1 have a positive influence on division as well as expansion. Cell expansion is directly controlled by the TOR pathway and ARL. Whereas, other regulators like BB, MED25, and DA1 control the timing of proliferation. Abscisic acid promotes transition at least in part by regulating DA1 whereas brassinosteroids with unknown molecular mechanism (pointed and T shaped arrows indicate positive and negative regulation of the particular process and question marks show unknown mechanisms, respectively).
FIGURE 9
FIGURE 9
Regulation of the cell expansion process with unknown molecular mechanism. Cell expansion is the result of vacuolar enlargement as well turgor driven cell wall yielding. The vacuole expands while taking up water and solutes whereas turgor driven cell wall yielding is the result of multiple steps, including hydration and cell wall loosening, cell wall extension by turgor pressure, dehydration/cell wall stiffening by release of apoplastic reactive oxygen species, cross-linking and dehydration and lastly synthesis and accumulation of cell wall components. Cell wall loosening is controlled by expansin (EXP) proteins and the xyloglucan endohydrolase (XEH) and xyloglucan endotransglucosylase (XET) activities of xyloglucan endotransglucosylase/hydrolases (XTHs). Auxin and brassinosteroid (BR) enhance activity of P-type plasma membrane proton ATPase (AHA; pointed and T shaped arrows indicate positive and negative regulation and question mark shows the unknown regulation, respectively).
FIGURE 10
FIGURE 10
The control of stomatal development. Stomatal fate is determined by three transcription factors, SPEECHLESS (SPCH), MUTE, and FAMA. Specification of stomatal lineage where conversion of a protodermal cell into a meristemoid mother cell (MMC) is regulated by SPCH, MUTE controls the transition from meristemoid to guard mother cell (GMC) and FAMA is essential to make functional guard cells from GMC. The MAPK signaling cascade including the MAPK kinase YODA, MPKK4/5/7/9 and MAPKs (MPK3/6), EPIDERMAL PATTERNING FACTORs (EPF1 and EPF2) perceived by TMM and the ER family inhibit stomatal identity in non-stomatal cells. Brassinosteroids negatively regulate SPCH as well MAPKs simultaneously (pointed and T shaped arrows indicate positive and negative regulation, respectively).
FIGURE 11
FIGURE 11
Regulation of vascular development. Central regulators for vascular development involves the REV/PHB/PHV/CAN/ATHB8 genes which are members of HD-ZIP III family and KAN (KANADI). These regulators act antagonistically to maintain xylem and phloem, respectively. Transcription factors, SHR (SHORT ROOT) and SCR (SCARECROW) activate miR165/166, which further inhibits HD-ZIP III. Auxin plays an essential role in regulating vascular formation through PIN1 transporter by early markers like ATHB8. BRASSINOSTEROID INSENSITIVE 1 (BRI1) family, BRI1-LIKE (BRLs) inhibit phloem formation while inducing xylem formation. Expression of VND6/7 affects the formation of proto/metaxylem (pointed and T shaped arrows indicate positive and negative regulation, respectively).
FIGURE 12
FIGURE 12
Regulation of trichome differentiation. Transcription factors GLABRA1 (GL1), GLABRA3 (GL3), and TRANSPARENT TESTA GLABRA1 (TTG1) forming the MYB/bHLH/WD-repeat complex activates trichome development whereas CAPRICE (CPC), TRIPTYCHON (TRY), ENHANCER OF TRY AND CPCs (ETC1, ETC2, and ETC3), and TRICHOMELESS1 (TCL1) inhibit the process. The MYB/bHLH/WD-repeat complex causes the activation of GL2, TTG2, and SIM to induce trichome differentiation. Trichome production is enhanced by gibberellins and jasmonic acid, while salicylic acid inhibit it (pointed and T shaped arrows indicate positive and negative regulation, respectively).

References

    1. Achard P., Gusti A., Cheminant S., Alioua M., Dhondt S., Coppens F., et al. (2009). Gibberellin signaling controls cell proliferation rate in Arabidopsis. Curr. Biol. 19 1188–1193 10.1016/j.cub.2009.05.059 - DOI - PubMed
    1. Adenot X., Elmayan T., Lauressergues D., Boutet S., Bouche N., Gasciolli V., et al. (2006). DRB4-dependent TAS3 trans-acting siRNAs control leaf morphology through AGO7. Curr. Biol. 16 927–932 10.1016/j.cub.2006.03.035 - DOI - PubMed
    1. Akita K., Hasezawa S., Higaki T. (2013). Breaking of plant stomatal one-cell-spacing rule by sugar solution immersion. PLoS ONE 8:e72456 10.1371/journal.pone.0072456 - DOI - PMC - PubMed
    1. Anastasiou E., Kenz S., Gerstung M., Maclean D., Timmer J., Fleck C., et al. (2007). Control of plant organ size by KLUH/CYP78A5-dependent intercellular signaling. Dev. Cell 13 843–856 10.1016/j.devcel.2007.10.001 - DOI - PubMed
    1. Anderson G. H., Veit B., Hanson M. R. (2005). The Arabidopsis AtRaptor genes are essential for post-embryonic plant growth. BMC Biol. 3:12 10.1186/1741-7007-3-12 - DOI - PMC - PubMed

LinkOut - more resources