

Suggestion of suitable animal models for in vivo studies of protein tyrosine phosphatase 1b (PTP1B) inhibitors using computational approaches
- PMID: 25133088
- PMCID: PMC4132456
- DOI: 10.1186/2193-1801-3-380
Suggestion of suitable animal models for in vivo studies of protein tyrosine phosphatase 1b (PTP1B) inhibitors using computational approaches
Abstract
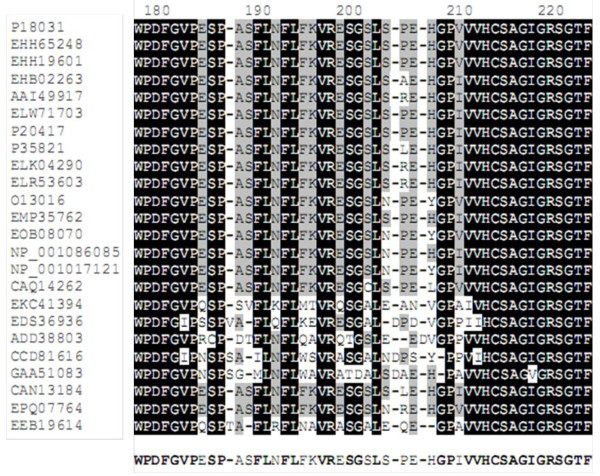
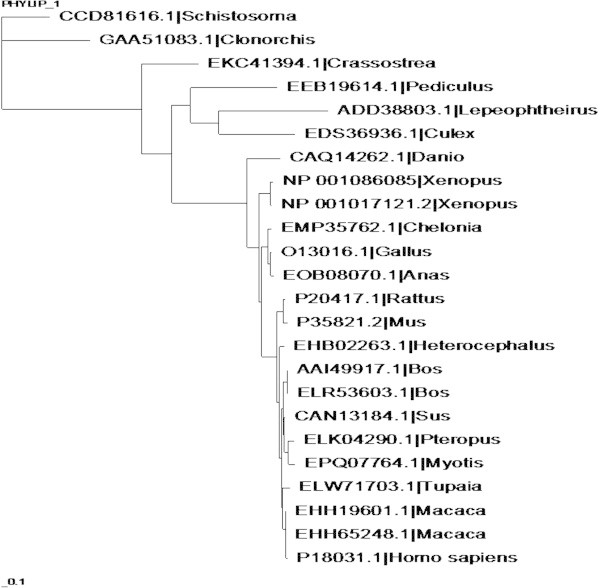
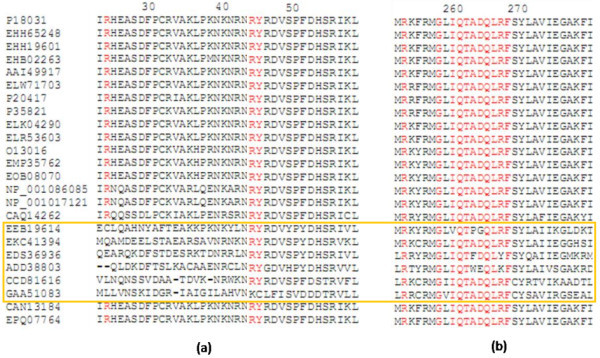
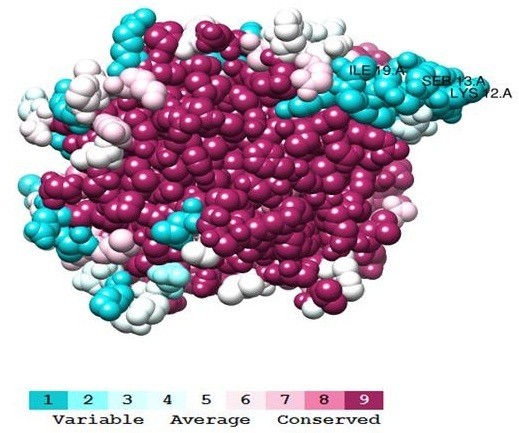
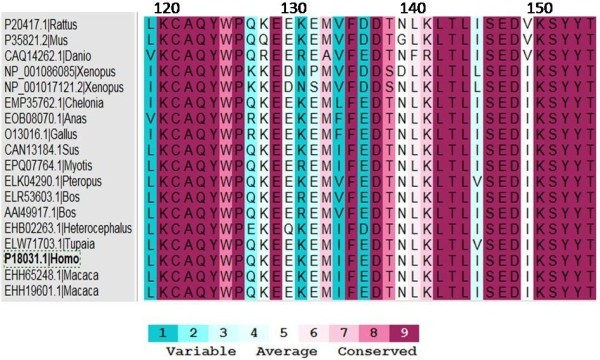
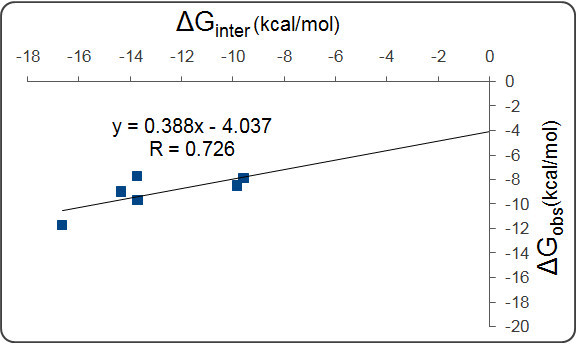
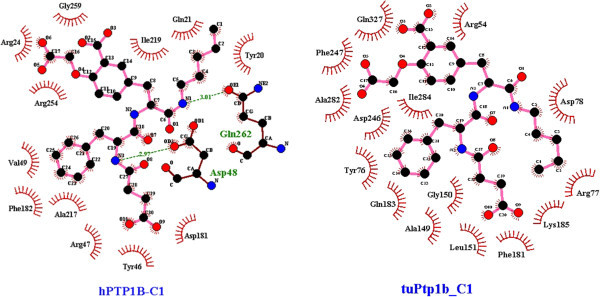
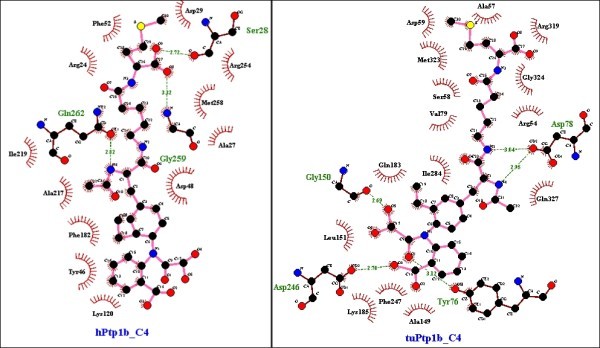
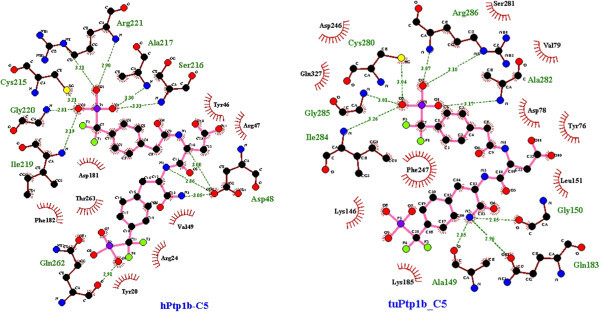
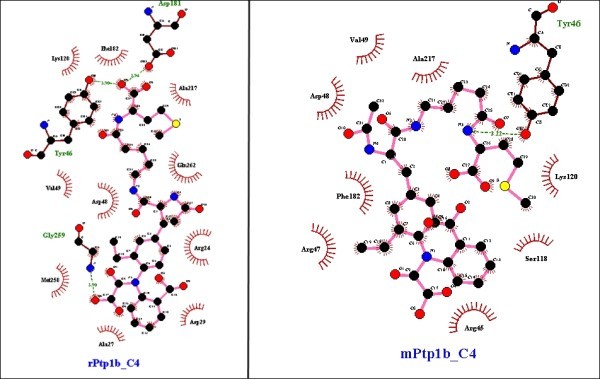
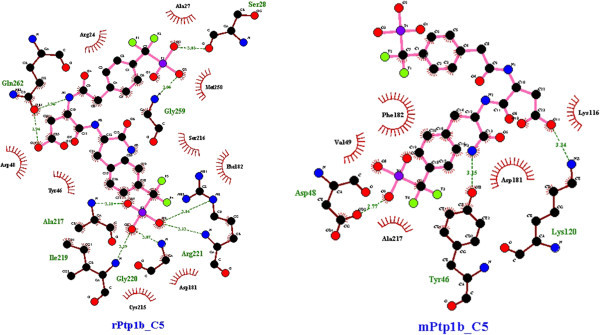
PTP1B is a prototypic enzyme of the superfamily protein tyrosine phosphatases (PTPs) which are critical regulators of tyrosine phosphorylation-dependent signaling events. It is a highly plausible candidate for designing therapeutic inhibitors of obesity and type 2 diabetes (T2D). In this study, a detailed comparative analysis to reveal the evolutionary relationship of human PTP1B among related vertebrates has been addressed. The phylogenetic trees were constructed with maximum likelihood algorithm by PhyML package on the basis of multiple sequence alignment (MSA) by ClustalΩ and T-coffee. Mutational variability of the sequences corresponding to the 3D structure (pdb: 2vev) was analyzed with Consurf software. The comparative analysis by inhibitor docking to different models was made to confirm the suitability of models. As a result, the PTP1B or PTP non-receptor type 1 homologies show high conservativity where about 70% positions on primary structures are conserved. Within PTP domain (3-277), the most variable positions are 12, 13, 19 and 24 which is a part of the second aryl binding site. Moreover, there are important evolutional mutations that can change the conformation of the proteins, for instance, hydrophilic N139 changed to hydrophobic Gly (mPTP1B); E132 to proline in the hydrophobic core structure or Y46 to cystein in pTyr recognition loop. These variations/differences should be taken into account for rational inhibitor design and in choosing suitable animal models for drug testing and evaluation. Moreover, our study suggests critically potential models which are Heterocephalus glaber, Tupaia chinensis, Sus scrofa, and Rattus norvegicus in addition to the best one Macaca fascicularis. Among these models, the H.glaber and R.norvegicus are preferable over M.musculus thanks to their similarity in binding affinity and binding modes to investigated PTP1B inhibitors.
Keywords: Animal model; Conservativity; Inhibitor docking; PTP1B; Phylogenetic study; Variation.
Figures
Similar articles
-
Probing the molecular basis for potent and selective protein-tyrosine phosphatase 1B inhibition.J Biol Chem. 2002 Oct 25;277(43):41014-22. doi: 10.1074/jbc.M207347200. Epub 2002 Aug 21. J Biol Chem. 2002. PMID: 12193602
-
The role of protein-tyrosine phosphatase 1B in integrin signaling.J Biol Chem. 2005 Jul 1;280(26):24857-63. doi: 10.1074/jbc.M502780200. Epub 2005 May 2. J Biol Chem. 2005. PMID: 15866871
-
In silico structure-based design of a potent and selective small peptide inhibitor of protein tyrosine phosphatase 1B, a novel therapeutic target for obesity and type 2 diabetes mellitus: a computer modeling approach.J Biomol Struct Dyn. 2006 Feb;23(4):377-84. doi: 10.1080/07391102.2006.10531233. J Biomol Struct Dyn. 2006. PMID: 16363874
-
Recent development of small molecular specific inhibitor of protein tyrosine phosphatase 1B.Med Res Rev. 2007 Jul;27(4):553-73. doi: 10.1002/med.20079. Med Res Rev. 2007. PMID: 17039461 Review.
-
Involvement of the small protein tyrosine phosphatases TC-PTP and PTP1B in signal transduction and diseases: from diabetes, obesity to cell cycle, and cancer.Biochim Biophys Acta. 2005 Dec 30;1754(1-2):108-17. doi: 10.1016/j.bbapap.2005.07.030. Epub 2005 Sep 12. Biochim Biophys Acta. 2005. PMID: 16198645 Review.
References
LinkOut - more resources
Full Text Sources
Other Literature Sources
Research Materials
Miscellaneous
