. 2014 Aug 18;9(8):e104894.
doi: 10.1371/journal.pone.0104894. eCollection 2014.

Voxel-based MRI intensitometry reveals extent of cerebral white matter pathology in amyotrophic lateral sclerosis

Affiliations

Voxel-based MRI intensitometry reveals extent of cerebral white matter pathology in amyotrophic lateral sclerosis

Viktor Hartung et al. PLoS One. .

Abstract

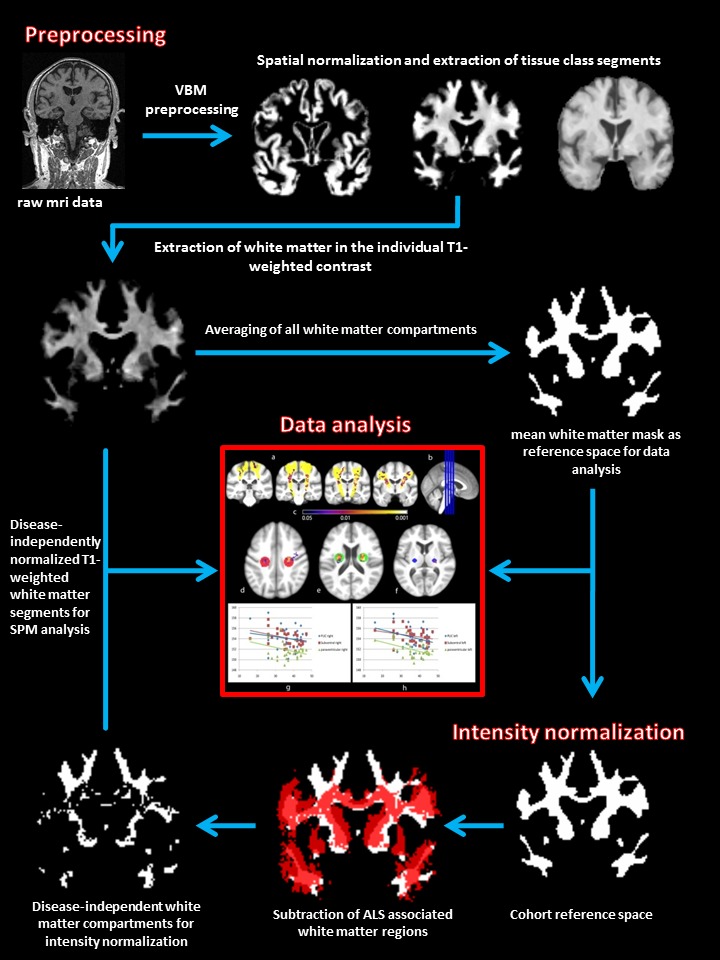
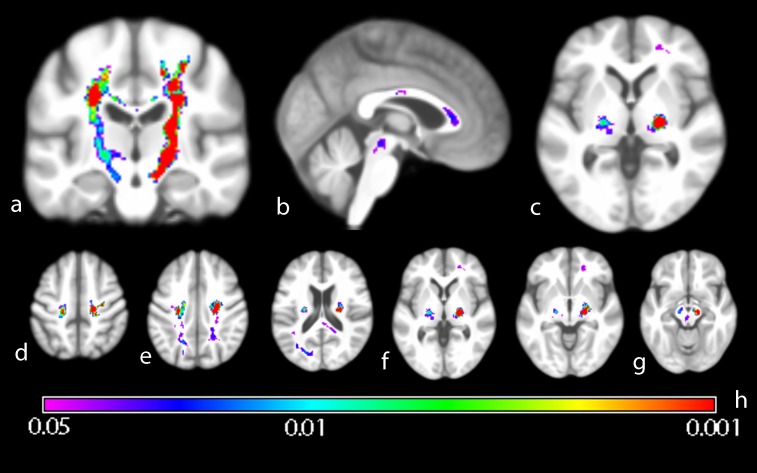
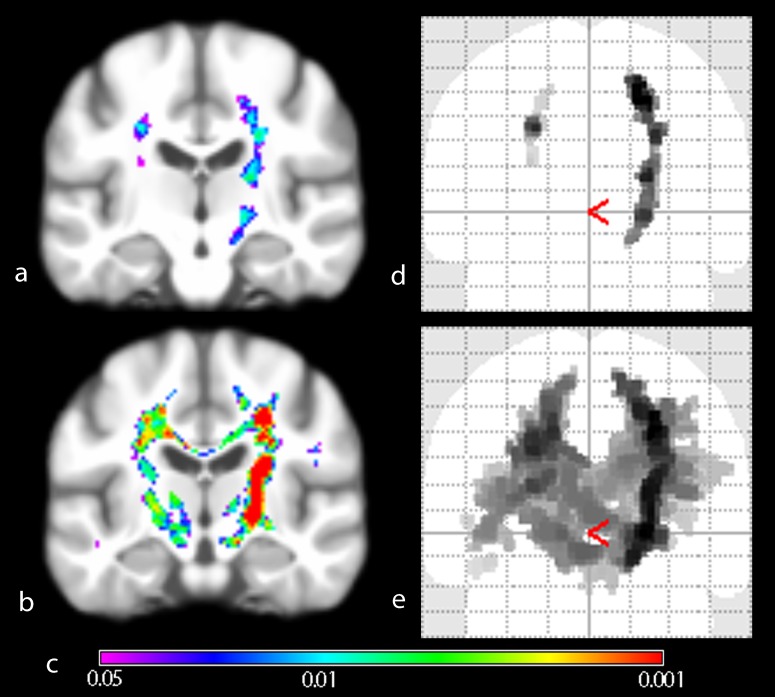
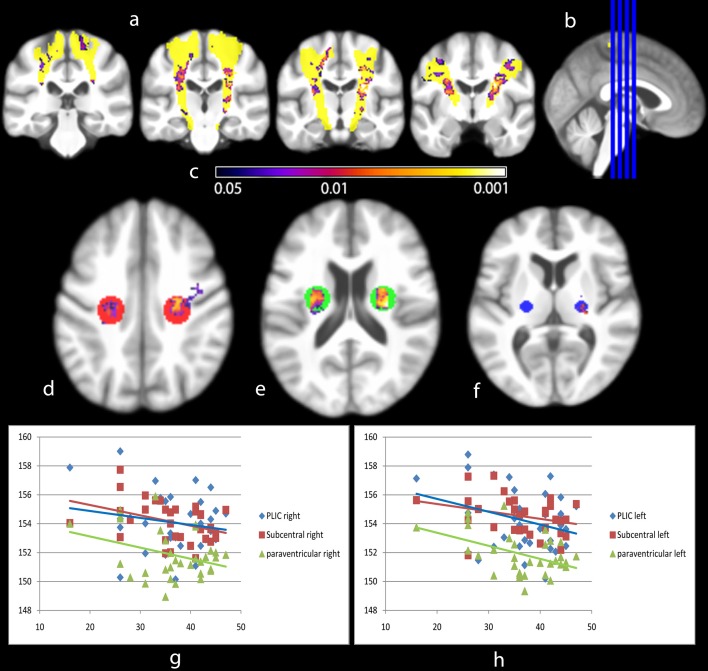
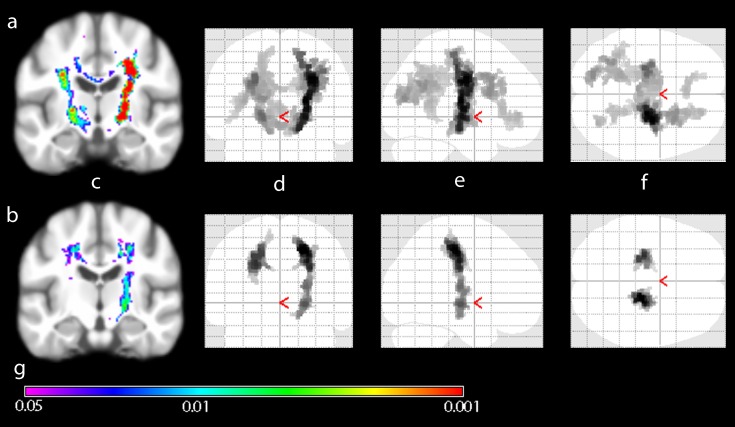
Amyotrophic lateral sclerosis (ALS) is characterized by progressive loss of upper and lower motor neurons. Advanced MRI techniques such as diffusion tensor imaging have shown great potential in capturing a common white matter pathology. However the sensitivity is variable and diffusion tensor imaging is not yet applicable to the routine clinical environment. Voxel-based morphometry (VBM) has revealed grey matter changes in ALS, but the bias-reducing algorithms inherent to traditional VBM are not optimized for the assessment of the white matter changes. We have developed a novel approach to white matter analysis, namely voxel-based intensitometry (VBI). High resolution T1-weighted MRI was acquired at 1.5 Tesla in 30 ALS patients and 37 age-matched healthy controls. VBI analysis at the group level revealed widespread white matter intensity increases in the corticospinal tracts, corpus callosum, sub-central, frontal and occipital white matter tracts and cerebellum. VBI results correlated with disease severity (ALSFRS-R) and patterns of cerebral involvement differed between bulbar- and limb-onset. VBI would be easily translatable to the routine clinical environment, and once optimized for individual analysis offers significant biomarker potential in ALS.


Conflict of interest statement

Competing Interests: The authors have declared that no competing interests exist.

Figures

Figure 1
Figure 1. Processing algorithm.
Flowchart illustrates the processing algorithm used for the analyses. VBM-based spatial preprocessing is combined with disease-independent intensity normalization to allow for maximal standardization and direct comparability of T1-contrasted MRI images.
Figure 2
Figure 2. Group comparison of ALS patients versus healthy controls.
Wholebrain group-mean of VBI images projected on generic brain. Coronal (a), sagittal (b) und axial (c) sections illustrate significantly higher intensity in the CST, corpus callosum and posterior limb of the internal capsule (PLIC). Significant VBI increases were see descending from the motor-cortical level (d) into the cerebral peduncle, rendering areas like the radiate corona (e), PLIC (f) to the midbrain nuclei (g). Inference was done using Threshold Free Cluster Enhancement (10000 permutations) und Family-wise error rate correction for multiple comparisons. Color spectrum gives p-value indication (h).
Figure 3
Figure 3. Group comparison of ALSFRS-R stratified patient subgroups versus healthy controls.
Wholebrain group-mean of VBI images projected on generic brain (a, b) and Maximum Intensity Projection of significantly different regions (d, e). The extent of MRI intensity change in ‘low’ disability group (a, d) is significantly less widespread than in the ‘high’ disability group (b, e). Inference was done using Threshold Free Cluster Enhancement (10000 permutations) und Family-wise error rate correction for multiple comparisons. Color spectrum giving p-value indication (c).
Figure 4
Figure 4. Regression analysis of VBI-processed T1 intensities of all ALS patients and their ALSFRS-R.
Clusters of significant correlation between VBI intensity and ALSFRS-R scores are given in coronal slices (a, level at b). Projection on VBI group mean generic brain, CST highlighted according to JHU DTI atlas (yellow). Mean intensity inside ROIs in the PLIC (f, 5 mm sphere), paraventricular (e, 10 mm sphere) and subcentral white matter (d, 10 mm sphere) reveals overall decrease in intensity (mean VBI intensity versus ALSFRS-R; g, right; h, left). This illustrates a disability-related MRI intensity change in ‘core’ regions of ALS-related white matter disturbances. Inference was done using Threshold Free Cluster Enhancement (10000 permutations). Color spectrum giving p-value indication (c).
Figure 5
Figure 5. Group comparison of bulbar and limb phenotype patient subgroups versus healthy controls.
Wholebrain group-mean of VBI images projected on generic brain (c) and Maximum Intensity Projection (MIP) of significantly different regions (d, e, f). The patterns of MRI intensity change in bulbar (a) and limb (b) subgroups significantly differ despite no significant differences in age, sex or ALSFRS-R score between groups. Coronal (d), sagittal (e) and axial (f) MIPs illustrate apparently more widespread involvement of cerebral white matter in bulbar-onset ALS. Inference was done using Threshold Free Cluster Enhancement (10000 permutations) und Family-wise error rate correction for multiple comparisons. Color spectrum giving p-value indication (g).

References

    1. Renton AE, Majounie E, Waite A, Simon-Sanchez J, Rollinson S, et al. (2011) A hexanucleotide repeat expansion in C9ORF72 is the cause of chromosome 9p21-linked ALS-FTD. Neuron 72(2): 257–268. - PMC - PubMed
    1. DeJesus-Hernandez M, Mackenzie IR, Boeve BF, Boxer AL, Baker M, et al. (2011) Expanded GGGGCC hexanucleotide repeat in noncoding region of C9ORF72 causes chromosome 9p-linked FTD and ALS. Neuron 72(2): 245–256. - PMC - PubMed
    1. Turner MR, Kiernan MC, Leigh PN, Talbot K (2009) Biomarkers in amyotrophic lateral sclerosis. Lancet Neurol 8(1): 94–109. - PubMed
    1. Swash M (2012) Why are upper motor neuron signs difficult to elicit in amyotrophic lateral sclerosis? J Neurol Neurosurg Psychiatry 83(6): 659–662. - PubMed
    1. Kassubek J, Bretschneider V, Sperfeld AD (2005) Corticospinal tract MRI hyperintensity in X-linked Charcot-Marie-Tooth Disease. J Clin Neurosci 12(5): 588–589. - PubMed

Publication types