. 2014 Aug 18;9(8):e105219.
doi: 10.1371/journal.pone.0105219. eCollection 2014.

Activated CD8+ T lymphocytes inhibit neural stem/progenitor cell proliferation: role of interferon-gamma

Affiliations

Activated CD8+ T lymphocytes inhibit neural stem/progenitor cell proliferation: role of interferon-gamma

Shuxian Hu et al. PLoS One. .

Abstract

The ability of neural stem/progenitor cells (NSCs) to self-renew, migrate to damaged sites, and differentiate into neurons has renewed interest in using them in therapies for neurodegenerative disorders. Neurological diseases, including viral infections of the brain, are often accompanied by chronic inflammation, whose impact on NSC function remains unexplored. We have previously shown that chronic neuroinflammation, a hallmark of experimental herpes simplex encephalitis (HSE) in mice, is dominated by brain-infiltrating activated CD8 T-cells. In the present study, activated CD8 lymphocytes were found to suppress NSC proliferation profoundly. Luciferase positive (luc+) NSCs co-cultured with activated, MHC-matched, CD8+ lymphocytes (luc-) showed two- to five-fold lower luminescence than co-cultures with un-stimulated lymphocytes. On the other hand, similarly activated CD4+ lymphocytes did not suppress NSC growth. This differential lymphocyte effect on proliferation was confirmed by decreased BrdU uptake by NSC cultured with activated CD8 T-cells. Interestingly, neutralizing antibodies to interferon-gamma (IFN-γ) reversed the impact of CD8 lymphocytes on NSCs. Antibodies specific to the IFN-γ receptor-1 subunit complex abrogated the inhibitory effects of both CD8 lymphocytes and IFN-γ, indicating that the inhibitory effect of these cells was mediated by IFN-γ in a receptor-specific manner. In addition, activated CD8 lymphocytes decreased levels of nestin and Sox2 expression in NSCs while increasing GFAP expression, suggesting possible induction of an altered differentiation state. Furthermore, NSCs obtained from IFN-γ receptor-1 knock-out embryos were refractory to the inhibitory effects of activated CD8+ T lymphocytes on cell proliferation and Sox2 expression. Taken together, the studies presented here demonstrate a role for activated CD8 T-cells in regulating NSC function mediated through the production of IFN-γ. This cytokine may influence neuro-restorative processes and ultimately contribute to the long-term sequelae commonly seen following herpes encephalitis.


Conflict of interest statement

Competing Interests: The authors have declared that no competing interests exist.

Figures

Figure 1
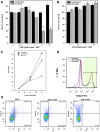
Figure 1. CD8+ lymphocytes inhibit NSC proliferation.
Luc+ NSCs obtained from E14.5 d luciferase transgenic mice were co-cultured with (A) CD8+ or (B) CD4+ lymphocytes isolated from MHC-matched (Luc-) Balb/C mice 24 h after seeding Luc+ NSCs. Lymphocytes in the co-cultures were either left unstimulated (black bars) or were stimulated with a mixture of anti-CD3 and anti-CD28 antibodies (5 µg/ml). After 72 h of stimulation, culture lysates were analyzed for luciferase activity. Data presented are pooled from 2–5 separate experiments with each treatment performed in triplicate (mean ± SEM). (C) Kinetics of NSC growth in vitro measured as a function of NSC luciferase activity. Rate of NSC growth left untreated (open triangle) was compared to rate of growth in co-culture with unstimulated lymphocytes (closed circles) or activated CD8 lymphocytes (open circles). Data presented are pooled from two separate experiments with each treatment performed in triplicates (mean ± SEM). (D) NSC proliferation, measured by their ability to incorporate BrdU, was assessed by flow cytometry. Total live cells were gated for analysis and lymphocytes were excluded by gating out CD45+ cells. A representative histogram of two independent experiments showing BrdU uptake by CD45 NSC co-cultured with activated CD8 lymphocytes (blue) and compared to those co-cultured with unstimulated (red) or untreated (dotted line) cells. (E) Representative dot plots showing Annexin-V binding and propidium iodide uptake by untreated NSCs (NSC), NSCs cultured with antibody-stimulated CD8 T lymphocytes (stim CD8), NSCs treated with hydrogen peroxide for 1 hour (peroxide). ** p<0.001 vs untreated NSC.
Figure 2
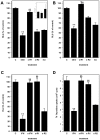
Figure 2. The effect of CD8 lymphocytes on NSC proliferation is mediated through IFN-γ.
Luc+ NSC cultures were treated with cell-free supernatants from activated CD8 lymphocytes 24 h after seeding cultures. (A) Luciferase activity measured from untreated NSCs (C) was compared to cultures treated with conditioned medium from antibody-activated CD8 lymphocyte (stim) or unstimulated CD8 lymphocytes (unstim). Pooled data from two separate experiments are presented. (B) Neutralizing antibodies to IFN-γ (x-IFN; 1 mg/ml) or an isotype control antibody (iso) was added to the activated-lymphocyte conditioned media prior to treatment of NSCs. Relative luminescence from NSC cultures treated with conditioned medium from unstimulated lymphocytes (unstim) or activated CD8 cells (stim) and treated activated-lymphocyte conditioned media are presented as a percent of untreated cultures. Pooled data from 3 independent experiments are presented. (C) NSC-lymphocyte co-cultures constituted with antibody-stimulated CD8 T-cells (stim) were treated with either neutralizing anti-IFN-γ antibody (xIFN), or an isotype antibody (iso). Relative luminescence intensity (RLU) from treated co-cultures and co-cultures with unstimulated CD8 T-cells (unstim) are presented as a percentage of untreated control NSCs. Pooled data from 3 independent experiments are presented (mean ± SEM; ** p<0.001 vs. untreated NSC; §§ p<0.001 vs. stimulated CD8 T-cell-NSC co-culture).
Figure 3
Figure 3. IFN-γ inhibition of NSC proliferation is mediated through the IFN-γ receptor.
NSC cultures were treated with antibodies to IFN-γ alpha receptor (R1) subunit (x-R1) or IFN-γ beta receptor (R2) subunit (x-R2). (A) Relative luminescence units (RLU) from untreated control NSC cultures (C) were compared to cells treated with stimulated CD8 lymphocytes conditioned medium alone (stim), or cells treated with anti-IFN-γR1 (x-R1) or IFN-γ R2 (x-R2) or isotype control antibodies along with lymphocyte conditioned medium. (inset) Relative expression (RU) of IFN-γ R1 by Real-time RT-PCR analysis in NSC for obtained from first (P1), second (P2) and third (P3) passages in culture. Data are presented as average expression from 3 cultures (assayed in triplicate) at each passage (± SEM). (B) Co-cultures of NSCs with activated CD8 lymphocytes were either untreated (stim), or treated with anti-IFN-γR1 (x-R1), IFN-γ R2 (xR2) or isotype control antibodies (iso) to determine the role of lymphocyte-derived IFN-γ on stem cell proliferation. Luminescence intensity values are compared to similar untreated NSC cultures (C) and are presented as a percentage of untreated control cells. Data presented are pooled from 3 separate experiments (mean ± SEM). (C) The specificity of the IFN-γ mediated inhibition of NSC proliferation, mediated through the IFN-γ receptor, was recapitulated using recombinant murine IFN-γ (IFN) in the NSC culture medium. Anti-IFN-γ antibody (x-IFN), anti-IFN-γR1 antibody (x-R1) or anti-IFN-γR2 antibody was used to reverse the IFN-γ effect compared to untreated NSC cultures (C). Luminescence data are presented as a percentage of RLU from similar untreated NSC cultures. (D) Thymidine uptake assay was used to measure the effect of IFN-γ treatment (IFN) on NSC proliferation. IFN-γ effect on thymidine uptake was antagonized by treating with neutralizing antibodies to INF-γ (xIFN), IFN-γR1 (x-R1) but not by antibodies to IFN-γR2 (x-R2). Graphs represent pooled data obtained from 2–5 separate experiments with treatments performed in triplicates (mean ± SEM). ** p<0.001 vs. untreated NSC and §§ p<0.001 vs. stimulated CD8 T-cell or IFN-γ treated NSC.
Figure 4
Figure 4. Activated CD8 lymphocytes initiate NSC differentiation.
Co-cultures of NSC and lymphocytes were assessed for Nestin (a stem cell marker) expression by flowcytometry. NSCs were analyzed on a live cell gate after exclusion of CD45+ lymphocytes. (A) Histogram showing nestin immunoreactivity in untreated NSCs (open), compared to isotype antibody staining (shaded). Nestin expression in NSCs was measured 72 h after co-culture with (B) un-stimulated CD8 lymphocytes and (C) with activated CD8 lymphocytes. The amplitude of nestin expression and proportion of nestin-expressing cells decreased when NSC were co-cultured with activated CD8+ lymphocytes. Representative data from 2 separate experiments are presented. (D) Representative dot plots showing expression of Sox2 and doublecortin (DCX) on untreated NSCs or (E) NSCs cultured with antibody-stimulated CD8 T lymphocytes. (F) Stacked bars demonstrating changes in ratios of NSCs phenotypes, defined by Sox2 and doublecortin (DCX) expression, in untreated (NSC) cultures, NSCs cultured with unstimulated CD8 T-cell (US CD8), and NSCs cultured with antibody-stimulated CD8 T-cells (S CD8). (G) Immunohistochemistry of cultured NSCs showing differentiation into GFAP(+) cells when treated with stimulated CD8 T cell (stim). Untreated (NSC) NSCs and those co-cultured with unstimulated CD8 T cells show no GFAP immunostaining (green fluorescence). Nuclei were counterstained with DAPI (blue).
Figure 5
Figure 5. IFN-γR1 knockout NSCs are resistant to CD8 T-cell mediated inhibition of proliferation.
NSCs were labeled with eFluor670 proliferation dye and were cultured alone (untreated), with 20 pg/mL IFN-γ (IFN) or in the presence of unstimulated (Unstim) or stimulated CD8 T cells (Stim). (A) Representative flow histograms of stimulated CD8 T cell treated and untreated NSCs demonstrating dilution of labeling dye fluorescence corresponding to cell divisions. Gates for generation of progeny was allocated based on progressive halving of the fluorescence measured in dividing NSCs (calculated using a cell proliferation algorithm in the FlowJo software). Proliferation of IFN-γR1 KO NSCs when co-cultured with stimulated CD8 T-cells (black line) compared to untreated NSCs (untreated, gray tinted line), or wild-type NSCs cultured with stimulated CD8 T-cells (dotted line) is shown. (B) Quantification of total number of proliferating Sox2(+) NSCs in shown under each culture condition for wild type and IFN-γR1 KO NSCs. Data are presented as an average of three replicates ± SEM. ** p<0.01. (C) Representative dot plots showing Sox2 immunolabeling vs dilution of proliferation dye fluorescence observed in wild type (upper left) and IFN-GR1 KO NSCs (upper right) co-cultured with stimulated CD8 T-cells. Untreated NSC cultures (lower left) and those co-cultured with unstimulated CD8 T-cells (lower right) show no difference in proliferation or Sox2 expression. Gates are drawn to indicate cells that have undergone five to seven rounds of division (or proliferation dye dilution) post culture and the percentages of proliferating cells are presented as average ± SEM.

Similar articles

Cited by

References

    1. Gage FH (2000) Mammalian neural stem cells. Science 287: 1433–1438. - PubMed
    1. Merkle FT, Mirzadeh Z, Alvarez-Buylla A (2007) Mosaic organization of neural stem cells in the adult brain. Science 317: 381–384. - PubMed
    1. Kempermann G (2011) Adult Neurogenesis 2: Stem Cells and Neuronal Development in the Adult Brain. New York: Oxford University Press. 426 p.
    1. Kempermann G, Jessberger S, Steiner B, Kronenberg G (2004) Milestones of neuronal development in the adult hippocampus. Trends Neurosci 27: 447–452. - PubMed
    1. Ming GL, Song H (2011) Adult neurogenesis in the mammalian brain: significant answers and significant questions. Neuron 70: 687–702. - PMC - PubMed

Publication types

Substances