. 2014 Aug 18;9(8):e105444.
doi: 10.1371/journal.pone.0105444. eCollection 2014.

Phylogenetic analyses and characterization of RNase X25 from Drosophila melanogaster suggest a conserved housekeeping role and additional functions for RNase T2 enzymes in protostomes

Affiliations

Phylogenetic analyses and characterization of RNase X25 from Drosophila melanogaster suggest a conserved housekeeping role and additional functions for RNase T2 enzymes in protostomes

Linda Ambrosio et al. PLoS One. .

Abstract

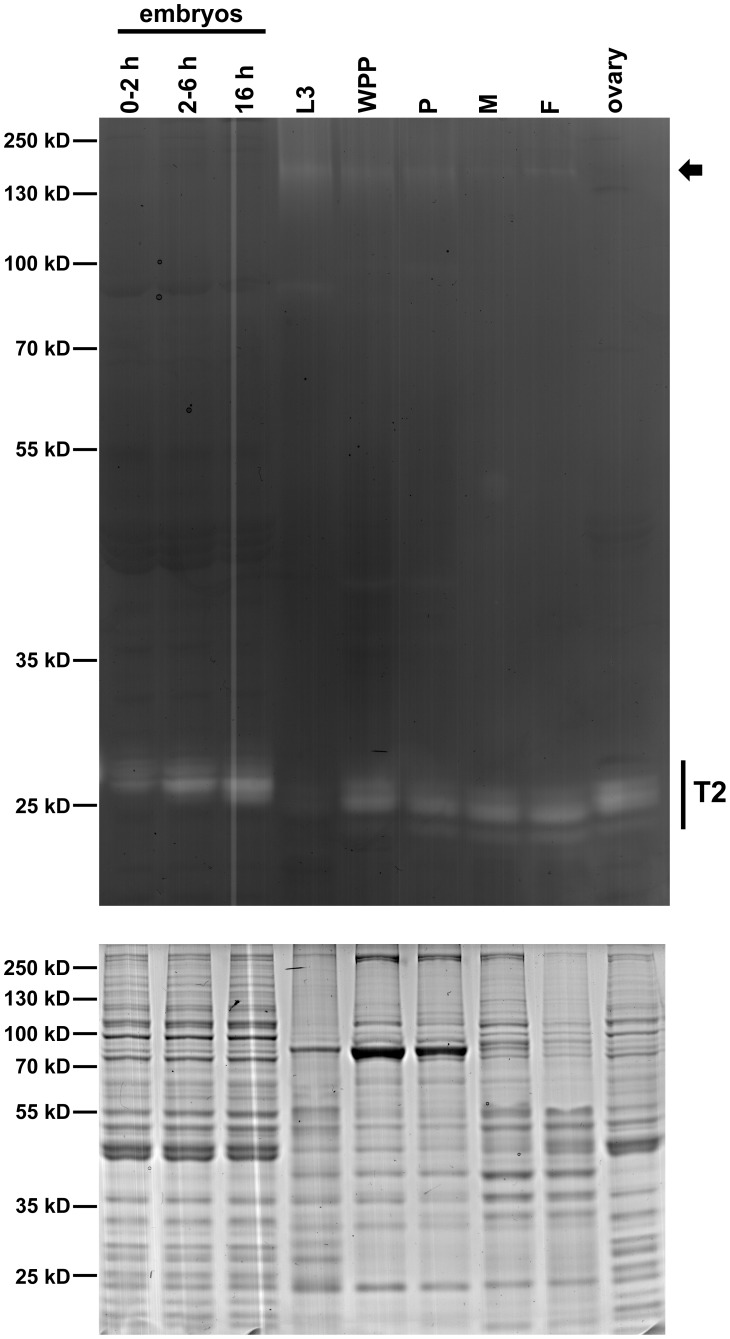
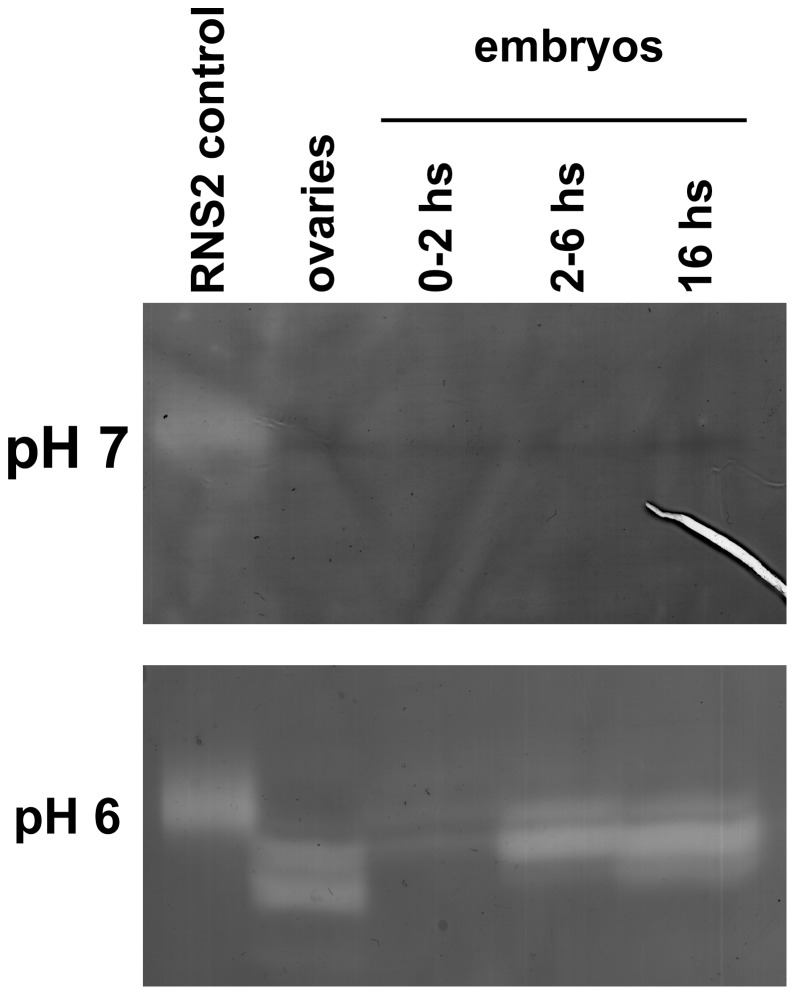
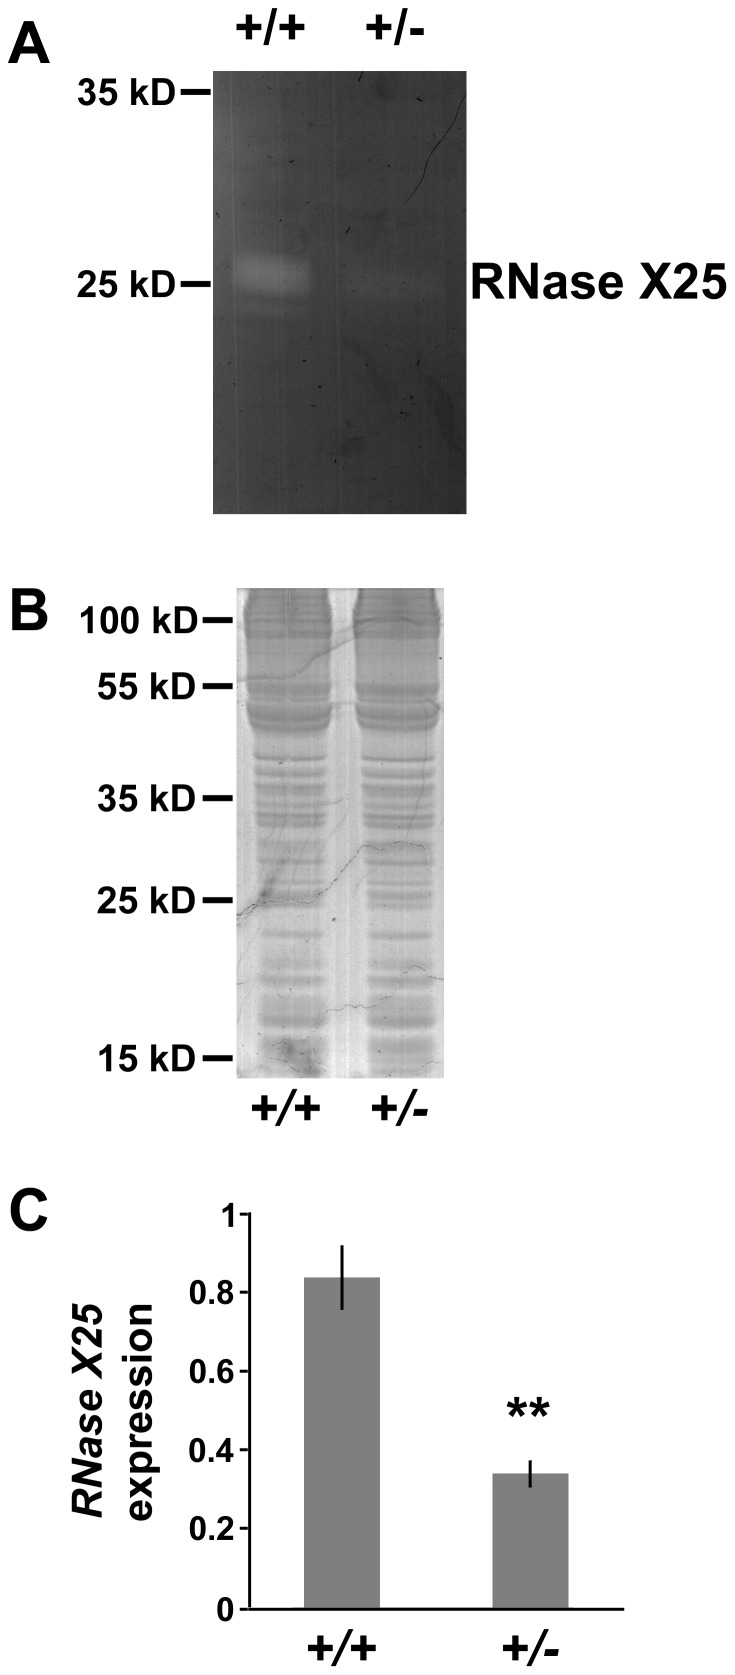
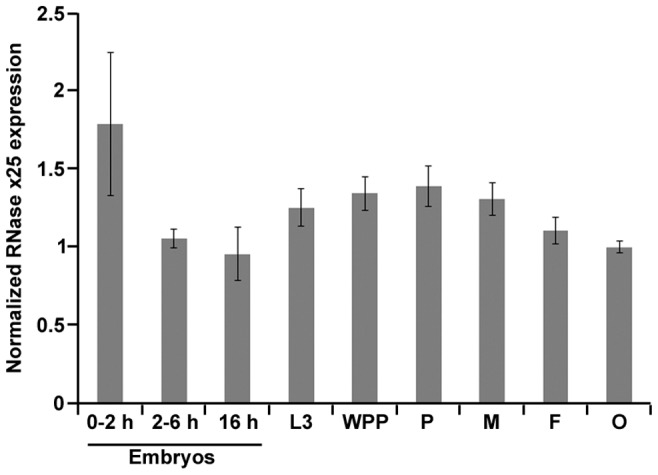
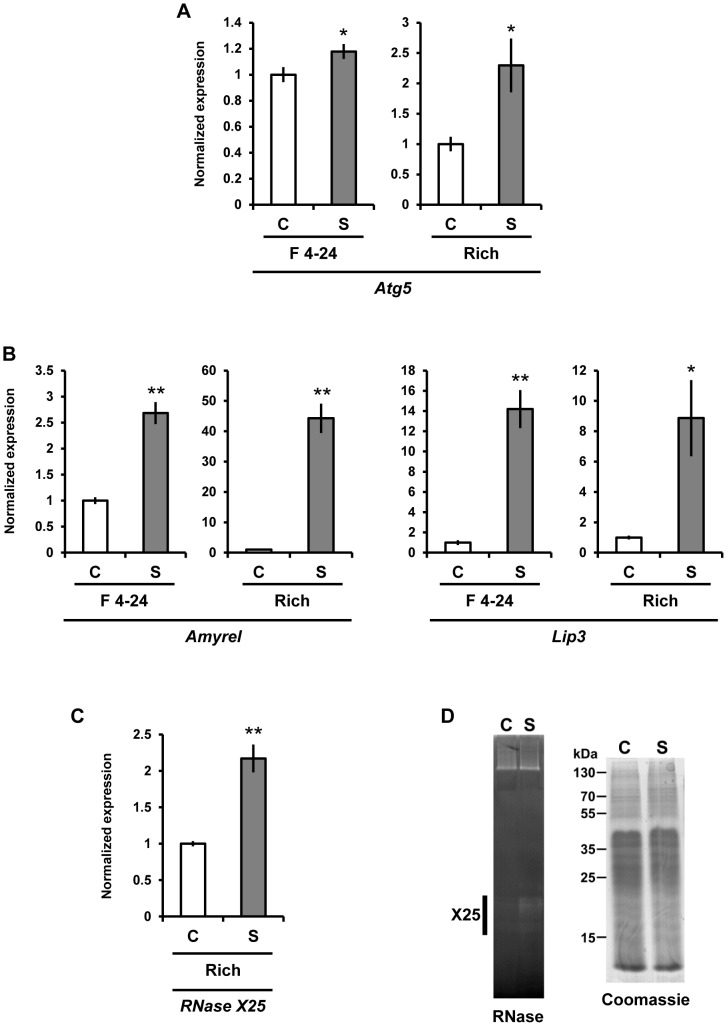
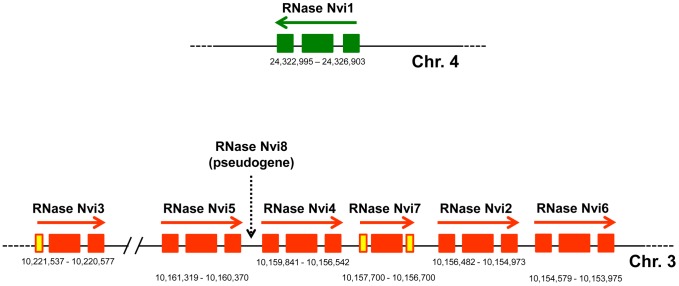
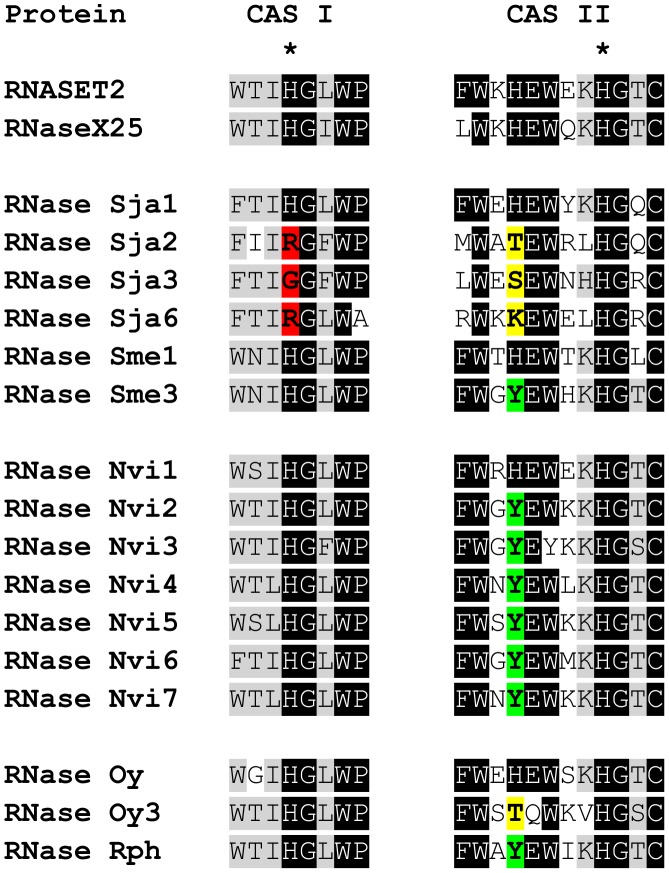
Ribonucleases belonging to the RNase T2 family are enzymes associated with the secretory pathway that are almost absolutely conserved in all eukaryotes. Studies in plants and vertebrates suggest they have an important housekeeping function in rRNA recycling. However, little is known about this family of enzymes in protostomes. We characterized RNase X25, the only RNase T2 enzyme in Drosophila melanogaster. We found that RNase X25 is the major contributor of ribonuclease activity in flies as detected by in gel assays, and has an acidic pH preference. Gene expression analyses showed that the RNase X25 transcript is present in all adult tissues and developmental stages. RNase X25 expression is elevated in response to nutritional stresses; consistent with the hypothesis that this enzyme has a housekeeping role in recycling RNA. A correlation between induction of RNase X25 expression and autophagy was observed. Moreover, induction of gene expression was triggered by oxidative stress suggesting that RNase X25 may have additional roles in stress responses. Phylogenetic analyses of this family in protostomes showed that RNase T2 genes have undergone duplication events followed by divergence in several phyla, including the loss of catalytic residues, and suggest that RNase T2 proteins have acquired novel functions. Among those, it is likely that a role in host immunosuppression evolved independently in several groups, including parasitic Platyhelminthes and parasitoid wasps. The presence of only one RNase T2 gene in the D. melanogaster genome, without any other evident secretory RNase activity detected, makes this organism an ideal system to study the cellular functions of RNase T2 proteins associated with RNA recycling and maintenance of cellular homeostasis. On the other hand, the discovery of gene duplications in several protostome genomes also presents interesting new avenues to study additional biological functions of this ancient family of proteins.


Conflict of interest statement

Competing Interests: The authors have declared that no competing interests exist.

Figures

Figure 1
Figure 1. Developmental profile of Drosophila RNase activities.
Protein extracts were produced from embryos at 0–2 hours (h), 2–6 h, and 0–16 h after egg deposition and from animals at 3rd instar larval (L3), white prepupal (WPP), pupal (P), and adult male (M) or female (F) stages of development. Ovarian tissue (ovary) was prepared from 3–5 day old females. (Upper panel) Protein was fractionated by electrophoresis through a 12% polyacrylamide gel containing 3 mg/ml Torula yeast RNA, washed to remove SDS, incubated in 100 mM Tris-HCl at pH 6.0 and stained with toluidine blue to visualize regions of nuclease activity. Low molecular weight (∼25–30 kD) activities in the size range of the RNase T2 family were detected at all developmental stages assayed. High molecular weight (∼200 kD) activities were also apparent (arrow), but absent from embryos. (Lower panel) Protein extracts were analyzed by SDS/PAGE and stained with Coomassie Blue R-250 to control for equal loading and protein integrity. Each lane in both gels contains 20 µg of protein.
Figure 2
Figure 2. Effect of pH on Drosophila RNase activities.
Protein extracts from ovaries and embryos were analyzed using RNase in gel activity assays as described in Figure 1, with incubations at neutral (pH 7.0; upper panel) and acidic (pH 6.0; lower panel) conditions. RNase activity in the size range corresponding to RNase T2 enzymes was abundant after incubation at pH 6, while almost no activity was observed at neutral pH. Each lane in both gels contains 20 µg of protein. A plant protein that is active at the two pH conditions, Arabidopsis thaliana RNS2 , was used as control.
Figure 3
Figure 3. Reduced RNase activity and expression correlates with reduced RNase X25 gene dose.
Ovarian extracts were prepared from wild type control (+/+), or deletion mutant Df(3L)Excel6279/+ females (+/−), carrying two or one copy of the RNase X25 gene, respectively. Protein samples were analyzed using (A) in gel RNase activity assay, or (B) standard SDS/PAGE analysis. Compared to the control (+/+), RNase activity was reduced in ovaries dissected from females with one copy of the RNase X25 gene (+/−). Each lane in both gels contains 20 µg of protein. (C) RNA was isolated from ovaries and qPCR quantification of the relative level of RNase X25 mRNAs in these samples was carried out using the ribosomal protein L3 (RpL3) transcript as internal standard control for normalization. RNase X25 expression levels were reduced in tissue samples from mutant Df(3L)Excel6279/+ females (+/−), compared to control females (+/+). Data are representative of 3 independent experiments and are means and S.E. of triplicates. **, P<0.01 (t-test).
Figure 4
Figure 4. Developmental profile of RNase X25 transcript accumulation.
RNA was isolated from embryos at 0–2 h, 2–6 h, and 0–16 h after egg deposition and from animals at 3rd instar larval (L3), white prepupal (WPP), pupal (P), and adult male (M) or female (F) stages of development. Ovarian tissue (O) was prepared from 3–5 day old females. qPCR quantification of the relative level of RNase X25 mRNAs in these samples was carried out using the ribosomal protein L3 (RpL3) transcript as internal standard control for normalization. RNase X25 expression was detected at all stages analyzed. Data are representative of 3 independent experiments and are means and S.E. of triplicates.
Figure 5
Figure 5. RNase X25 gene expression is regulated by nutritional and oxidative stress.
RNA was isolated from whole 3rd instar larvae, 14 h after transfer to control or experimental media (see Materials and methods). qPCR quantification of the relative level of RNase X25 mRNAs in these samples was carried out using the ribosomal protein L3 (RpL3) transcript as internal standard control for normalization. Increased levels of RNase X25 transcripts were apparent in samples after (A) starvation and treatments with 1% [w/w] wheat germ agglutinin (WGA), and (B) 0.1% [w/w] or 0.5% [w/w] hydrogen peroxide. Data are representative of 3 independent experiments and are means and S.E. of triplicates. *, P<0.05; **, P<0.01 (t-test).
Figure 6
Figure 6. Starvation induces expression of the autophagy marker, Atg 5 and Amyrel, Lip3 and RNase X25 in larvae.
RNA was isolated from whole 3rd instar larvae, 14 h after transfer to control (C) or starvation (S) conditions (see Materials and methods). qPCR quantification of the relative level of (A) autophagy marker Atg5, (B) starvation markers Amyrel, and Lip3, and (C) RNase X25 mRNAs in these samples was carried out using the ribosomal protein L3 (RpL3) transcript as internal standard control for normalization. Increased levels of Atg5, Amyrel, Lip3, and RNase X25 transcripts were apparent in samples after starvation as compared with fed-control animals. Data are representative of 3 independent experiments and are means and S.E. of triplicates. *, P<0.05; **, P<0.01 (t-test). (D) Protein extracts from 14 h starved (S) and fed-control (C) whole 3rd instar larvae were analyzed using RNase in gel activity assays as described in Figure 1. RNase activity in the size range corresponding to RNase T2 enzymes was evident in starved as compared with fed-control animals. Each lane in both gels contains 80 µg of protein. “F 4–24” denotes extracts from animals nourished with Formula 4–24 instant D. melanogaster diet without yeast; “Rich” denotes extracts from animals fed a yeast rich diet (see Materials and methods).
Figure 7
Figure 7. Effect of starvation on the accumulation of Lysotracker-positive vesicles in larval fat body.
(A and B) A high level of bright red Lysotracker-positive vesicles accumulate in fat body cells isolated from (B) 14 h starved 3rd instar larvae, with few observed for (A) fed-control larvae. (C and D) Hoescht 33342 staining of DNA, and (E and F) merged images. Scale bar = 20 µm.
Figure 8
Figure 8. Genomic organization of the RNase T2 genes found in the Nasonia vitripennis genome.
Genes belonging to the RNase T2 family were identified by homology searches of the wasp genome. Boxes represent exons. The gene more closely related to other insect RNase T2 genes is shown in green. Genes with more divergence are shown in orange. Yellow boxes indicate exons with uncertain boundaries. Numbers below each gene are the coordinates of each gene based on the Nasonia vitripennis genome assembly Nvit_2.0. The location of the pseudogene is indicated but the gene is not depicted.
Figure 9
Figure 9. Phylogenetic tree of protostome RNase T2 proteins.
Tree was obtained by the Neighbor-Joining method using only conserved regions. Bootstrap percentages (for 1,000 replications) greater than 50 are shown on interior branches. The tree was rooted using bacteria sequences. Groups discussed in the text are labeled on the right.
Figure 10
Figure 10. Identification of mutations in conserved active site residues in protostome RNase T2 proteins.
The alignment shows the conserved CAS I and CAS II regions characteristic of RNase T2 enzymes. The catalytic histidines are marked with asterisks. Mutations in the catalytic histidine in CAS I should result in complete loss of activity (shown in red). Mutations in the additional histidine in CAS II, implicated in binding to the substrate or stabilization of the pentacovalent intermediate , should result in enzymes with reduced activity (shown in green or yellow). The active sites of human RNASET2 and RNase X25, two active RNases, are shown for comparison.

References

    1. Irie M (1999) Structure-function relationships of acid ribonucleases: lysosomal, vacuolar, and periplasmic enzymes. Pharmacol Ther 81: 77–89. - PubMed
    1. MacIntosh GC (2011) RNase T2 Family: Enzymatic Properties, Functional Diversity, and Evolution of Ancient Ribonucleases. In: Nicholson AWW, editor. Ribonucleases: Springer Berlin Heidelberg. pp. 89–114.
    1. Deshpande RA, Shankar V (2002) Ribonucleases from T2 family. Crit Rev Microbiol 28: 79–122. - PubMed
    1. Tanaka N, Arai J, Inokuchi N, Koyama T, Ohgi K, et al. (2000) Crystal structure of a plant ribonuclease, RNase LE. J Mol Biol 298: 859–873. - PubMed
    1. Luhtala N, Parker R (2010) T2 Family ribonucleases: ancient enzymes with diverse roles. Trends Biochem Sci 35: 253–259. - PMC - PubMed

Publication types

MeSH terms

LinkOut - more resources