Metabolic engineering of Saccharomyces cerevisiae for caffeine and theobromine production
- PMID: 25133732
- PMCID: PMC4136831
- DOI: 10.1371/journal.pone.0105368
Metabolic engineering of Saccharomyces cerevisiae for caffeine and theobromine production
Abstract
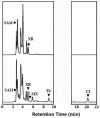
Caffeine (1, 3, 7-trimethylxanthine) and theobromine (3, 7-dimethylxanthine) are the major purine alkaloids in plants, e.g., tea (Camellia sinensis) and coffee (Coffea arabica). Caffeine is a major component of coffee and is used widely in food and beverage industries. Most of the enzymes involved in the caffeine biosynthetic pathway have been reported previously. Here, we demonstrated the biosynthesis of caffeine (0.38 mg/L) by co-expression of Coffea arabica xanthosine methyltransferase (CaXMT) and Camellia sinensis caffeine synthase (TCS) in Saccharomyces cerevisiae. Furthermore, we endeavored to develop this production platform for making other purine-based alkaloids. To increase the catalytic activity of TCS in an effort to increase theobromine production, we identified four amino acid residues based on structural analyses of 3D-model of TCS. Two TCS1 mutants (Val317Met and Phe217Trp) slightly increased in theobromine accumulation and simultaneously decreased in caffeine production. The application and further optimization of this biosynthetic platform are discussed.
Conflict of interest statement
Figures






Similar articles
-
Caffeine synthase and related methyltransferases in plants.Front Biosci. 2004 May 1;9:1833-42. doi: 10.2741/1364. Front Biosci. 2004. PMID: 14977590 Review.
-
The structure of two N-methyltransferases from the caffeine biosynthetic pathway.Plant Physiol. 2007 Jun;144(2):879-89. doi: 10.1104/pp.106.094854. Epub 2007 Apr 13. Plant Physiol. 2007. PMID: 17434991 Free PMC article.
-
Application of RNAi to confirm theobromine as the major intermediate for caffeine biosynthesis in coffee plants with potential for construction of decaffeinated varieties.Plant Mol Biol. 2004 Apr;54(6):931-41. doi: 10.1007/s11103-004-0393-x. Plant Mol Biol. 2004. PMID: 15604660
-
Expression for caffeine biosynthesis and related enzymes in Camellia sinensis.Z Naturforsch C J Biosci. 2010 Mar-Apr;65(3-4):245-56. doi: 10.1515/znc-2010-3-413. Z Naturforsch C J Biosci. 2010. PMID: 20469645
-
Biosynthesis of caffeine underlying the diversity of motif B' methyltransferase.Nat Prod Commun. 2015 May;10(5):799-801. Nat Prod Commun. 2015. PMID: 26058161 Review.
Cited by
-
Cloning and coexpression of recombinant N-demethylase B and Glycolate oxidase genes in Escherichia coli.Mol Biol Rep. 2019 Feb;46(1):505-510. doi: 10.1007/s11033-018-4504-1. Epub 2018 Nov 29. Mol Biol Rep. 2019. PMID: 30498881
-
Metabolic engineering in woody plants: challenges, advances, and opportunities.aBIOTECH. 2021 Jun 23;2(3):299-313. doi: 10.1007/s42994-021-00054-1. eCollection 2021 Sep. aBIOTECH. 2021. PMID: 36303882 Free PMC article. Review.
-
Achieving Metabolic Flux Analysis for S. cerevisiae at a Genome-Scale: Challenges, Requirements, and Considerations.Metabolites. 2015 Sep 18;5(3):521-35. doi: 10.3390/metabo5030521. Metabolites. 2015. PMID: 26393660 Free PMC article. Review.
-
Production of Plant Secondary Metabolites: Examples, Tips and Suggestions for Biotechnologists.Genes (Basel). 2018 Jun 20;9(6):309. doi: 10.3390/genes9060309. Genes (Basel). 2018. PMID: 29925808 Free PMC article. Review.
-
Differential transcriptome analysis of leaves of tea plant (Camellia sinensis) provides comprehensive insights into the defense responses to Ectropis oblique attack using RNA-Seq.Funct Integr Genomics. 2016 Jul;16(4):383-98. doi: 10.1007/s10142-016-0491-2. Epub 2016 Apr 20. Funct Integr Genomics. 2016. PMID: 27098524
References
-
- Verpoorte R, van der Heijden R, Memelink J (1998) Plant Biotechnology and the Production of Alkaloids: Prospects of Metabolic Engineering. In: Geoffrey AC, editor. The Alkaloids: Chemistry and Biology. Academic Press Inc. pp. 453–508.
-
- Facchini PJ (2001) Alkaloid biosynthesis in plants: Biochemistry, Cell Biology, Molecular Regulation, and Metabolic Engineering Applications. Annu. Rev. of Plant Physiol. and Plant Mol. Biol. 52: 29–66. - PubMed
-
- Hughes EH, Shanks JV (2002) Metabolic Engineering of Plants for Alkaloid Production. Metab. Eng. 4: 41–48. - PubMed
-
- Verpoorte R, Memelink J (2002) Engineering secondary metabolite production in plants. Curr. Opin. Biotech. 13: 181–187. - PubMed
Publication types
MeSH terms
Substances
LinkOut - more resources
Full Text Sources
Other Literature Sources
Medical

