Activity Patterns of Preschool-Aged Children at Risk for Obesity
- PMID: 25133750
- PMCID: PMC4329288
- DOI: 10.1123/jpah.2013-0503
Activity Patterns of Preschool-Aged Children at Risk for Obesity
Abstract
Background: Although the prevalence of obesity in young children highlights the importance of early interventions to promote physical activity (PA), there are limited data on activity patterns in this age group. The purpose of this study was to describe activity patterns in preschool-aged children and explore differences by weight status.
Methods: Analyses use baseline data from Healthy Homes/Healthy Kids-Preschool, a pilot obesity prevention trial of preschool-aged children who are overweight or at risk for being overweight. A modified parent-reported version of the previous-day PA recall was used to summarize types of activity. Accelerometry was used to summarize daily and hourly activity patterns.
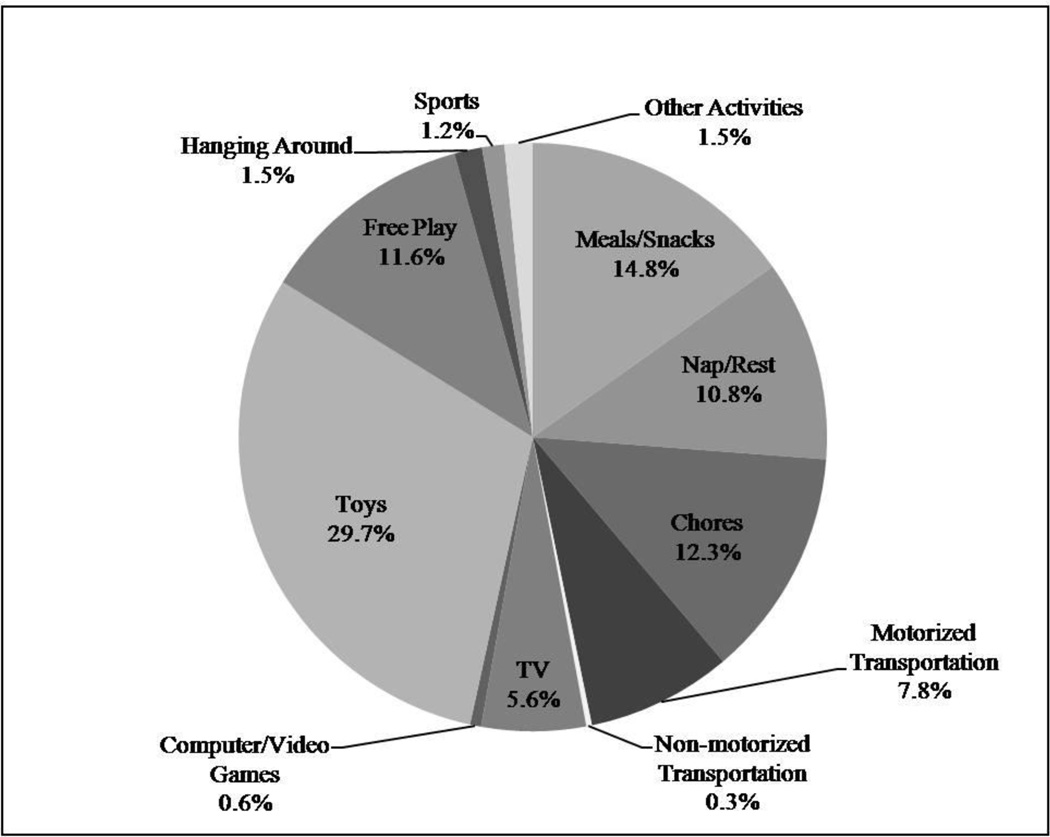
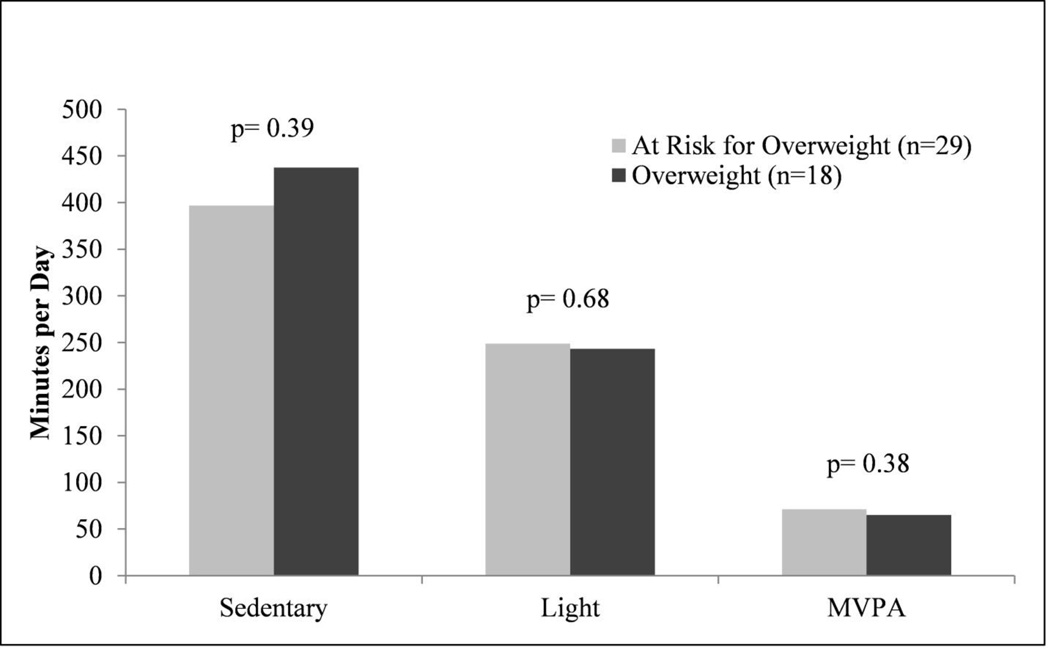
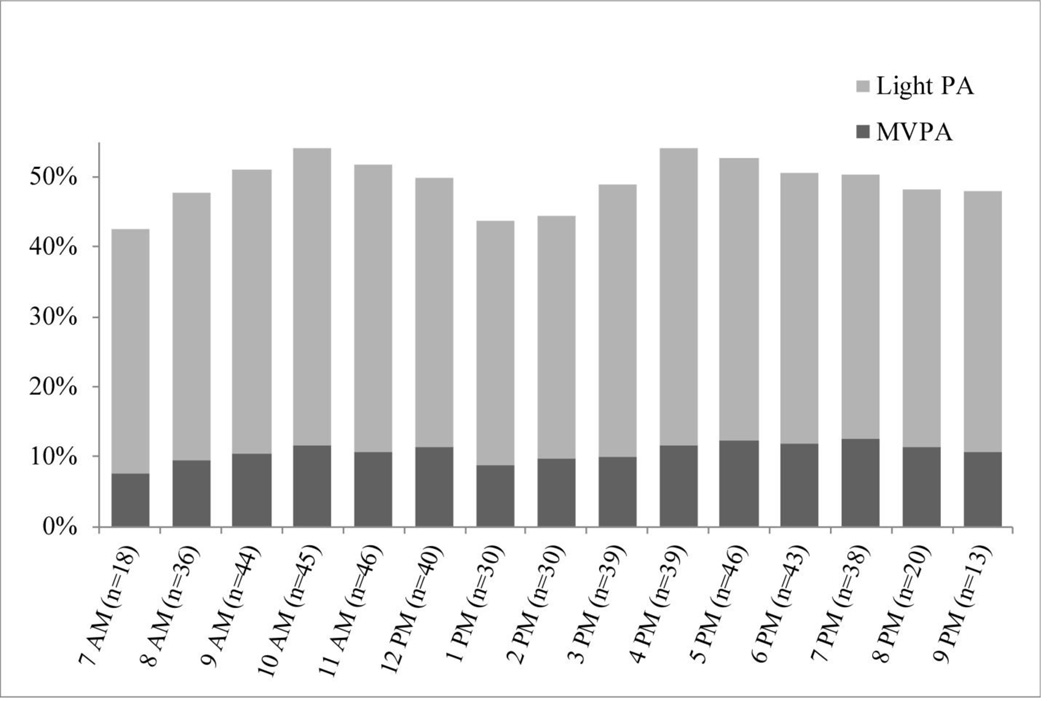
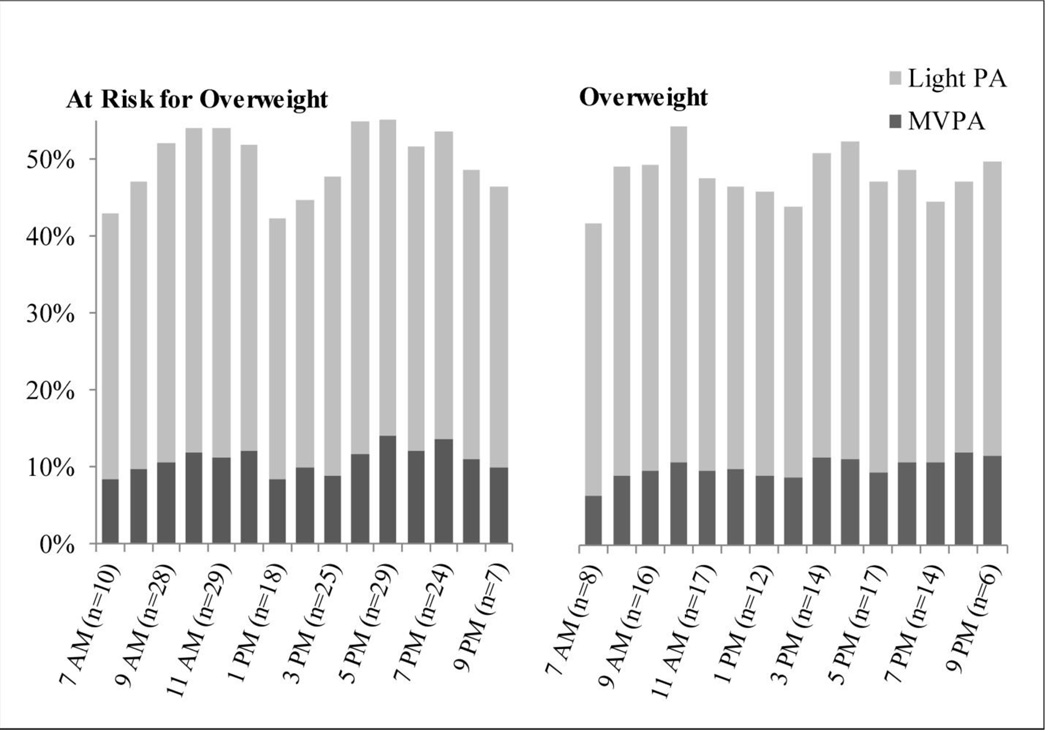
Results: "Playing with toys" accounted for the largest proportion of a child's previous day, followed by "meals and snacks" and "chores." Accelerometry-measured daily time spent in sedentary behavior, light PA, and moderate-to-vigorous PA (MVPA) was 412, 247, and 69 minutes, respectively. Percentage of hourly time spent in MVPA ranged from 3% to 13%, peaking in the late morning and evening hours. There were no statistically significant MVPA differences by weight status.
Conclusions: This study extends our understanding of activity types, amounts, and patterns in preschool-aged children and warrants further exploration of differences in PA patterns by weight status.
Figures
Similar articles
-
Novel patterns of physical activity in a large sample of preschool-aged children.BMC Public Health. 2018 Feb 13;18(1):242. doi: 10.1186/s12889-018-5135-0. BMC Public Health. 2018. PMID: 29439704 Free PMC article. Clinical Trial.
-
Physical activity around the clock: objectively measured activity patterns in young children of the GECKO Drenthe cohort.BMC Public Health. 2019 Dec 5;19(1):1647. doi: 10.1186/s12889-019-7926-3. BMC Public Health. 2019. PMID: 31805914 Free PMC article.
-
Recommended levels of physical activity to avoid adiposity in Spanish children.Pediatr Obes. 2013 Feb;8(1):62-9. doi: 10.1111/j.2047-6310.2012.00086.x. Epub 2012 Sep 7. Pediatr Obes. 2013. PMID: 22961693
-
Vigorous physical activity rather than sedentary behaviour predicts overweight and obesity in pubertal boys: a 2-year follow-up study.Scand J Public Health. 2015 May;43(3):276-82. doi: 10.1177/1403494815569867. Epub 2015 Mar 4. Scand J Public Health. 2015. PMID: 25740617
-
Physical activity and sedentary time during childcare outdoor play sessions: A systematic review and meta-analysis.Prev Med. 2018 Mar;108:74-85. doi: 10.1016/j.ypmed.2017.12.022. Epub 2018 Jan 3. Prev Med. 2018. PMID: 29305869
Cited by
-
Physical activity in early childhood: a five-year longitudinal analysis of patterns and correlates.Int J Behav Nutr Phys Act. 2022 Apr 20;19(1):47. doi: 10.1186/s12966-022-01289-x. Int J Behav Nutr Phys Act. 2022. PMID: 35443696 Free PMC article. Clinical Trial.
-
Physical Activity Levels in Chinese One-Year-Old Children and Their Parents, an Early STOPP China Study.PLoS One. 2016 Apr 14;11(4):e0153605. doi: 10.1371/journal.pone.0153605. eCollection 2016. PLoS One. 2016. PMID: 27078684 Free PMC article.
-
Measurement of screen time among young children aged 0-6 years: A systematic review.Obes Rev. 2021 Aug;22(8):e13260. doi: 10.1111/obr.13260. Epub 2021 May 7. Obes Rev. 2021. PMID: 33960616 Free PMC article.
-
Novel patterns of physical activity in a large sample of preschool-aged children.BMC Public Health. 2018 Feb 13;18(1):242. doi: 10.1186/s12889-018-5135-0. BMC Public Health. 2018. PMID: 29439704 Free PMC article. Clinical Trial.
-
Parent's Physical Activity Associated With Preschooler Activity in Underserved Populations.Am J Prev Med. 2017 Apr;52(4):424-432. doi: 10.1016/j.amepre.2016.11.017. Epub 2017 Jan 9. Am J Prev Med. 2017. PMID: 28081998 Free PMC article.
References
-
- Bauman AE. Updating the evidence that physical activity is good for health: an epidemiological review 2000–2003. Journal of Science and Medicine in Sport. 2004;7(1):6–19. - PubMed
-
- Timmons BW, Leblanc AG, Carson V, et al. Systematic review of physical activity and health in the early years (aged 0–4 years) Applied physiology, nutrition, and metabolism = Physiologie appliquee, nutrition et metabolisme. 2012 Aug;37(4):773–792. - PubMed
Publication types
MeSH terms
Grants and funding
LinkOut - more resources
Full Text Sources
Other Literature Sources
Medical