

Nuclear cytoplasmic trafficking of proteins is a major response of human fibroblasts to oxidative stress
- PMID: 25133973
- PMCID: PMC4259009
- DOI: 10.1021/pr500638h
Nuclear cytoplasmic trafficking of proteins is a major response of human fibroblasts to oxidative stress
Abstract
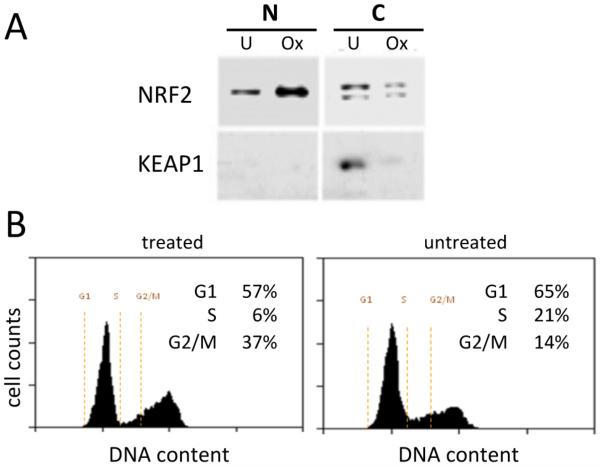
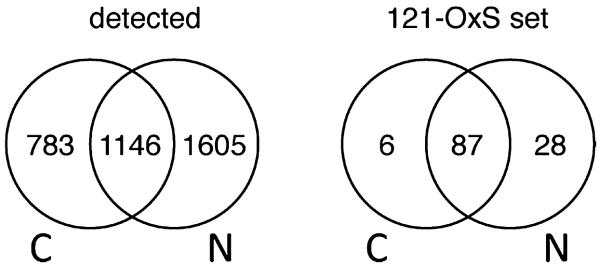
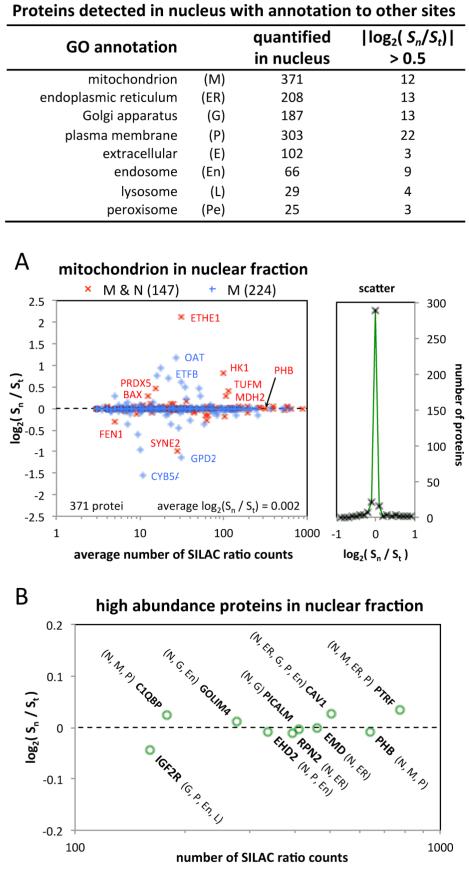
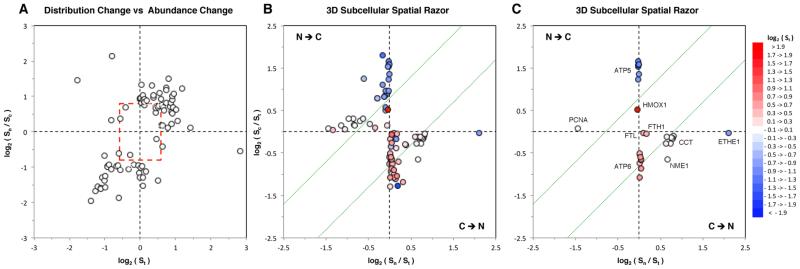
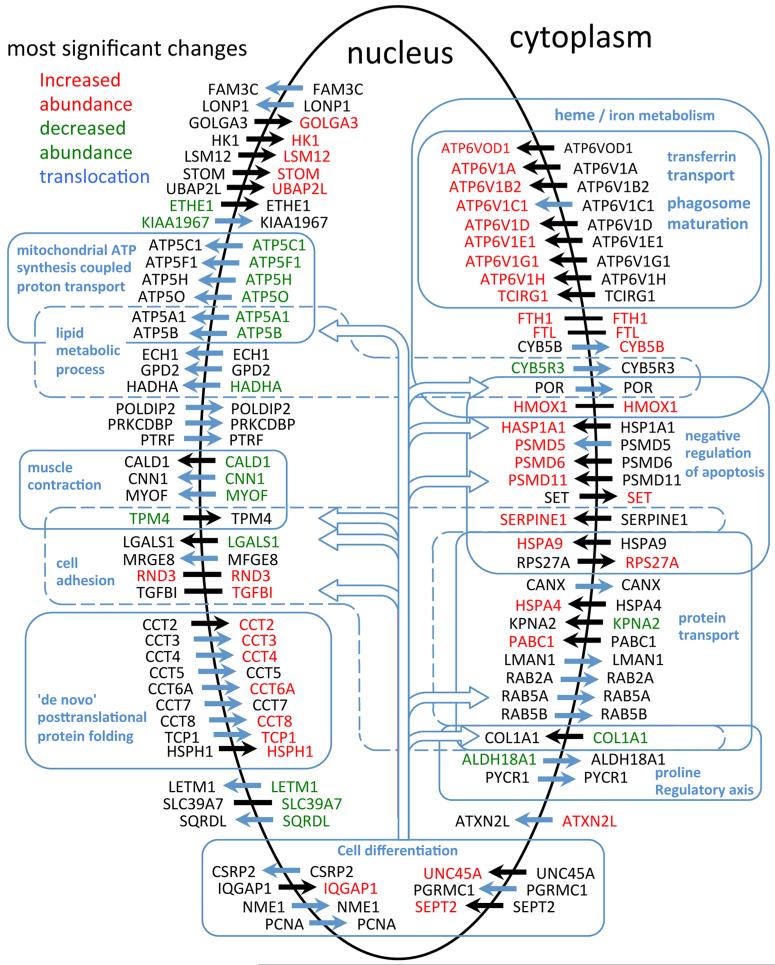
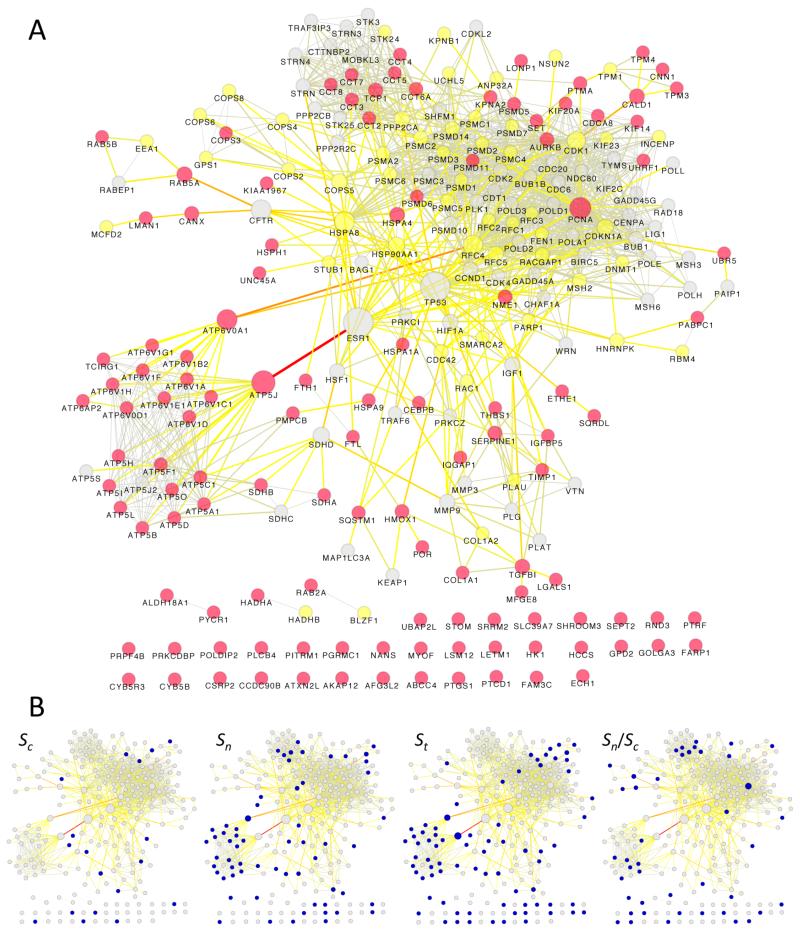
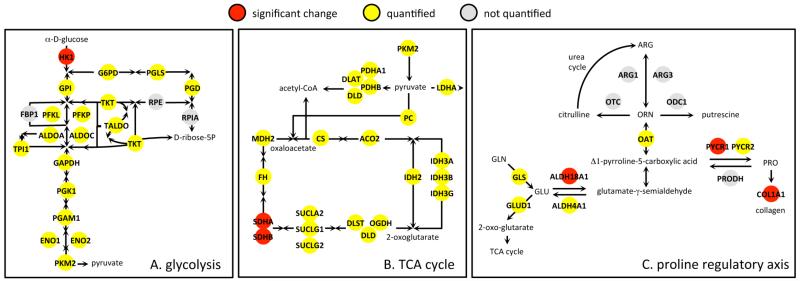
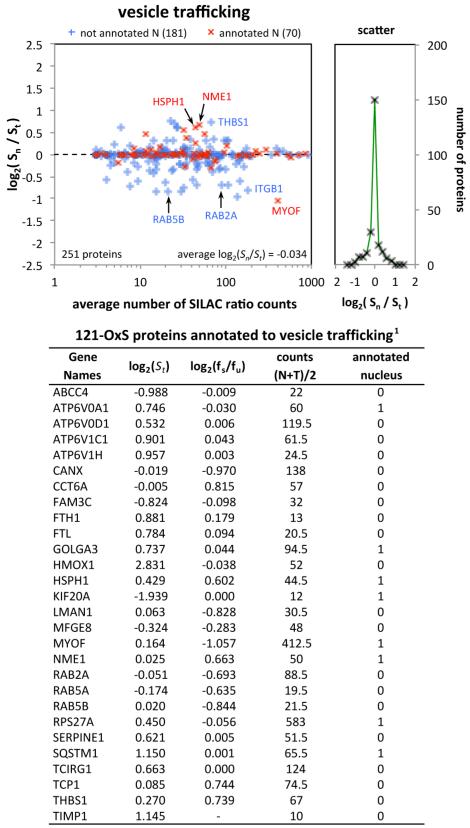
We have used a subcellular spatial razor approach based on LC-MS/MS-based proteomics with SILAC isotope labeling to determine changes in protein abundances in the nuclear and cytoplasmic compartments of human IMR90 fibroblasts subjected to mild oxidative stress. We show that response to mild tert-butyl hydrogen peroxide treatment includes redistribution between the nucleus and cytoplasm of numerous proteins not previously associated with oxidative stress. The 121 proteins with the most significant changes encompass proteins with known functions in a wide variety of subcellular locations and of cellular functional processes (transcription, signal transduction, autophagy, iron metabolism, TCA cycle, ATP synthesis) and are consistent with functional networks that are spatially dispersed across the cell. Both nuclear respiratory factor 2 and the proline regulatory axis appear to contribute to the cellular metabolic response. Proteins involved in iron metabolism or with iron/heme as a cofactor as well as mitochondrial proteins are prominent in the response. Evidence suggesting that nuclear import/export and vesicle-mediated protein transport contribute to the cellular response was obtained. We suggest that measurements of global changes in total cellular protein abundances need to be complemented with measurements of the dynamic subcellular spatial redistribution of proteins to obtain comprehensive pictures of cellular function.
Keywords: DNA replication; SILAC; mass spectrometry; oxidative stress; peroxide; quantitative proteomics.
Figures
Similar articles
-
Spatial Cross-Talk between Oxidative Stress and DNA Replication in Human Fibroblasts.J Proteome Res. 2016 Jun 3;15(6):1907-38. doi: 10.1021/acs.jproteome.6b00101. Epub 2016 May 24. J Proteome Res. 2016. PMID: 27142241
-
Subcellular proteomics reveals a role for nucleo-cytoplasmic trafficking at the DNA replication origin activation checkpoint.J Proteome Res. 2013 Mar 1;12(3):1436-53. doi: 10.1021/pr3010919. Epub 2013 Feb 6. J Proteome Res. 2013. PMID: 23320540 Free PMC article.
-
Spatial perspectives in the redox code-Mass spectrometric proteomics studies of moonlighting proteins.Mass Spectrom Rev. 2018 Jan;37(1):81-100. doi: 10.1002/mas.21508. Epub 2016 May 17. Mass Spectrom Rev. 2018. PMID: 27186965 Review.
-
Quantitative proteomics using stable isotope labeling with amino acids in cell culture reveals changes in the cytoplasmic, nuclear, and nucleolar proteomes in Vero cells infected with the coronavirus infectious bronchitis virus.Mol Cell Proteomics. 2010 Sep;9(9):1920-36. doi: 10.1074/mcp.M900345-MCP200. Epub 2010 May 13. Mol Cell Proteomics. 2010. PMID: 20467043 Free PMC article.
-
tRNA dynamics between the nucleus, cytoplasm and mitochondrial surface: Location, location, location.Biochim Biophys Acta Gene Regul Mech. 2018 Apr;1861(4):373-386. doi: 10.1016/j.bbagrm.2017.11.007. Epub 2017 Nov 28. Biochim Biophys Acta Gene Regul Mech. 2018. PMID: 29191733 Free PMC article. Review.
Cited by
-
Multidimensional proteomics for cell biology.Nat Rev Mol Cell Biol. 2015 May;16(5):269-80. doi: 10.1038/nrm3970. Epub 2015 Apr 10. Nat Rev Mol Cell Biol. 2015. PMID: 25857810 Review.
-
Moonlighting Proteins and Cardiopathy in the Spatial Response of MCF-7 Breast Cancer Cells to Tamoxifen.Proteomics Clin Appl. 2019 Sep;13(5):e1900029. doi: 10.1002/prca.201900029. Epub 2019 Jul 25. Proteomics Clin Appl. 2019. PMID: 31282103 Free PMC article.
-
Spatial and temporal dynamics of the cardiac mitochondrial proteome.Expert Rev Proteomics. 2015 Apr;12(2):133-46. doi: 10.1586/14789450.2015.1024227. Epub 2015 Mar 9. Expert Rev Proteomics. 2015. PMID: 25752359 Free PMC article. Review.
-
Location is everything: protein translocations as a viral infection strategy.Curr Opin Chem Biol. 2019 Feb;48:34-43. doi: 10.1016/j.cbpa.2018.09.021. Epub 2018 Oct 16. Curr Opin Chem Biol. 2019. PMID: 30339987 Free PMC article. Review.
References
-
- Brownlee M. Biochemistry and molecular cell biology of diabetic complications. Nature. 2001;414:813–820. - PubMed
-
- Finkel T, Serrano M, Blasco MA. The common biology of cancer and ageing. Nature. 2007;448:767–774. - PubMed
-
- Lin MT, Beal MF. Mitochondrial dysfunction and oxidative stress in neurodegenerative diseases. Nature. 2006;443:787–795. - PubMed
-
- Nathan C. Points of control in inflammation. Nature. 2002;420:846–852. - PubMed
Publication types
MeSH terms
Grants and funding
LinkOut - more resources
Full Text Sources
Other Literature Sources
