. 2014 Sep;184(9):2493-504.
doi: 10.1016/j.ajpath.2014.06.003.

Evidence that meningeal mast cells can worsen stroke pathology in mice

Affiliations

Evidence that meningeal mast cells can worsen stroke pathology in mice

Ahmet Arac et al. Am J Pathol. 2014 Sep.

Abstract

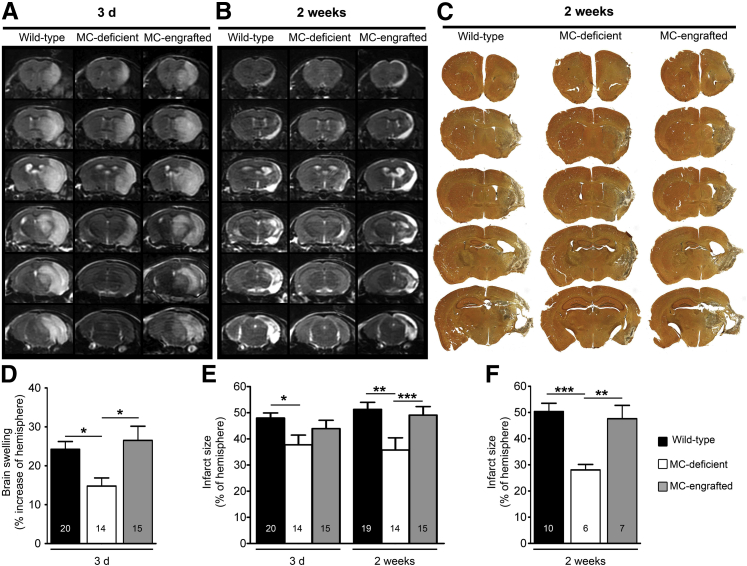
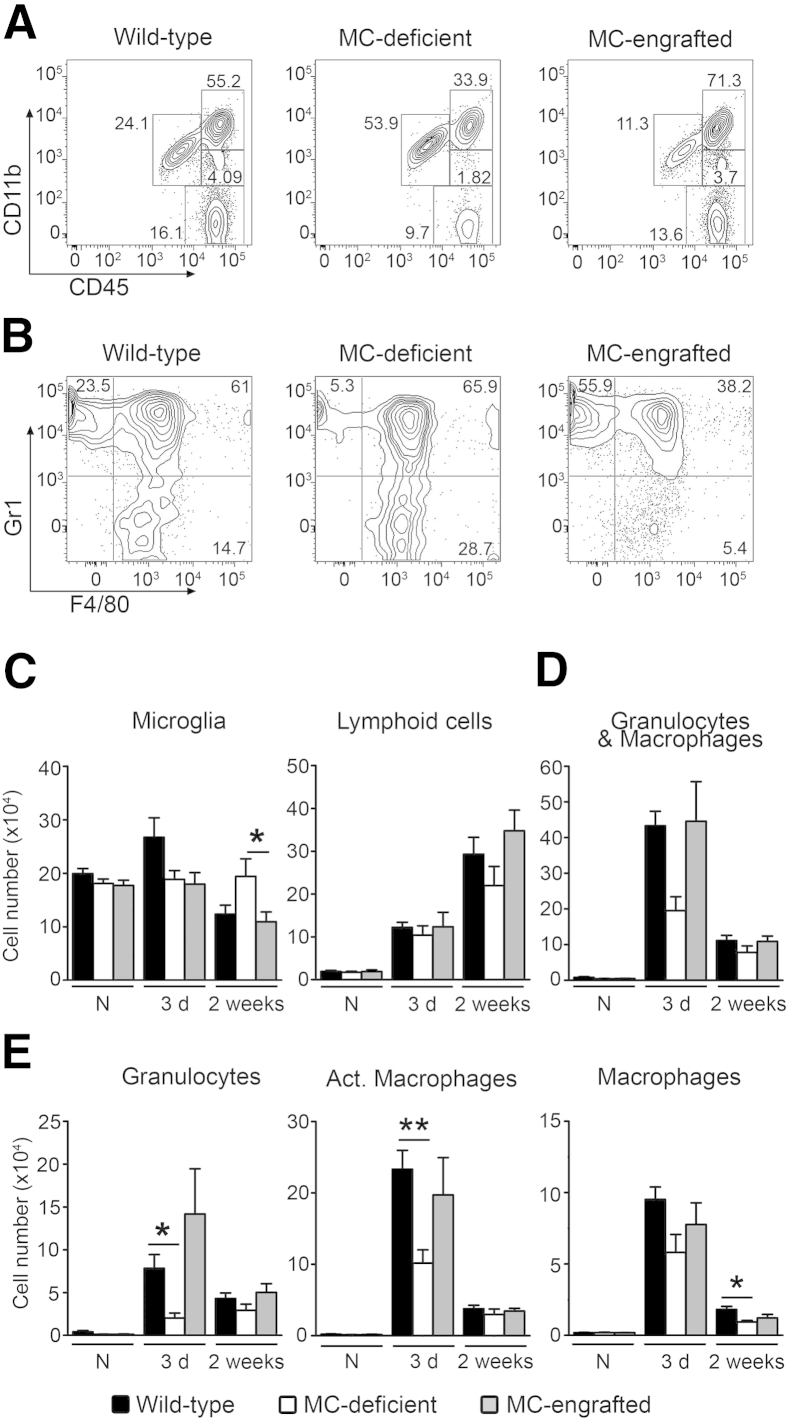
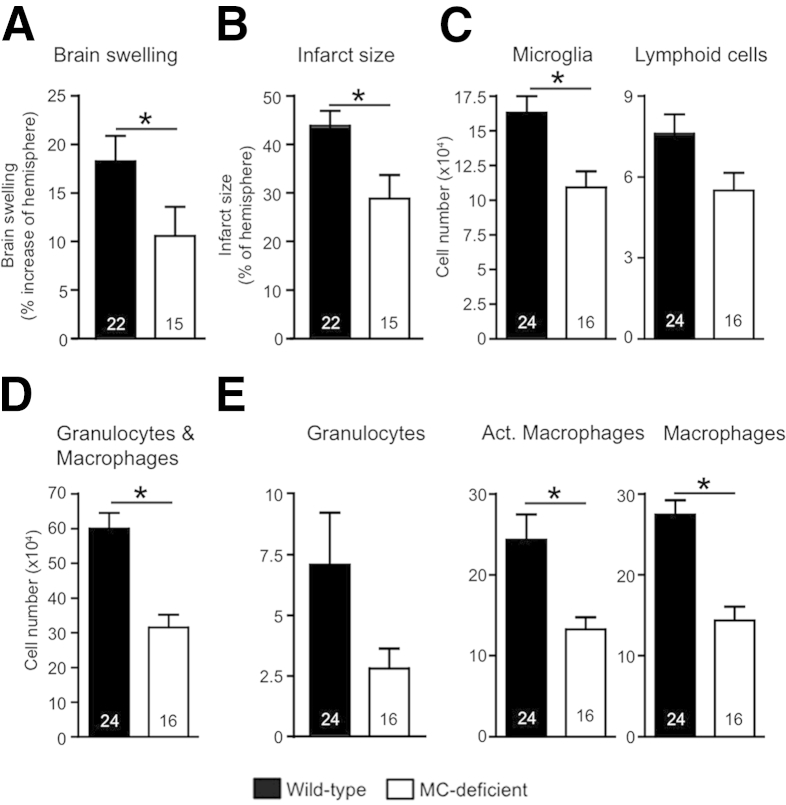
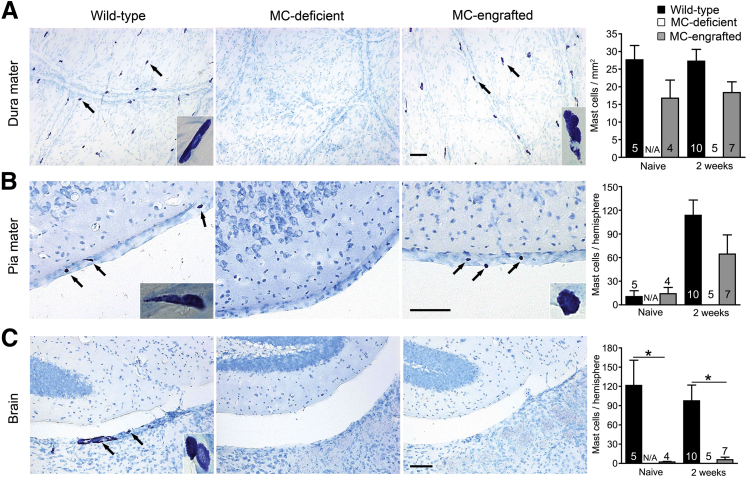
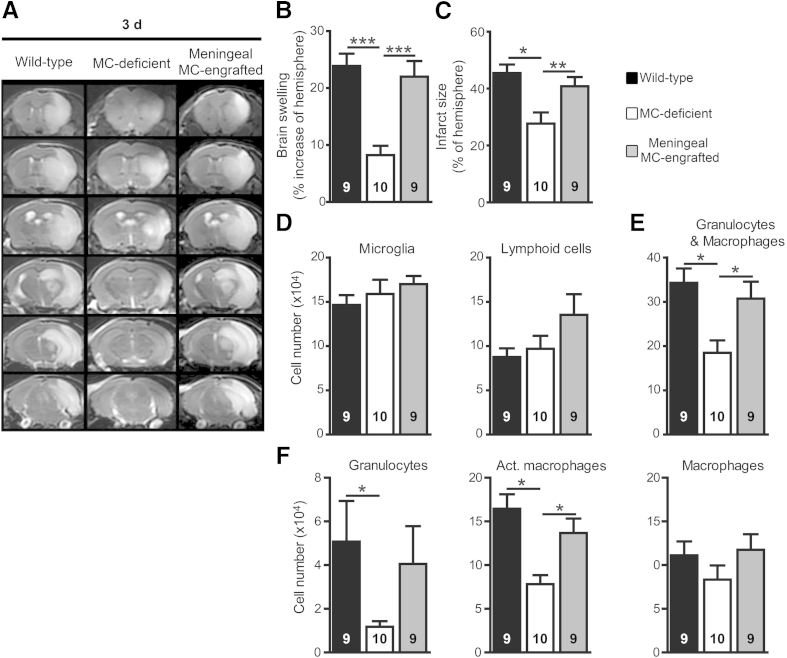
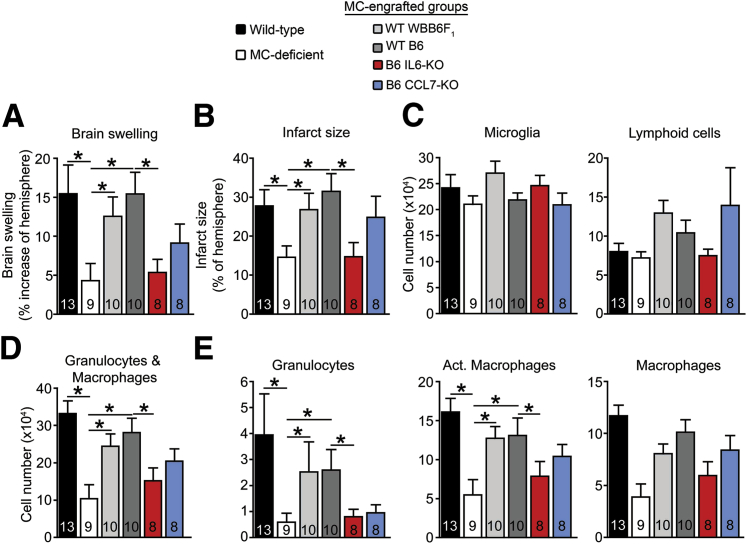
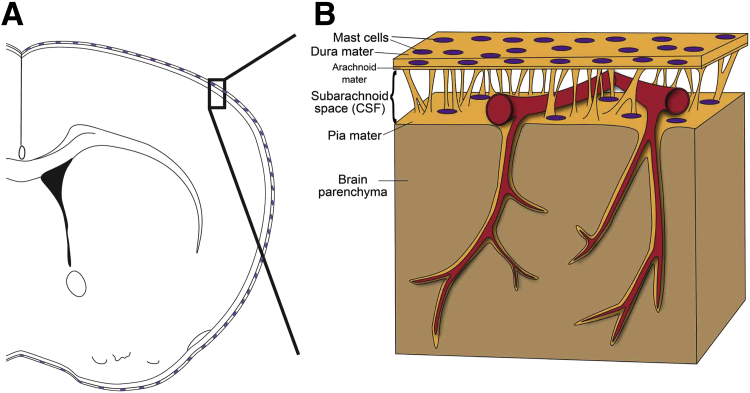
Stroke is the leading cause of adult disability and the fourth most common cause of death in the United States. Inflammation is thought to play an important role in stroke pathology, but the factors that promote inflammation in this setting remain to be fully defined. An understudied but important factor is the role of meningeal-located immune cells in modulating brain pathology. Although different immune cells traffic through meningeal vessels en route to the brain, mature mast cells do not circulate but are resident in the meninges. With the use of genetic and cell transfer approaches in mice, we identified evidence that meningeal mast cells can importantly contribute to the key features of stroke pathology, including infiltration of granulocytes and activated macrophages, brain swelling, and infarct size. We also obtained evidence that two mast cell-derived products, interleukin-6 and, to a lesser extent, chemokine (C-C motif) ligand 7, can contribute to stroke pathology. These findings indicate a novel role for mast cells in the meninges, the membranes that envelop the brain, as potential gatekeepers for modulating brain inflammation and pathology after stroke.


Figures

Figure 1
Figure 1
MCs can contribute to infarct size and brain swelling after stroke. Representative T2W-MRI of brains of WT (WBB6F1-Kit+/+) mice, MC-deficient (WBB6F1-KitW/W-v) mice, and MC-engrafted (WBB6F1-Kit+/+ BMCMCs→WBB6F1-KitW/W-v) mice at 3 days (A) or 2 weeks (B) after stroke. C: Representative silver-stained serial coronal sections of brains of WT, MC-deficient, and MC-engrafted mice at 2 weeks after stroke. Quantification from T2W-MRI scans of brain swelling at 3 days (D) and infarct size at 3 days and 2 weeks (E) after stroke. F: Quantification of infarct size from brain sections obtained 2 weeks after stroke. Data are expressed as means ± SEM (DF). Data were pooled from eight (E) and three (F) experiments, each of which gave similar results. The number of mice in each group is indicated in each bar. P < 0.05, ∗∗P < 0.01, and ∗∗∗P < 0.005.
Figure 2
Figure 2
MCs contribute to infiltration of granulocytes and macrophages into the brain after stroke. Representative flow cytometric plots of CD11b-CD45 (A) and Gr1-F4/80 (B) brain immune cells at 3 days after stroke in MC-deficient (WBB6F1-KitW/W-v) mice and their corresponding WT and MC-engrafted mice. Quantification of the indicated immune cell populations before (N) or 3 days or 2 weeks after stroke in MC-deficient WBB6F1-KitW/W-v mice and the corresponding WT mice and MC-engrafted KitW/W-v mice (CE). Data are expressed as means ± SEM. n = 9 to 10 animals per group for naive; n = 8 to 12 animals for 3 days; n = 8 to 9 animals for 2 weeks. P < 0.05, ∗∗P < 0.01. Act., activated; N, naive.
Figure 3
Figure 3
MC-deficient Cpa3-Cre; Mcl-1fl/fl mice have reduced pathology after stroke. Quantification at 3 days after stroke of brain swelling (A) and infarct size (B) and numbers of microglia and lymphoid cells (C); granulocytes and macrophages (D); granulocytes, Act. macrophages, and macrophages (E) in Cpa3-Cre; Mcl-1+/+ mice (which have normal numbers of MCs and basophils) and Cpa3Cre; Mcl-1fl/fl mice (which have markedly reduced numbers of MCs and also reduced numbers of basophils). Data are expressed as means ± SEM. The number of mice in each group is indicated in each bar. P < 0.05. P = 0.07 for lymphoid cells (C) and P = 0.08 for granulocytes (E). Act., activated.
Figure 4
Figure 4
Location of MCs in the CNS. Representative toluidine blue-stained images of and quantification of MCs in dura mater (A), pia mater (B), and brain parenchyma (C) of MC-deficient WBB6F1-KitW/W-v mice and the corresponding WT mice and MC-engrafted KitW/W-v mice. MCs stain purple with toluidine blue; arrows indicate representative MCs. Insets show magnified images of MCs in each tissue. Data are expressed as means ± SEM. The number of mice in each group is indicated in (or over) each bar. P < 0.05. Scale bars: 100 μm (AC). N/A, not applicable.
Figure 5
Figure 5
Meningeal MCs are sufficient to enhance pathology after stroke. Representative T2W-MRI images (A); quantification of brain swelling (B) and infarct size (C); and numbers of microglia and lymphoid cells (D); granulocytes and macrophages (E); granulocytes, Act. macrophages, and macrophages (F) in brain 3 days after stroke in MC-deficient WBB6F1-KitW/W-v mice and the corresponding WT mice and meningeal MC-engrafted KitW/W-v mice. Data are expressed as means ± SEM. The number of mice per group is indicated in each bar. P < 0.05, ∗∗P < 0.01, and ∗∗∗P < 0.005. P = 0.07 for MC-deficient versus MC-engrafted groups for granulocytes (F). Act., activated.
Figure 6
Figure 6
MC-expressed IL-6 contributes to MC-dependent exacerbation of stroke pathology. Quantification at 3 days after stroke of brain swelling (A) and infarct size (B) from T2W-MRI images and numbers of microglia and lymphoid cells (C); granulocytes and macrophages (D); granulocytes, Act. macrophages, and macrophages (E) in the brain in the indicated groups of MC-deficient WBB6F1-KitW/W-v mice, WT (WBB6F1-Kit+/+) mice, and MC-deficient WBB6F1-KitW/W-v mice engrafted in the meninges with WT BMCMCs from WBB6F1-Kit+/+ (WT WBB6F1) or C57BL/6 (WT B6) mice, or BMCMCs derived from B6 mice genetically lacking (KO) IL-6 or CCL7 (MC-engrafted mice). Data are expressed as means ± SEM. The number of mice per group is indicated in each bar. P < 0.05. P = 0.1 for WT B6 MC-engrafted versus B6 CCL7-KO MC-engrafted groups for granulocytes (E). Act., activated.
Figure 7
Figure 7
A: Scheme shows how the brain is enveloped by the meninges that contain MCs in both the dura mater and pia mater. B: Before entering the brain parenchyma, blood vessels course on the surface of the brain between the dura mater and pia mater. Therefore, as a resident immune cell in the meninges, the MC has the potential to influence blood vessels and to function as a gatekeeper to influence brain inflammation and pathology.

References

    1. Go A.S., Mozaffarian D., Roger V.L., Benjamin E.J., Berry J.D., Borden W.B., American Heart Association Statistics Committee and Stroke Statistics Subcommittee Heart disease and stroke statistics–2013 update: a report from the American Heart Association. Circulation. 2013;127:e6–e245. - PMC - PubMed
    1. Donnan G.A., Fisher M., Macleod M., Davis S.M. Stroke. Lancet. 2008;371:1612–1623. - PubMed
    1. Macrez R., Ali C., Toutirais O., Le Mauff B., Defer G., Dirnagl U., Vivien D. Stroke and the immune system: from pathophysiology to new therapeutic strategies. Lancet Neurol. 2011;10:471–480. - PubMed
    1. Iadecola C., Anrather J. The immunology of stroke: from mechanisms to translation. Nat Med. 2011;17:796–808. - PMC - PubMed
    1. Moskowitz M.A., Lo E.H., Iadecola C. The science of stroke: mechanisms in search of treatments. Neuron. 2010;67:181–198. - PMC - PubMed

Publication types