. 2014 Aug 25;211(9):1875-91.
doi: 10.1084/jem.20131397. Epub 2014 Aug 18.

Classical Flt3L-dependent dendritic cells control immunity to protein vaccine

Affiliations

Classical Flt3L-dependent dendritic cells control immunity to protein vaccine

Niroshana Anandasabapathy et al. J Exp Med. .

Abstract

DCs are critical for initiating immunity. The current paradigm in vaccine biology is that DCs migrating from peripheral tissue and classical lymphoid-resident DCs (cDCs) cooperate in the draining LNs to initiate priming and proliferation of T cells. Here, we observe subcutaneous immunity is Fms-like tyrosine kinase 3 ligand (Flt3L) dependent. Flt3L is rapidly secreted after immunization; Flt3 deletion reduces T cell responses by 50%. Flt3L enhances global T cell and humoral immunity as well as both the numbers and antigen capture capacity of migratory DCs (migDCs) and LN-resident cDCs. Surprisingly, however, we find immunity is controlled by cDCs and actively tempered in vivo by migDCs. Deletion of Langerin(+) DC or blockade of DC migration improves immunity. Consistent with an immune-regulatory role, transcriptomic analyses reveals different skin migDC subsets in both mouse and human cluster together, and share immune-suppressing gene expression and regulatory pathways. These data reveal that protective immunity to protein vaccines is controlled by Flt3L-dependent, LN-resident cDCs.


Figures

Figure 1.
Figure 1.
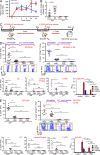
s.c. immunity is Flt3L dependent. (A) Serum from n = 3–5 mice taken before (0 h) or at 1, 3, 6, 24, or 48 h after s.c. immunization with 0.5 µg of αCD205 gag-p24 and GLA (blue) or polyIC(LC) (red). Error bars show mean ± SD. (B) CD4+ IFN-γ+ intracellular cytokine staining from 3 pooled experiments of 4–5 individual WT versus Flt3−/− mice after s.c. vaccination with GLA + 0.5 µg αCD205 gag-p24. Open, filled, and patterned symbols depict individual experiments. Error bars show mean ± SEM (P ≤ 001). (C) Schematic of vaccine immunization schedule and Flt3L versus PBS treatment. (D) CD4+ T cell immunity at lymphoid and mucosal sites and humoral immunity after protein immunization to HIV-gag with multiple adjuvants: GLA (D) and polyIC(LC) (E). CD4+ IFN-γ+ intracellular cytokine staining from splenocytes of individual mice s.c. vaccinated with adjuvant + 5 µg αCD205 gag-p24 in spleen, LN, lamina propria, and lung. CD4+ IFN-γ+ + CFSE divided T cells after 96 h from individual immunized mice depicted in spleen. Circles represent individual mice, open versus filled (pooled from 2 independent experiments, 3–5 mice per group). Error bars show mean ± SEM. *, P ≤ 0.05; **, P ≤ 0.01; ***, P ≤ 0.001. Gag-p24 serum total IgG in Flt3L-treated versus untreated mice, mean ELISA OD450, unimmunized controls. Error bars show mean ± SEM across 5 individual mice from 1 representative experiment. *, P ≤ 0.05; **, P ≤ 0.01; ***, P ≤ 0.001.
Figure 2.
Figure 2.
Flt3L potentiates both soluble and targeted vaccine priming and improves polyclonal CD8+ T cells responses and humoral immunity to OVA cross-presentation. Vaccine priming with αCD205-gag-p24 and soluble p24 at high (5 µg) and low (0.5 µg) doses in Flt3L-treated (red) versus PBS-treated (blue) mice. (A) Intracellular cytokine stain. (B) Proliferation of CD4+ T cells measured by CFSE-diluted IFN-γ+ cells. One representative experiment (n = 3 mice per group). Error bars show mean ± SEM. ^, P ≤ 0.1; *, P ≤ 0.05; **, P ≤ 0.01; ***, P ≤ 0.001. (C) CD8+ IFN-γ+ intracellular cytokine staining from individual mice vaccinated with polyIC(LC) + 5 µg αCD205 OVA intraperitoneal route in spleen, lung, and lamina propria (n = 4–6 mice pooled from 2 independent experiments). CD8+ IFN-γ+ CFSE low/divided T cells at 96 h. One of two representative experiments (n = 5). Error bars show standard error of the mean. CD8+ IFN-γ+ intracellular cytokine staining. OVA serum total IgG, mean ELISA OD450. Error bars show mean ± SEM across 5 individual mice. ^, P ≤ 0.1; *, P ≤ 0.05; **, P ≤ 0.01; ***, P ≤ 0.001.
Figure 3.
Figure 3.
Flt3L expands classical, migratory, and plasmacytoid DC subsets in the skin draining LN and enhances antigen capture by CD205+ migratory and LN-resident cDCs in vivo. (A) Flt3L-treated (left) compared with WT (middle) and Flt3L−/− mice (right). One representative experiment (of three) with sample quantitation of DC subsets for two pooled skin-draining LNs. Error bars show standard deviation between 3 mice. ^, P ≤ 0.1; *, P ≤ 0.05; **, P ≤ 0.01; ***, P ≤ 0.001. (B) Representative CD8α+ CD11b low and CD8α CD11b high DC subset gating, from classical (cDCs) gate of skin draining LN from mice treated with Flt3L (left) or controls (right). Total % CD205 positive cells from within CD8α+ CD11b low cDC subset (cell surface and intracellular staining). (C) In vitro capture of αCD205 with equivalent total skin draining LN cells from Flt3L-treated versus PBS mice gated on total LN cDCs versus CD8α cDCs. One representative experiment of two with n = 3 mice per group, error bars depict SEM. *, P ≤ 0.05; **, P ≤ 0.01; ***, P ≤ 0.001. (D) Skin draining LN migratory DC subsets from within IAIEhi CD11cintermediate population from mice treated with Flt3L (left) or controls (right). CD103+ gating from within Langerin+ subset. CD205 cell surface and intracellular staining from migratory subsets (flow cytometry). (E) In vitro capture of αCD205+ with equivalent total skin draining LN cells from Flt3L-treated versus PBS mice, gated on migDC. 1 representative experiment of 2 with n = 3 mice per group, error bars depict SEM. *, P ≤ 0.05; **, P ≤ 0.01; ***, P ≤ 0.001. (F) αCD205-A647 versus Isotype-A647 control antibody was injected by s.c. immunization in the footpad of control versus Flt3L-treated recipients (n = three mice per group, one representative experiment of three, one representative FACS plot shown). At 3 h, draining (popliteal) versus distal (inguinal) LNs were harvested and migratory versus conventional DC subsets were gated for antibody uptake.
Figure 4.
Figure 4.
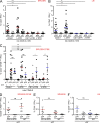
Langerin+ DC, including LCs and CD103+ DC, are not required for CD4 s.c. protein immunization. (A) Deletion of Langerin+ migratory DC subsets after a single dose (1 µg) DT administered 24 h before harvest. (B) Deletion of Langerin+ subsets in Flt3L-treated Langerin DTR mice administered Flt3L daily. DT was administered −3 and −1 d before harvest at day 8. (C) Schema: 1 µg DT was administered to Langerin DTR mice versus WT controls day −3 or −1 to s.c. vaccine prime or boost with GLA plus 5 or 0.5 µg αCD205 gag-p24. (D) Spleen, (E) LN, (F) Lung- intracellular cytokine staining. (G) CD4+ IFN-γ+ CFSE divided cells in Langerin DTR versus C57BL/6 WT mice in Flt3L-treated (red Flt3L treated, 1 representative experiment at 5 µg, or pooled from 2–3 independent experiments at 0.5 µg) or PBS-treated controls (blue, pooled from 2–3 independent experiments at 5 or 0.5μγ; ^, P ≤ 0.1; *, P ≤ 0.05; **, P ≤ 0.01; ***, P ≤ 0.001). (H) Serum HIV gag-p24 IgG titers in Langerin DTR versus WT mice treated with Flt3L versus PBS (one representative experiment of three (n = 5 mice), *, P ≤ 0.05, **, P ≤ 0.01, ***, P ≤ 0.001). (I–K) 1 µg DT was administered to Langerin DTR mice versus WT controls day −3 or −1 to vaccine prime or boost with s.c. polyIC(LC) plus 0.5 µg αCD205 OVA. In vitro challenge of OVA versus control peptide. (I) Spleen, (J) LN intracellular cytokine staining, and (K) CD8+ IFN-γ+ CFSE divided cells (n = 4–7 mice total per group pooled from 2 independent experiments). (L) Capture of αCD205 by classical CD8α+ LN cDCs 3 h after footpad injection (7.5 µg total) is improved by Flt3L but not altered after Langerin+ DC ablation. 1 µg of DT was administered at −3 and −1 d, with injection and harvest on day 0, after 9–10 d of PBS or Flt3L treatment. (left) WT (green), Langerin-DTR mice (red). (right) % αCD205uptake by cDCs and migDCs in the popliteal LNs. Pooled from two independent experiments (n = 5–6 mice total; ^, P ≤ 0.1; *, P ≤ 0.05; **, P ≤ 0.01; ***, P ≤ 0.001).
Figure 5.
Figure 5.
Blockade of migratory DCs does not impair immunity after s.c. or i.d. protein immunization. (A) Representative gating of inguinal LN taken from CCR7−/− and Flt3L-treated and untreated vaccine mice. (B) CCR7−/− mice versus B6 controls were immunized with 5 or 0.5 µg of αCD205 gag-p24 in separate experiments (n = 3 mice per group). Error bars show mean ± SEM. *, P ≤ 0.05; **, P ≤ 0.01; ***, P ≤ 0.001. Red, Flt3L treated; blue, PBS treated. Intracellular cytokine staining for spleen, LN, and lung parenchyma and CFSE dilution of splenocytes after 4 d in culture with p24. (C) i.d. immunization with 0.5 µg αCD205 gag-p24: proximal draining LN and spleen intracellular cytokine staining and CFSE dilution of splenocytes after 4 d in culture with p24. Pooled from 3 independent experiments of n = 5 mice per group. Error bars show mean ± SEM. *, P ≤ 0.05; **, P ≤ 0.01; ***, P ≤ 0.001). (D) CD8+ CFSE divided IFN-γ T cells after DEC-OVA SQ immunization. Pooled from 2 experiments, n = 4–5 mice per group. Error bars show mean ± SEM. *, P ≤ 0.05; **, P ≤ 0.01; ***, P ≤ 0.001. (E) Mixed bone marrow chimera after SQ immunization with 0.5 µg αCD205 gag-p24 in the presence or absence of DT, CFSE dilution shown. Pooled from 2 independent experiments with n = 4–5 mice per group for CCR7+ZDTR chimeras compared plus and minus DT; n = 1 experiment for 5 mice per group for CCR7+CD45.1 plus and minus DT controls. Error bars show mean ± SEM. *, P ≤ 0.05; **, P ≤ 0.01; ***, P ≤ 0.001.
Figure 6.
Figure 6.
ZBTB46-dependent classical DCs are required for s.c. protein immunization. (A–C) CD45.2 mice were irradiated and reconstituted with bone marrow as indicated. Chimeras received DT on day −3 and −1 to prime and boost immunization with 0.5 µg αCD205 gag-p24. Intracellular cytokine staining immediately ex vivo for (A) Spleen and (B) LN. Black shows staining for p17 peptide control (plus DT) versus red or blue (plus DT) p24 peptide challenge. (C) CFSE dilution of splenocytes after 4 d in culture. (A–C) Pooled from 4–5 independent experiments (n = 3–5 mice per group, based on survival after DT administration). No DT controls (blue) performed once across all 4 groups (n = 4–5 mice per group). Error bars show mean ± SEM. ^, P ≤ 0.1; *, P ≤ 0.05; **, P ≤ 0.01; ***, P ≤ 0.001). (D–F) CD11b DTR versus B6 control mice were administered DT on day −3 and −1 to prime-boost immunization with 0.5 µg αCD205 gag-p24. CFSE dilution of splenocytes after 4 d in culture (D) and intracellular cytokine stainings (E–F). Black shows staining for p17 peptide control (plus DT), red or blue (plus DT) show p24 challenge in wild-type and controls. One representative experiment of n = 4–5 mice per group. Error bars show mean ± SEM. *, P ≤ 0.05; **, P ≤ 0.01; ***, P ≤ 0.001.
Figure 7.
Figure 7.
Migratory DC subsets cluster together and share higher expression of immune dampening genes and down-regulation of genes associated with DC activation when compared with cross-presenting DCs in mouse and human. (A) PCA on twofold change (relative to LN CD8α+ cDCs) or greater in the top 15% of all genes (n = 1,290) genes for 3 individual migratory DC, versus LPS-treated CD205+ cDCs, DC-SIGN+ monocyte-derived DCs, and macrophages (mouse); n = 3 or 4 independent sorting experiments and sample replicates. (B) PCA on twofold change (relative to BDCA3+ or BDCA1+ blood DCs) or greater in the top 15% of all genes (n = 920) for human skin-resident versus blood DC and monocyte subsets. (C) Genes shared across all three migDCs subsets with twofold or greater difference compared with CD8α cDCs (mouse) or blood BDCA3+ DC humans: (left) mouse and (right) human skin DC subsets. * denotes the fold difference was under the threshold cut off of twofold in at least one of three migDC subsets. (D) Cross-species IPA. 227 genes commonly up-regulated by twofold or greater across all 3 migratory skin DC subsets compared with classical cross-presenting DCs in both mouse and human. Red represents up-regulated pathways; green represents down-regulated pathways.

Comment in

References

    1. Ahmed, R., and Akondy R.S.. 2011. Insights into human CD8(+) T-cell memory using the yellow fever and smallpox vaccines. Immunol. Cell Biol. 89:340–345 10.1038/icb.2010.155 - DOI - PubMed
    1. Allenspach, E.J., Lemos M.P., Porrett P.M., Turka L.A., and Laufer T.M.. 2008. Migratory and lymphoid-resident dendritic cells cooperate to efficiently prime naive CD4 T cells. Immunity. 29:795–806 10.1016/j.immuni.2008.08.013 - DOI - PMC - PubMed
    1. Bajénoff, M., Granjeaud S., and Guerder S.. 2003. The strategy of T cell antigen-presenting cell encounter in antigen-draining lymph nodes revealed by imaging of initial T cell activation. J. Exp. Med. 198:715–724 10.1084/jem.20030167 - DOI - PMC - PubMed
    1. Bedoui, S., Prato S., Mintern J., Gebhardt T., Zhan Y., Lew A.M., Heath W.R., Villadangos J.A., and Segura E.. 2009a. Characterization of an immediate splenic precursor of CD8+ dendritic cells capable of inducing antiviral T cell responses. J. Immunol. 182:4200–4207 10.4049/jimmunol.0802286 - DOI - PubMed
    1. Bedoui, S., Whitney P.G., Waithman J., Eidsmo L., Wakim L., Caminschi I., Allan R.S., Wojtasiak M., Shortman K., Carbone F.R., et al. . 2009b. Cross-presentation of viral and self antigens by skin-derived CD103+ dendritic cells. Nat. Immunol. 10:488–495 10.1038/ni.1724 - DOI - PubMed

Publication types

MeSH terms