

Hospital end-of-life treatment intensity among cancer and non-cancer cohorts
- PMID: 25135656
- PMCID: PMC4329285
- DOI: 10.1016/j.jpainsymman.2014.06.017
Hospital end-of-life treatment intensity among cancer and non-cancer cohorts
Abstract
Context: Hospitals vary substantially in their end-of-life (EOL) treatment intensity. It is unknown if patterns of EOL treatment intensity are consistent across conditions.
Objectives: To explore the relationship between hospitals' cancer- and non-cancer-specific EOL treatment intensity.
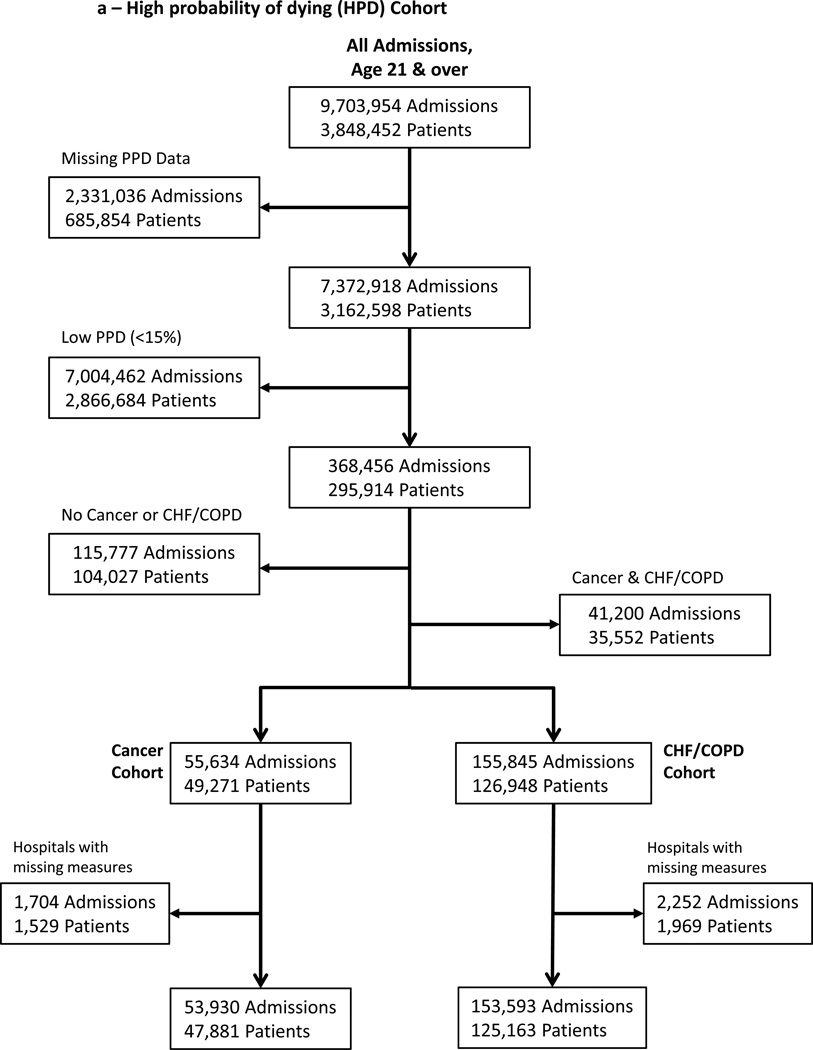
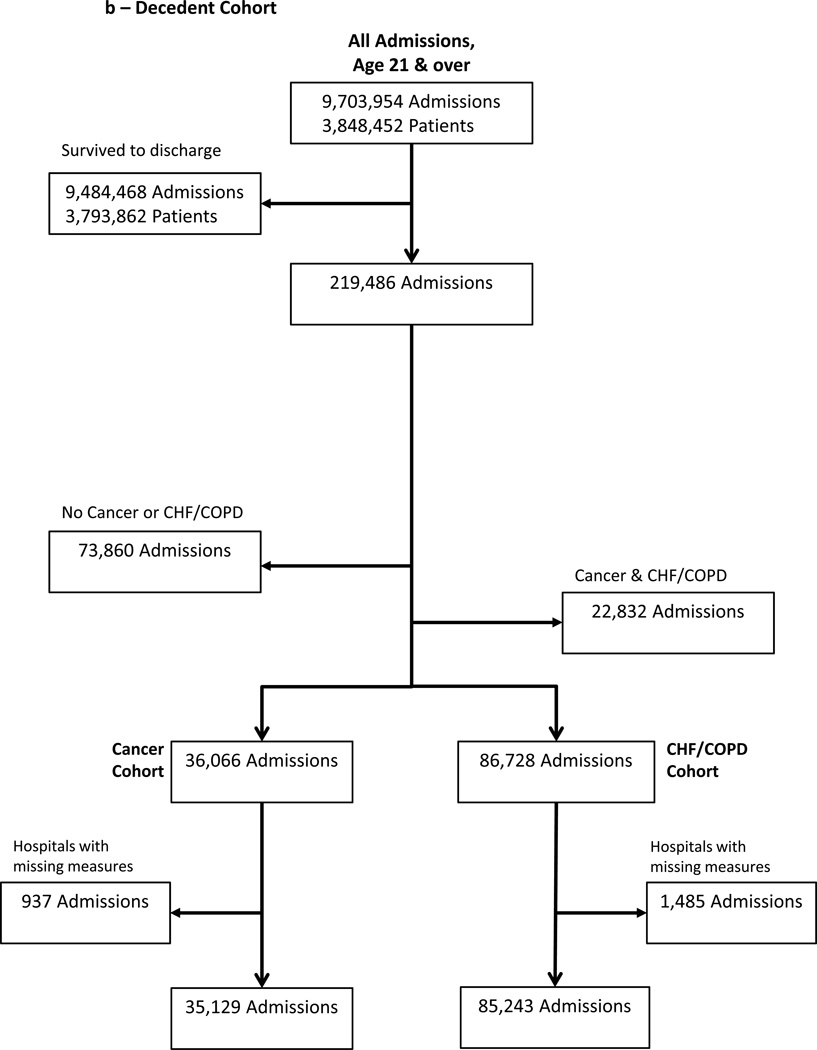
Methods: We conducted a retrospective cohort analysis of Pennsylvania acute care hospital admissions for either cancer or congestive heart failure (CHF) and/or chronic obstructive pulmonary disease (COPD) between 2001 and 2007, linked to vital statistics through 2008. We calculated Bayes's shrunken case-mix standardized (observed-to-expected) ratios of intensive care and life-sustaining treatment use among two EOL cohorts: those prospectively identified at high probability of dying on admission and those retrospectively identified as terminal admissions (decedents). We then summed these to create a hospital-specific prospective and retrospective overall EOL treatment intensity index for cancer vs. CHF/COPD.
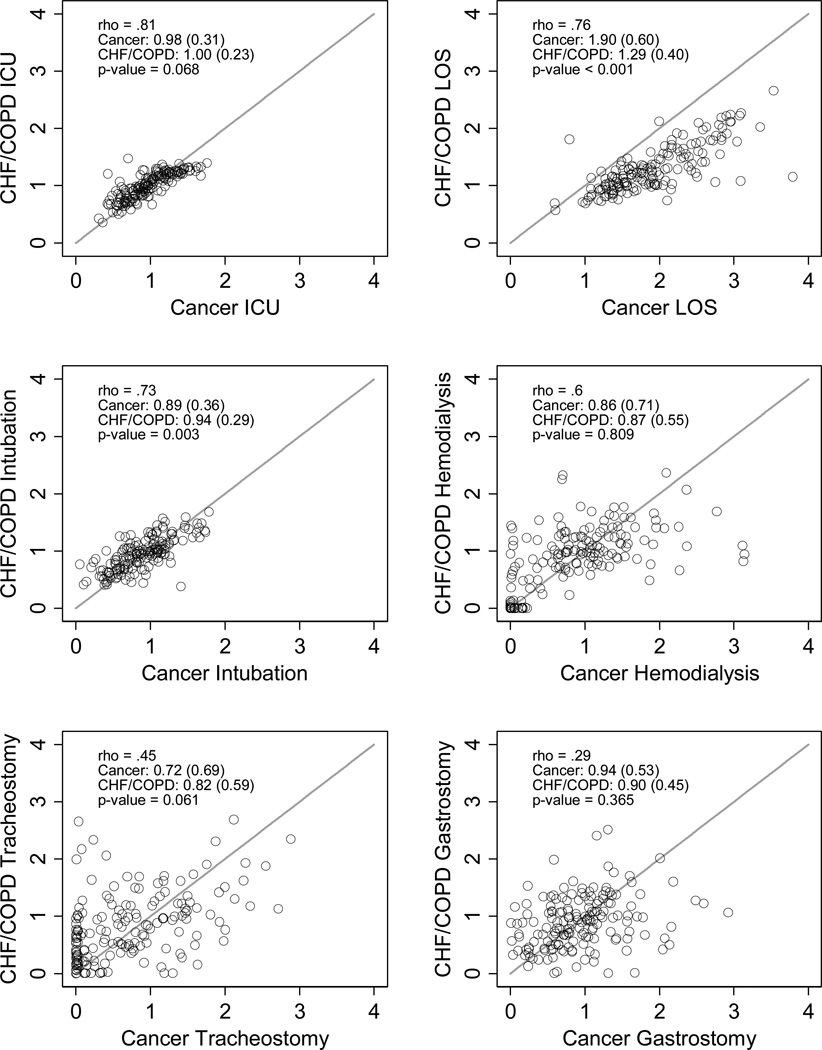
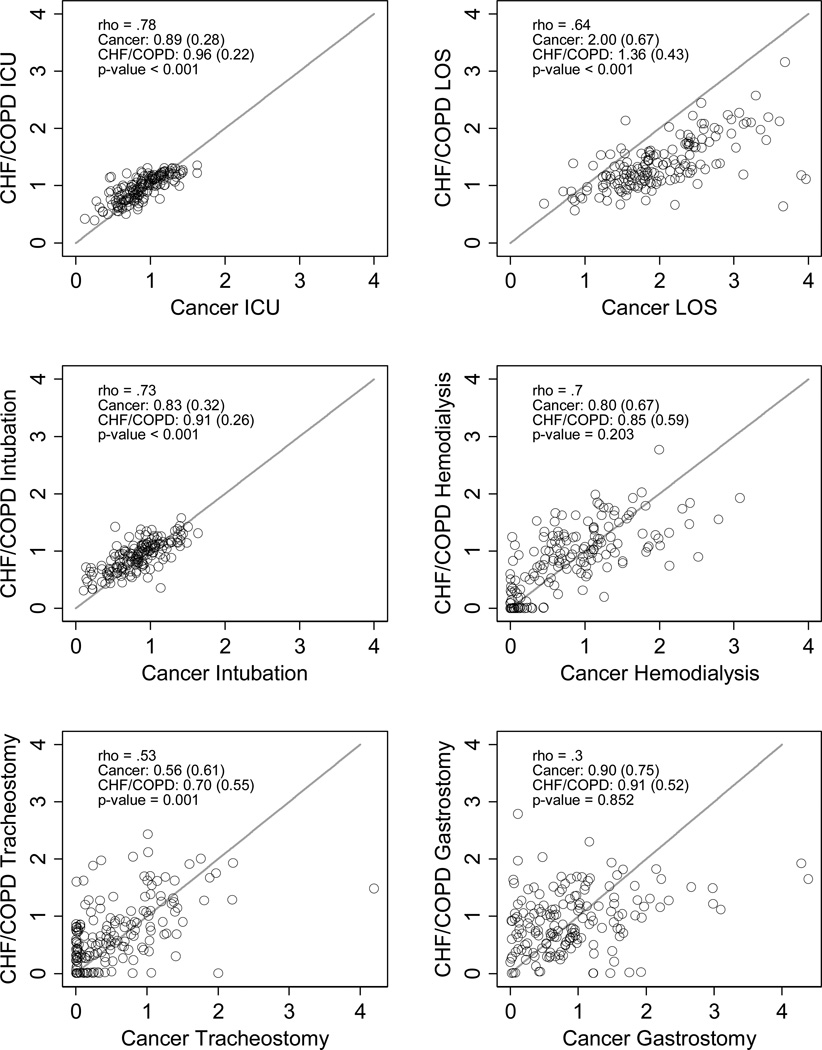
Results: The sample included 207,523 admissions with 15% or greater predicted probability of dying on admission among 172,041 unique adults and 120,372 terminal admissions at 166 hospitals; these two cohorts overlapped by 52,986 admissions. There was substantial variation between hospitals in their standardized EOL treatment intensity ratios among cancer and CHF/COPD admissions. Within hospitals, cancer- and CHF/COPD-specific standardized EOL treatment intensity ratios were highly correlated for intensive care unit (ICU) admission (prospective ρ = 0.81; retrospective ρ = 0.78), ICU lengths of stay (ρ = 0.76; 0.64), mechanical ventilation (ρ = 0.73; 0.73), and hemodialysis (ρ = 0.60; 0.71) and less highly correlated for tracheostomy (ρ = 0.43; 0.53) and gastrostomy (ρ = 0.29; 0.30). Hospitals' overall EOL intensity index for cancer and CHF admissions were correlated (prospective ρ = 0.75; retrospective ρ = 0.75) and had equal group means (P-value = 0.631; 0.699).
Conclusion: Despite substantial difference between hospitals in EOL treatment intensity, within-hospital homogeneity in EOL treatment intensity for cancer- and non-cancer populations suggests the existence of condition-insensitive institutional norms of EOL treatment.
Keywords: Terminal care; cancer; chronic obstructive pulmonary disease; congestive heart failure; end-of-life care; health services; hospital; intensive care; mechanical ventilation; utilization; variation.
Copyright © 2015 American Academy of Hospice and Palliative Medicine. Published by Elsevier Inc. All rights reserved.
Conflict of interest statement
None of the authors has a conflict of interest in the research reported.
Figures
References
-
- Lynn J, Harrell F, Jr, Cohn F, Wagner D, Connors AF., Jr Prognoses of seriously ill hospitalized patients on the days before death: implications for patient care and public policy. New Horiz. 1997;5(1):56–61. - PubMed
-
- Detsky AS, Stricker SC, Mulley AG, Thibault GE. Prognosis, survival, and the expenditure of hospital resources for patients in an intensive-care unit. N Engl J Med. 1981;305(12):667–672. - PubMed
Publication types
MeSH terms
Grants and funding
LinkOut - more resources
Full Text Sources
Other Literature Sources
Medical
Molecular Biology Databases
