. 2014 Aug 18;206(4):473-83.
doi: 10.1083/jcb.201406004.

cPKC regulates interphase nuclear size during Xenopus development

Affiliations

cPKC regulates interphase nuclear size during Xenopus development

Lisa J Edens et al. J Cell Biol. .

Abstract

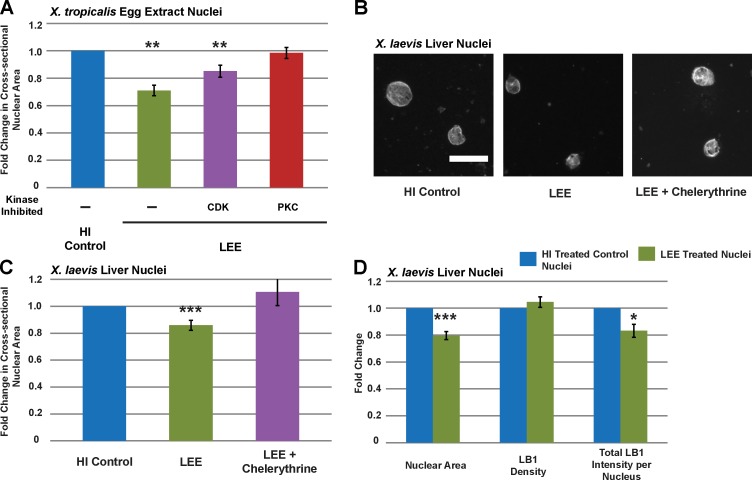
Dramatic changes in cell and nuclear size occur during development and differentiation, and aberrant nuclear size is associated with many disease states. However, the mechanisms that regulate nuclear size are largely unknown. A robust system for investigating nuclear size is early Xenopus laevis development, during which reductions in nuclear size occur without changes in DNA content. To identify cellular factors that regulate nuclear size during development, we developed a novel nuclear resizing assay wherein nuclei assembled in Xenopus egg extract become smaller in the presence of cytoplasmic interphase extract isolated from post-gastrula Xenopus embryos. We show that nuclear shrinkage depends on conventional protein kinase C (cPKC). Increased nuclear cPKC localization and activity and decreased nuclear association of lamins mediate nuclear size reductions during development, and manipulating cPKC activity in vivo during interphase alters nuclear size in the embryo. We propose a model of steady-state nuclear size regulation whereby nuclear expansion is balanced by an active cPKC-dependent mechanism that reduces nuclear size.


Figures

Figure 1.
Figure 1.
Characterization of a novel nuclear shrinking assay. (A) In vivo: diagrams of X. laevis embryos are reprinted from Nieuwkoop and Faber (1956), and images of NPC-stained endogenous embryonic nuclei are adapted from Levy and Heald (2010; with permission from Elsevier). In vitro: nuclei assembled in X. laevis egg extract were incubated in LEE and visualized by NPC staining (mAb414). Complete details of the assay are described in the Materials and methods section. (B) Confocal z stacks (3-µm-thick sections) were acquired and maximum intensity projections are shown for representative nuclei. The control nuclei were treated with HI-LEE. n > 10 nuclei and 3 different extracts. (C) 3D surface plots are shown for the nuclei in B. (D) Nuclei treated with HI-LEE (control) and LEE were stained with mAb414. Nuclear surface area was calculated directly from confocal z stacks (blue bars), and nuclear surface area was then estimated for those same nuclei by measuring the cross-sectional area and multiplying by four (green bars). These values agreed within 3% (P > 0.7), which is consistent with these nuclei having roughly spherical geometry and validating our approach of estimating total NE surface area from the cross-sectional area. n = 20 nuclei each, error bars represent SD. (E) Nuclear shrinking data from 46 different extracts are shown. “Control Treated Nuclei” represent nuclei incubated in either extract buffer or HI-LEE. Each bar shows the mean for >240 nuclei. Error bars represent SD. (F) Nuclei were assembled de novo in X. laevis egg extract supplemented with recombinant GFP-LB3 and incubated in LEE. Live time-lapse imaging was performed at 30-s intervals for 90 min (see Video 1). Figure panels show 10-min intervals of a representative shrinking nucleus. (G) De novo assembled nuclei were incubated in LEE or HI-LEE, fixed at 30-min intervals, and quantified. Error bars represent SD. One representative experiment out of eight is shown. (H) Box-and-whisker plots are shown comparing fold changes in nuclear surface area. The blue (control nuclei) and green (LEE-treated nuclei) bars show in vitro data from one representative experiment (n > 200 nuclei for each treatment), normalized to the mean size for the control treated nuclei. The purple (stage 10) and red (stage 14) bars are in vivo nuclear sizes (n > 140 nuclei for each stage), normalized to the mean size for stage 10 nuclei. Boxes represent 50% of the data and the thick black line represents the median. The upper and lower error bars represent the upper and lower quartile of the data, respectively. Bars: (A) 20 µm; (B and C) 5 µm; (F) 10 µm.
Figure 2.
Figure 2.
Nuclear shrinking depends on conventional PKC activity. The nuclear shrinking assay was performed as in Fig. 1. Nuclear size was normalized against the HI-LEE control in A–E. (A) Kinase inhibitors were added as follows: CDK-olomoucine (2 mM), PKA-KT 5720 (56 nM), Aurora kinase–ZM 447439 (20 µM), and PKC-chelerythrine (390 µM). n = 6 different extracts. (B) Pan-PKC or rabbit IgG control antibodies were added to LEE at 2.5 µg/ml. n = 3 different extracts. (C) Calcium depletion was accomplished by supplementing LEE with 1 mM EGTA. A 45-min EGTA treatment was rescued by the addition of 4 nM CaCl2. DAG depletion was accomplished with 60 µM propranolol. n = 4 different extracts. (D) Inhibitory human PKC βI or rabbit IgG control antibodies were added to LEE at 2.5 µg/ml. n = 2 different extracts. (E) Where indicated, LEE was treated with chelerythrine (390 µM) for 45 min, then recombinant constitutively active PKC-β-ΔNPS (1 nM) was added followed by an additional 45-min incubation. n = 2 different extracts. (F) Nuclei were assembled de novo in X. laevis egg extract for 45 min. Chelerythrine (390 µM), constitutively active PKC-β-ΔNPS (1 nM), or PMA (1.6 µM) were then added, and nuclear expansion was allowed to progress for an additional 45 min. Nuclear size was normalized to the 45 min time point. n = 5 different extracts. ***, P < 0.005; **, P < 0.01; *, P < 0.05. Error bars represent SD.
Figure 3.
Figure 3.
Lamins are removed during nuclear shrinking in a PKC-dependent manner. The nuclear shrinking assay was performed as in Fig. 1. Z-stack images were acquired by confocal microscopy. For intensity measurements, all images were acquired with the same exposure time. NPC and LB3 density at the NE were determined by quantifying staining intensity within a fixed defined area (20 µm2) for an individual z slice at the periphery of the nucleus. Total NE staining intensity per nucleus was estimated from the density measurement and total NE surface area. Shown in A and C are representative maximum-intensity projections and z slices at the periphery of nuclei used for intensity measurements. Bars, 5 µm. (A and B) NPCs were visualized with mAb414 (red). n > 10 different nuclei in two different extracts. (C and D) LB3 was visualized with an α-LB3 antibody (green). n > 10 different nuclei in two different extracts. ***, P < 0.005. Error bars represent SD.
Figure 4.
Figure 4.
Shrinking of X. tropicalis nuclei and somatic cell nuclei. (A) Nuclei assembled de novo in X. tropicalis egg extract were subjected to the nuclear shrinking assay as described in Fig. 1. Kinase inhibitors were added to the same concentrations as in Fig. 2 A. (B and C) Nuclei were isolated from adult X. laevis liver, subjected to the nuclear shrinking assay, visualized with mAb414, and imaged by wide-field microscopy. n = 4 different liver nuclei preparations and extracts. Bar, 10 µm. (D) X. laevis liver nuclei treated with HI control extract or LEE were visualized by immunofluorescence using an antibody against lamin B1. Confocal imaging and quantification were performed as in Fig. 3. n = 4 different liver nuclei preparations and 3 extracts. ***, P < 0.005; **, P < 0.01; *, P < 0.05. Error bars represent SD.
Figure 5.
Figure 5.
PKC nuclear localization and activity increase during X. laevis development, and altering PKC activity in vivo affects nuclear size. (A) Western blots of whole embryo lysates (0.6 embryo equivalents per lane) from stages 2–12 were probed with a pan-PKC or Ran antibody. n = 2 different sets of whole embryo preparations. One representative gel is shown. (B and C) Nuclei assembled de novo in egg extract and endogenous stage 12 nuclei were stained with a phospho-cPKC antibody (green). Confocal images were acquired, and PKC staining intensity was quantified as described in Fig. 3. n = 2 different extracts. Bar, 10 µm. (D) PKC activity was detected in extracts using a colorimetric PKC-specific peptide substrate (see Materials and methods). Unphosphorylated substrate migrates toward the anode (above the loading well) while phosphorylated substrate migrates toward the cathode (below the loading well). Results for three different egg extracts and LEEs are shown. Where indicated, chelerythrine was added at 390 µM. (E) One-cell embryos were microinjected with morpholinos against PKC α, PKC β, or a scrambled control and allowed to develop to stage 12. Nuclei isolated from embryos were visualized with mAb414 and quantified. n = 3 different fertilizations, with at least 20 embryos each. (F) Stage 8 embryos were arrested in interphase by incubating for 30 min in cycloheximide (0.5 mM), followed by a 60-min incubation with chelerythrine or PMA as indicated. Nuclei were quantified as in E. n = 2 different fertilizations, with at least 15 embryos each. (G) Stage 8 embryos were incubated for 90 min with chelerythrine or PMA as indicated. Nuclei were quantified as in E. n = 2–3 different fertilizations, with at least 20 embryos each. (H) Single-cell embryos were microinjected with GFP-NLS mRNA to visualize nuclei, and allowed to develop to stage 12. Embryos were treated with 24 µM chelerythrine or 80 nM PMA, as indicated, and confocal time-lapse images were acquired every minute on the surface of live embryos for 45 min (see Videos 2–10). For individual nuclei, cross-sectional nuclear area was quantified every 5 min and normalized to the size at t = 0. For each treatment condition, n = 12 nuclei from three movies of different embryos. Thicker lines denote averages for a given treatment, and stars refer to specific nuclei highlighted in Videos 2, 5, and 8. **, P < 0.01; *, P < 0.05. Error bars represent SD.

Comment in

  • Development: Honey, I shrunk the nucleus.
    Du Toit A. Du Toit A. Nat Rev Mol Cell Biol. 2014 Oct;15(10):633. doi: 10.1038/nrm3872. Epub 2014 Sep 4. Nat Rev Mol Cell Biol. 2014. PMID: 25186132 No abstract available.

References

    1. Anderson, D.J., and Hetzer M.W.. 2008a. Reshaping of the endoplasmic reticulum limits the rate for nuclear envelope formation. J. Cell Biol. 182:911–924 10.1083/jcb.200805140 - DOI - PMC - PubMed
    1. Anderson, D.J., and Hetzer M.W.. 2008b. The life cycle of the metazoan nuclear envelope. Curr. Opin. Cell Biol. 20:386–392 10.1016/j.ceb.2008.03.016 - DOI - PMC - PubMed
    1. Benavente, R., Krohne G., and Franke W.W.. 1985. Cell type-specific expression of nuclear lamina proteins during development of Xenopus laevis. Cell. 41:177–190 10.1016/0092-8674(85)90072-8 - DOI - PubMed
    1. Blom, J.H., Ten Kate F.J., Schroeder F.H., and van der Heul R.O.. 1990. Morphometrically estimated variation in nuclear size. Urol. Res. 18:93–99 10.1007/BF00302467 - DOI - PubMed
    1. Brown, K.S., Blower M.D., Maresca T.J., Grammer T.C., Harland R.M., and Heald R.. 2007. Xenopus tropicalis egg extracts provide insight into scaling of the mitotic spindle. J. Cell Biol. 176:765–770 10.1083/jcb.200610043 - DOI - PMC - PubMed

Publication types