. 2014 Nov;24(11):1894-904.
doi: 10.1101/gr.177774.114. Epub 2014 Aug 18.

The landscape of human STR variation

Affiliations

The landscape of human STR variation

Thomas Willems et al. Genome Res. 2014 Nov.

Abstract

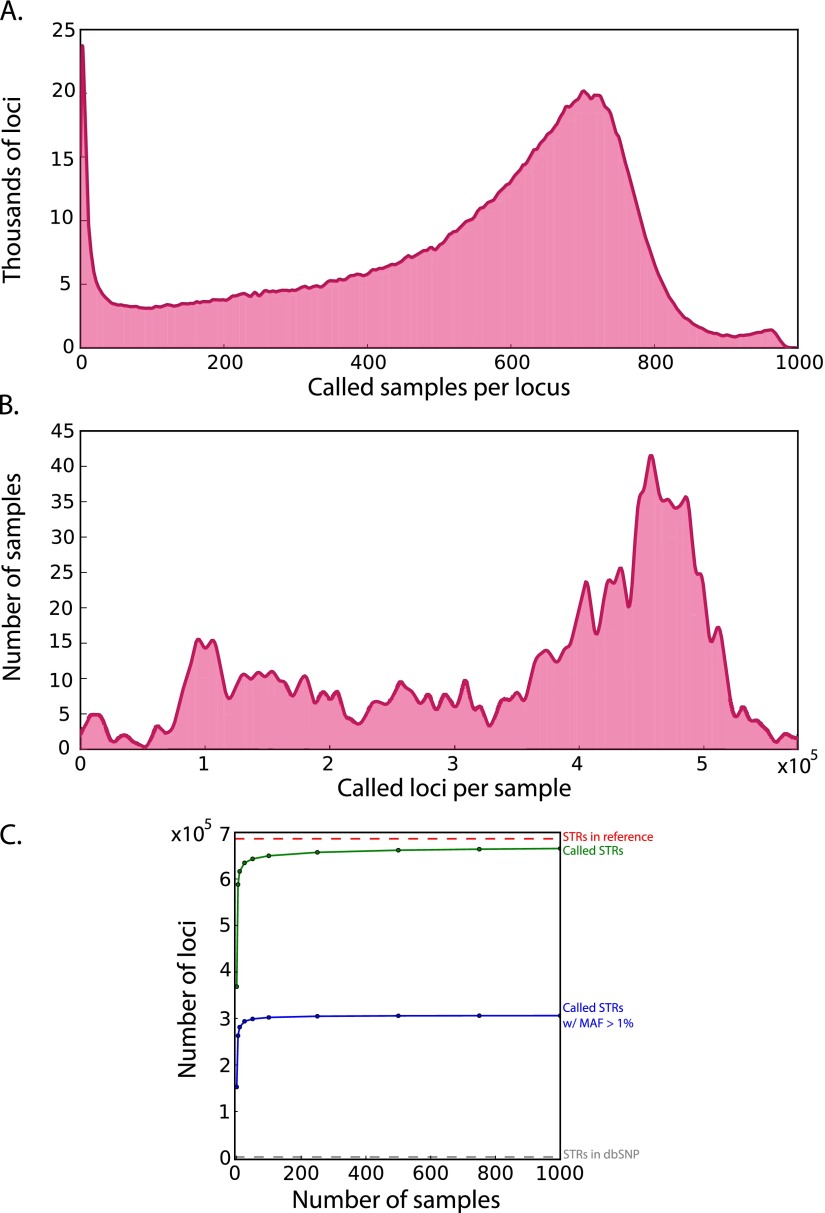
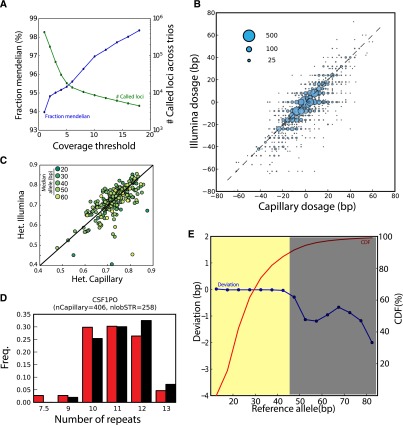
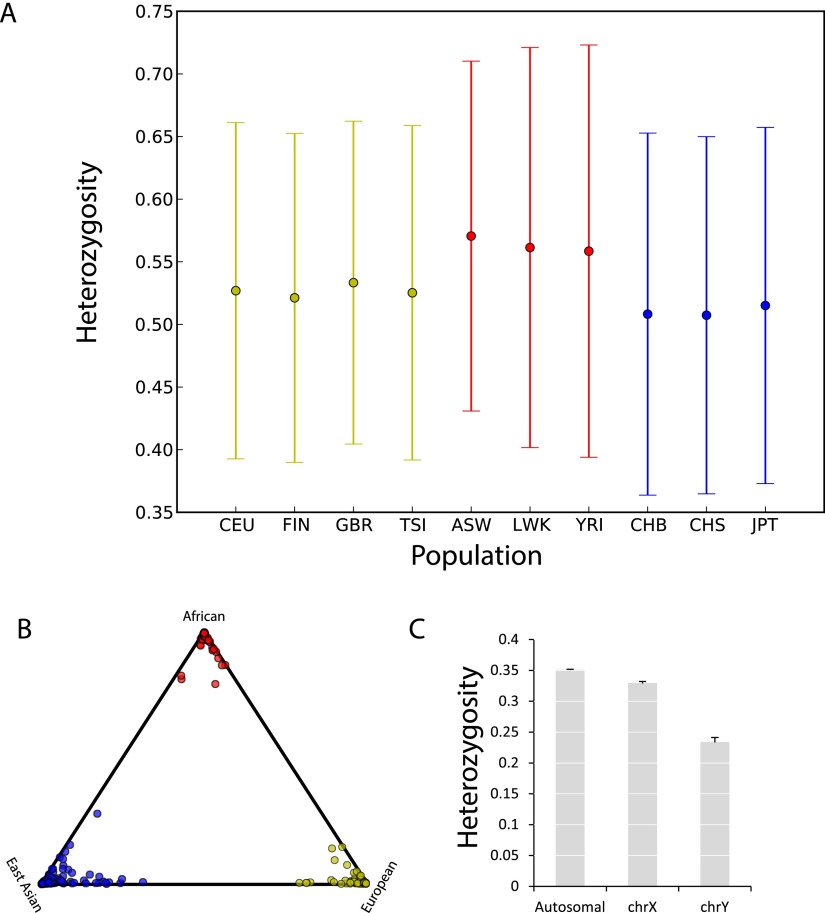
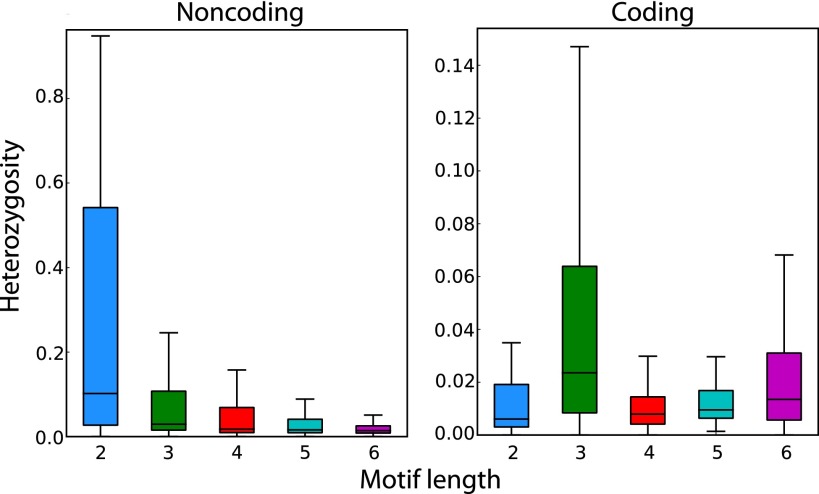
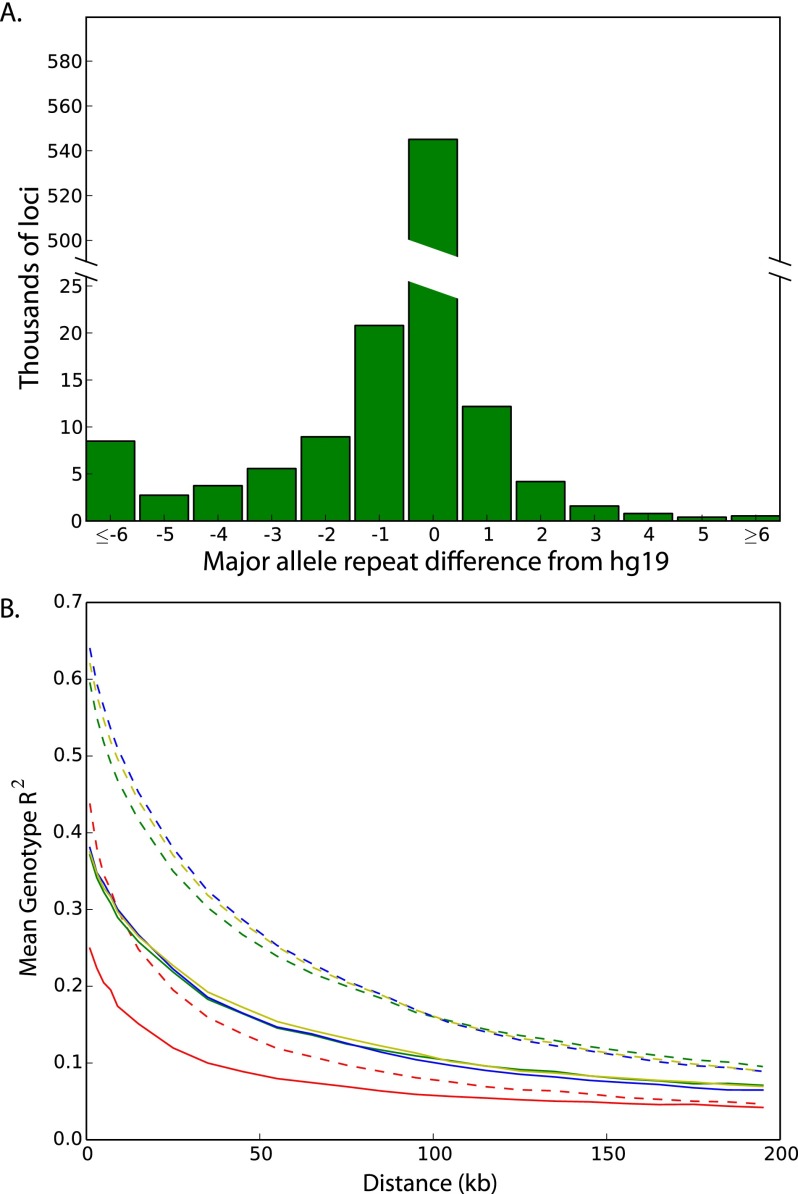
Short tandem repeats are among the most polymorphic loci in the human genome. These loci play a role in the etiology of a range of genetic diseases and have been frequently utilized in forensics, population genetics, and genetic genealogy. Despite this plethora of applications, little is known about the variation of most STRs in the human population. Here, we report the largest-scale analysis of human STR variation to date. We collected information for nearly 700,000 STR loci across more than 1000 individuals in Phase 1 of the 1000 Genomes Project. Extensive quality controls show that reliable allelic spectra can be obtained for close to 90% of the STR loci in the genome. We utilize this call set to analyze determinants of STR variation, assess the human reference genome's representation of STR alleles, find STR loci with common loss-of-function alleles, and obtain initial estimates of the linkage disequilibrium between STRs and common SNPs. Overall, these analyses further elucidate the scale of genetic variation beyond classical point mutations.


Figures

Figure 1.
Figure 1.
Call set statistics. (A) Distribution of the number of called samples per locus. The average is 528 samples per STR with a standard deviation of 231. (B) Distribution of the number of called loci per sample. The average is 349,892 STRs per sample with a standard deviation of 145,135. (C) Saturation curves for the catalog. The number of called loci (green) rapidly approaches the total number of STRs in the genome (red line). The number of called loci with a MAF > 1% (blue) saturates after 100 samples and far exceeds the number of STR variants in dbSNP (gray line close to the x-axis).
Figure 2.
Figure 2.
Quality assessments of the STR catalog. (A) Consistency of lobSTR calls with Mendelian inheritance. The blue line denotes the fraction of STR loci that followed Mendelian inheritance as a function of the read coverage threshold. The green line denotes the total number of calls in the three trios that passed the coverage threshold. (B) Concordance between lobSTR and capillary electrophoresis genotypes. The STR calls were taken from the highly polymorphic Marshfield panel. The dosage is reported as the sum of base pair differences from the hg19 reference. The area of each bubble is proportional to the number of calls of the dosage combination, and the broken line indicates the diagonal. (C) Comparison of heterozygosity rates for Marshfield panel STRs. The color denotes the length of the median allele of the STR (dark-short; light-long). (D) A comparison of allelic spectra obtained by lobSTR and capillary electrophoresis for a CODIS marker in European individuals. (Red) lobSTR; (black) capillary electrophoresis. nlobSTR and nCapillary indicate the number of alleles called in the respective call sets. (E) The reliable range of lobSTR allelic spectra. The figure presents the median deviation of the lobSTR calls from hg19 as function of the reference allele length (blue curve). Negative deviations indicate a potential preference toward ascertaining shorter alleles. STRs with reference alleles of up to ∼45 bp show very minimal deviations (yellow region) and are expected to display unbiased frequency spectra with the current read lengths. These STR loci comprise close to 90% of the total genotyped STRs in our catalog (red curve).
Figure 3.
Figure 3.
Evaluation of the STR catalog for population genetics. (A) Genetic diversity of the 10% most heterozygous autosomal loci in different populations. (Yellow) European; (red) African; (blue) East Asian. The mean heterozygosities (dot) of the African subpopulations consistently exceed those of the non-African subpopulations. The whiskers extend to ±1 standard deviation. See Supplemental Table 3 for population abbreviations. (B) STRUCTURE clustering based on the 100 most polymorphic autosomal STR loci. Each subpopulation clusters tightly by geographic origin. Color labels as in A. (C) Average STR heterozygosity as a function of chromosome type. Bars denote the standard error.
Figure 4.
Figure 4.
Motif length and coding capabilities as determinants of STR variability. STR heterozygosity monotonically decreases with motif length for noncoding loci and is generally reduced in noncoding (left) versus coding regions (right). The box extends from the lower to upper quartiles of the heterozygosity distribution, and the interior line indicates the median. The whiskers extend to the most extreme points within 1.5*IQR of the quartiles.
Figure 5.
Figure 5.
Population-scale analyses of STR variation. (A) Distribution of base-pair differences between each locus’ most common allele and the hg19 reference allele. (B) Patterns of linkage disequilibrium for SNPs and STRs on the X chromosome. SNP-SNP LD (dashed lines) generally exceeds SNP-STR LD (solid lines) across a range of distances for Africans (red), Admixed Americans (green), Europeans (yellow), and East Asians (blue).

References

    1. The 1000 Genomes Project Consortium . 2012. An integrated map of genetic variation from 1,092 human genomes. Nature 491: 56–65 - PMC - PubMed
    1. Amiel J, Trochet D, Clément-Ziza M, Munnich A, Lyonnet S. 2004. Polyalanine expansions in human. Hum Mol Genet (suppl 2) 13: R235–R243 - PubMed
    1. Ananda G, Walsh E, Jacob KD, Krasilnikova M, Eckert KA, Chiaromonte F, Makova KD. 2013. Distinct mutational behaviors differentiate short tandem repeats from microsatellites in the human genome. Genome Biol Evol 5: 606–620 - PMC - PubMed
    1. Bachtrog D, Agis M, Imhof M, Schlötterer C. 2000. Microsatellite variability differs between dinucleotide repeat motifs—evidence from Drosophila melanogaster. Mol Biol Evol 17: 1277–1285 - PubMed
    1. Ballantyne KN, Goedbloed M, Fang R, Schaap O, Lao O, Wollstein A, Choi Y, van Duijn K, Vermeulen M, Brauer S, et al. . 2010. Mutability of Y-chromosomal microsatellites: rates, characteristics, molecular bases, and forensic implications. Am J Hum Genet 87: 341–353 - PMC - PubMed

Publication types