Review
. 2014 Sep;98(9):1144-67.
doi: 10.1136/bjophthalmol-2014-305702.

Guidelines for the management of neovascular age-related macular degeneration by the European Society of Retina Specialists (EURETINA)

Affiliations
Free PMC article
Review

Guidelines for the management of neovascular age-related macular degeneration by the European Society of Retina Specialists (EURETINA)

Ursula Schmidt-Erfurth et al. Br J Ophthalmol. 2014 Sep.
Free PMC article

Abstract

Age-related macular degeneration (AMD) is still referred to as the leading cause of severe and irreversible visual loss world-wide. The disease has a profound effect on quality of life of affected individuals and represents a major socioeconomic challenge for societies due to the exponential increase in life expectancy and environmental risks. Advances in medical research have identified vascular endothelial growth factor (VEGF) as an important pathophysiological player in neovascular AMD and intraocular inhibition of VEGF as one of the most efficient therapies in medicine. The wide introduction of anti-VEGF therapy has led to an overwhelming improvement in the prognosis of patients affected by neovascular AMD, allowing recovery and maintenance of visual function in the vast majority of patients. However, the therapeutic benefit is accompanied by significant economic investments, unresolved medicolegal debates about the use of off-label substances and overwhelming problems in large population management. The burden of disease has turned into a burden of care with a dissociation of scientific advances and real-world clinical performance. Simultaneously, ground-breaking innovations in diagnostic technologies, such as optical coherence tomography, allows unprecedented high-resolution visualisation of disease morphology and provides a promising horizon for early disease detection and efficient therapeutic follow-up. However, definite conclusions from morphologic parameters are still lacking, and valid biomarkers have yet to be identified to provide a practical base for disease management. The European Society of Retina Specialists offers expert guidance for diagnostic and therapeutic management of neovascular AMD supporting healthcare givers and doctors in providing the best state-of-the-art care to their patients.

Trial registration number: NCT01318941.

Keywords: Retina.


Figures

Figure 1
Figure 1
Classic choroidal neovascularisation is located above, the retinal pigment epithelium layer and is associated with intraretinal cystoid spaces and/or subretinal fluid. Due to its subretinal location, the neovascular net is delineated with distinct margins. Leakage in late-phase angiography confirms the biologic activity of the lesion (ophthalmoscopy, spectral domain-optical coherence tomography, early fluorescein angiography (FA), late FA).
Figure 2
Figure 2
Occult choroidal neovascularisation is located underneath the retinal pigment epithelium layer. By fluorescein angiography (FA), an area of stippled, or pinpoint hyperfluorescence with leakage in late phases, are seen. Indocyanine green angiography (ICGA) (right lower image) may visualise the neovascular pattern of the occult lesion (ophthalmoscopy, early FA, late FA, ICGA).
Figure 3
Figure 3
A retinal angiomatous proliferation is characterised by an early hyperfluorescent spot at the level of the retinal vasculature, mostly at the site of a focal haemorrhage and progressive intraretinal leakage. The concomitant optical coherence tomography scan reveals a pigment epithelium detachment and intraretinal cystoid expansions.
Figure 4
Figure 4
Marked intraretinal exudates and/or haemorrhage seen clinically are associated with multiple hyperfluorescent polyps angiographically in polypoidal chorioidopathy. Indocyanine green angiography (ICGA) is often helpful in delineating the polypoidal components despite haemorrhage (ophthalmoscopy, early fluorescein angiography (FA), ICGA, late FA).
Figure 5
Figure 5
Spectral domain-optical coherence tomography (SD-OCT) reveals a fibrovascular pigment epithelial detachment and a serous retinal detachment in a patient with age-related macular degeneration affected by a type 1 choroidal neovascularisation (scanning laser ophthalmoscopy, SD-OCT).
Figure 6
Figure 6
Fluorescein angiography (FA) and spectral domain-optical coherence tomography (SD-OCT) identify a minimally classic choroidal neovascularisation with the classic component in the nasal portion of the macular area and the occult component in the temporal area (FA, SD-OCT).
Figure 7
Figure 7
Spectral domain-optical coherence tomography (SD-OCT) features of type 2 (classic) choroidal neovascularisation (CNV) associated with exudative age-related macular degeneration are shown: fluorescein angiography (FA) visualises a small type 2 neovascular membrane. On SD-OCT, CNV appears between the retina and the retinal pigment epithelium, associated with some exudative cystoid spaces and increased central retinal thickness. (FA, SD-OCT).
Figure 8
Figure 8
In retinal angiomatous proliferation, fluorescein angiography (FA) shows a hot-spot in the macular area. On spectral domain-optical coherence tomography (SD-OCT), a focal pigment epithelial detachment and intraretinal cystoid spaces are the pathognomonic features. (FA, SD-OCT).
Figure 9
Figure 9
Spectral domain-optical coherence tomography (SD-OCT) features of polypoidal choroidopathy are shown: Indocyanine green angiography (ICGA) identifies a hyperfluorescent polypoidal lesion. A punctuate haemorrhage associated with the hot-spot on angiography suggests a retinal angiomatous proliferation. SD-OCT shows a dome-shaped elevation, the sign of a polypoidal lesion. (ICGA, scanning laser ophthalmoscopy, SD-OCT).
Figure 10
Figure 10
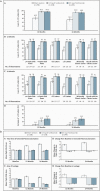
MARINA study. (A) Rate of loss or gain of visual acuity at 12 and 24 months associated with ranibizumab, as compared with sham injection. At 12 months, mean increases in visual acuity were +6.5 letters in the 0.3 mg group and +7.2 letters in the 0.5 mg group, as compared with a decrease of –10.4 letters in the sham-injection group (p<0.001 for both comparisons). The benefit in visual acuity was maintained at 24 months. The average benefit associated with ranibizumab over that of sham injection was approximately 17 letters in each dose group at 12 months, and 20–21 letters at 24 months. (B) Mean (±SE) changes in choroidal neovascularisation and leakage. The mean change from baseline in each of the ranibizumab-treated groups differed significantly from that in the sham-injection group at 12 and 24 months (p<0.001 for each comparison) in favour of ranibizumab treatment. Printed with permission from ref 13.
Figure 11
Figure 11
ANCHOR study. Mean (±SE) changes in the number of letters read as a measure of visual acuity from baseline through 12 months. The tracking of mean changes in visual acuity scores over time showed that the values in each of the ranibizumab groups were significantly superior to those in the verteporfin group at each month during the first year (p<0.001) (figure 2) On average, visual acuity of ranibizumab-treated patients increased by +5.9 letters in the 0.3 mg group and +8.4 letters in the 0.5 mg group at 1 month after the first treatment and increased further over time to a gain of +8.5 letters in the 0.3 mg group and +11.3 letters in the 0.5 mg group by 12 months. By contrast, the verteporfin group had an average loss in visual acuity at each month after the first month, with a mean loss of 9.5 letters by 12 months. Printed with permission from ref 13.
Figure 12
Figure 12
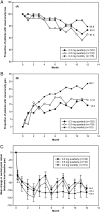
EXCITE study. (A, B) Proportion of patients with (A) visual acuity loss (<15 letters) or (B) gain (≥15 letters) over time in the intent-to-treat patient population (last observation carried forward (LOCF)) of EXCITE. Best-corrected visual acuity (BCVA) increased from baseline to month 12 by +4.9, +3.8, and +8.3 letters in the 0.3 mg quarterly (104 patients), 0.5 mg quarterly (88 patients), and 0.3 mg monthly (101 patients) dosing groups, respectively. After three initial monthly ranibizumab injections, monthly (0.3 mg) and quarterly (0.3 mg/0.5 mg) ranibizumab treatments maintained BCVA in patients with choroidal neovascularisation secondary to age-related macular degeneration. At month 12, BCVA gain in the monthly regimen was higher than that of the quarterly regimens. The non-inferiority of a quarterly regimen was not achieved with reference to 5.0 letters. (C) Mean change from baseline over time of central retinal thickness as assessed by optical coherence tomography scan in the intent-to-treat patient population ( LOCF) of EXCITE. Vertical bars represent SE of the mean. The mean decrease in central retinal thickness from baseline to month 12 in the intention-to-treat population was −96.0 µm in 0.3 mg quarterly, −105.6 µm in 0.5 mg quarterly, and −105.3 µm in 0.3 mg monthly group. Printed with permission from ref 50.
Figure 13
Figure 13
HARBOR study. (A) Mean change from baseline to month 12 in best-corrected visual acuity (BCVA). *Vertical bars are ±1 SE of the unadjusted mean. Mean number of injections was analysed for patients who received at least 1 ranibizumab injection in the study eye. At month 12, the mean change from baseline in BCVA for the four groups was +10.1 letters (0.5 mg monthly), +8.2 letters (0.5 mg pro-re-nata (PRN)), +9.2 letters (2.0 mg monthly), and +8.6 letters (2.0 mg PRN). The proportion of patients who gained ≥15 letters from baseline at month 12 in the 4 groups was 34.5%, 30.2%, 36.1% and 33.0%, respectively. The mean number of injections was 7.7 and 6.9 for the 0.5 mg PRN and 2.0 mg PRN groups, respectively. (B) Mean change from baseline to month 12 in central foveal thickness (CFT) by spectral-domain optical coherence tomography. Vertical bars are ±1 SE of the unadjusted mean. The mean change from baseline in CFT at month 12 in the 4 groups was −172, −161.2, −163.3, and −172.4 μm, respectively. Printed with permission from ref 55.
Figure 14
Figure 14
CATT study. (A) The mean change in visual acuity from enrolment over time in patients treated with the same dosing regimen for 2 years. While ranibizumab monthly, becacizumab monthly and ranibizumab as needed meet the non-inferiority level, treatment with bevacizumab as needed led to inconclusive results and non-inferiority was not proven. At 2 years, the mean increase in letters in visual acuity from baseline was +8.8 in the ranibizumab monthly group, +7.8 in the bevacizumab monthly group, +6.7 in the ranibizumab as-needed group and +5.0 in the bevacizumab as-needed group. Main gain was greater for monthly than for as-needed treatment. Switching from monthly to as-needed treatment resulted in greater mean decrease in vision during year 2 with −2.2 letters. (B) Differences in mean change in visual acuity at 2 years and 95% CIs in patients treated with the same dosing regimen for 2 years. The difference in mean improvements for patients treated with bevacizumab relative to those treated with ranibizumab was −1.4 letters. The difference in mean improvements for patients treated by an as-needed regimen relative to those treated monthly was −2.4 letters. (C) The mean change in total foveal thickness from enrolment over time by dosing regimen within drug group: (A) ranibizumab and (B) bevacizumab. Mean gain was greater for monthly than for as-needed treatment. The proportion without fluid ranged from 13.9% in the bevacizumab as-needed group to 45.5% in the ranibizumab monthly group. Printed with permission from ref 54.
Figure 15
Figure 15
IVAN study. Mean differences in best corrected distance visual acuity at 2 years by drug (top) and by regimen (bottom). Black dashed line shows non-inferiority limit of −3.5 letters. Mean differences estimated with data from visits 0, 3, 6, 9, 12, 15, 18, 21, and 24, adjusted for centre size. For best-corrected visual acuity, bevacizumab was neither non-inferior nor inferior to ranibizumab (mean difference −1.37 letters, 95% CI −3.75 to 1.01; p=0.26). Discontinuous treatment was neither non-inferior nor inferior to continuous treatment (−1.63 letters, −4.01 to 0.75; p=0.18). Printed with permission from ref 93.
Figure 16
Figure 16
VIEW studies. (A) Mean change from baseline in best-corrected visual acuity (BCVA). The inset shows the difference in least square mean (with 95% CI) between intravitreal aflibercept arms and ranibizumab (aflibercept minus ranibizumab) for BCVA change from baseline to week 96, full analysis set. Outcomes for the aflibercept and ranibizumab groups were similar at weeks 52 and 96. Mean BCVA gains were 8.3–9.3 letters at week 52 and 6.6–7.9 letters at week 96. Patients received, on average, 16.5, 16.0, 16.2 and 11.2 injections over 96 weeks and 4.7, 4.1, 4.6 and 4.2 injections during weeks 52 through 96 in the Rq4, 2q4, 0.5q4, and 2q8 groups, respectively. All aflibercept and ranibizumab groups were equally effective in improving BCVA and preventing BCVA loss at 96 weeks. (B) Mean change from baseline central retinal thickness, full analysis set. Bimonthly fluctuations in central retinal thickness (CRT) are seen during the fixed regimen in year 1 in the 2q8 arm. During the second year with a capped pro-re-nata regimen, variations in CRT become larger with a quarterly fluctuation pattern. Printed with permission from ref 111.

References

    1. Smith W, Assink J, Klein R, et al. Risk factors for age-related macular degeneration: pooled findings from three continents. Ophthalmology 2001;108:697–704 - PubMed
    1. Kawasaki R, Yasuda M, Song SJ, et al. The prevalence of age-related macular degeneration in Asians: a systematic review and meta-analysis. Ophthalmology 2010;117:921–7 - PubMed
    1. Friedman DS, O'Colmain BJ, Munoz B, et al. Prevalence of age-related macular degeneration in the United States. Arch Ophthalmol 2004;122:564–72 - PubMed
    1. Seddon JM, Willett WC, Speizer FE, et al. A prospective study of cigarette smoking and age-related macular degeneration in women. JAMA 1996;276: 1141–6 - PubMed
    1. Seddon JM, Cote J, Davis N, et al. Progression of age-related macular degeneration: association with body mass index, waist circumference, and waist-hip ratio. Arch Ophthalmol 2003;121:785–92 - PubMed

MeSH terms

Substances

Associated data