. 2014 Sep 2;111(35):E3596-603.
doi: 10.1073/pnas.1402875111. Epub 2014 Aug 18.

Adaptive, convergent origins of the pygmy phenotype in African rainforest hunter-gatherers

Affiliations

Adaptive, convergent origins of the pygmy phenotype in African rainforest hunter-gatherers

George H Perry et al. Proc Natl Acad Sci U S A. .

Abstract

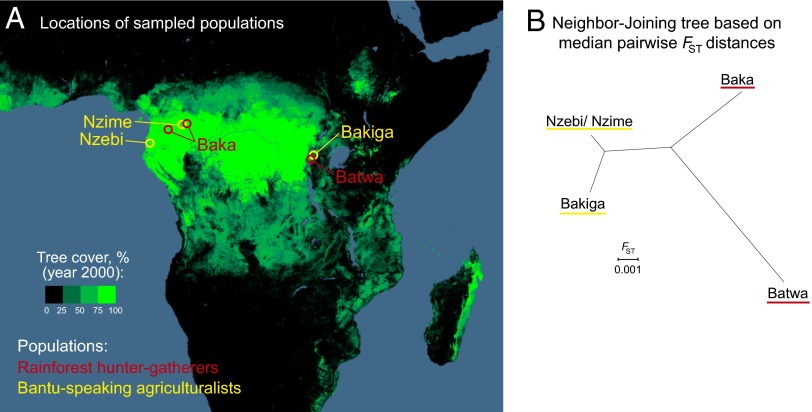
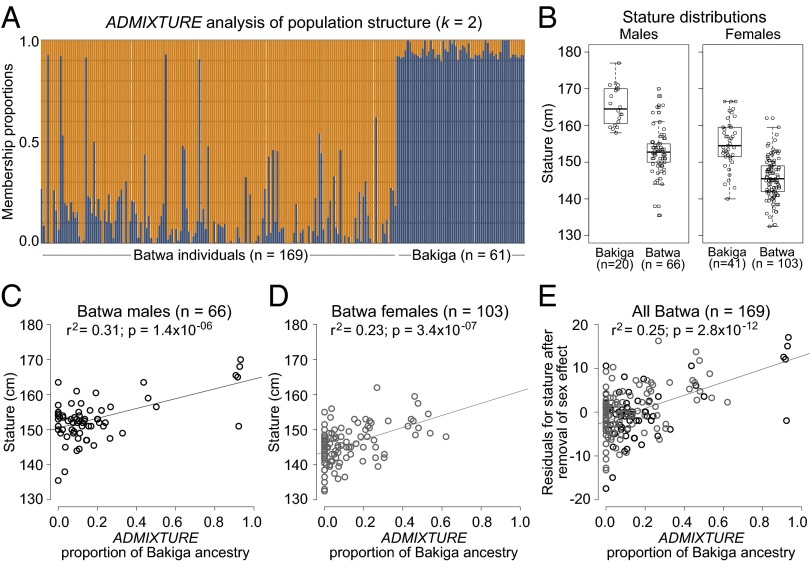
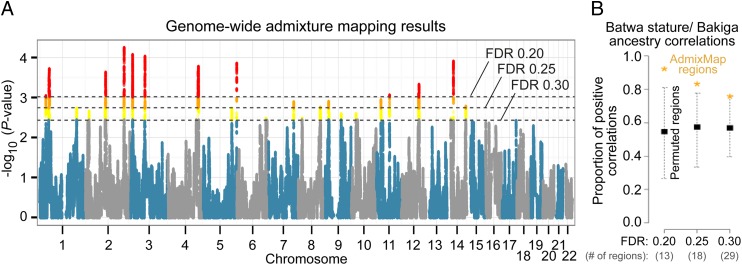
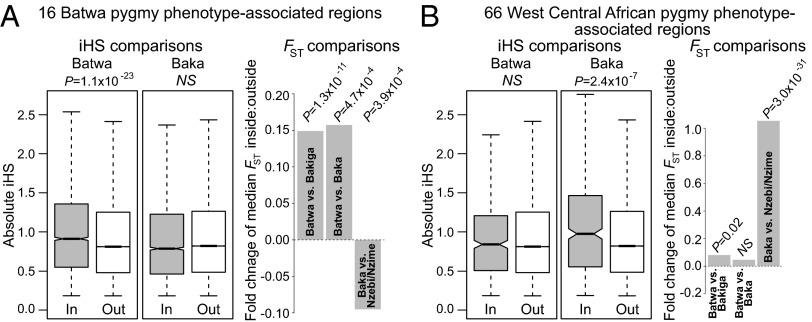
The evolutionary history of the human pygmy phenotype (small body size), a characteristic of African and Southeast Asian rainforest hunter-gatherers, is largely unknown. Here we use a genome-wide admixture mapping analysis to identify 16 genomic regions that are significantly associated with the pygmy phenotype in the Batwa, a rainforest hunter-gatherer population from Uganda (east central Africa). The identified genomic regions have multiple attributes that provide supporting evidence of genuine association with the pygmy phenotype, including enrichments for SNPs previously associated with stature variation in Europeans and for genes with growth hormone receptor and regulation functions. To test adaptive evolutionary hypotheses, we computed the haplotype-based integrated haplotype score (iHS) statistic and the level of population differentiation (FST) between the Batwa and their agricultural neighbors, the Bakiga, for each genomic SNP. Both |iHS| and FST values were significantly higher for SNPs within the Batwa pygmy phenotype-associated regions than the remainder of the genome, a signature of polygenic adaptation. In contrast, when we expanded our analysis to include Baka rainforest hunter-gatherers from Cameroon and Gabon (west central Africa) and Nzebi and Nzime neighboring agriculturalists, we did not observe elevated |iHS| or FST values in these genomic regions. Together, these results suggest adaptive and at least partially convergent origins of the pygmy phenotype even within Africa, supporting the hypothesis that small body size confers a selective advantage for tropical rainforest hunter-gatherers but raising questions about the antiquity of this behavior.

Keywords: convergent evolution; human evolutionary ecology; human hunter-gatherers; population genomics.


Conflict of interest statement

The authors declare no conflict of interest.

Figures

Fig. 1.
Fig. 1.
Rainforest hunter-gatherer and agriculturalist study populations. (A) Sampling locations for the east central and west central African rainforest hunter-gatherer and Bantu-speaking agriculturalist populations included in the study. The tree cover map is based on Landsat data and modified from visualization tools provided by Hansen et al. (67). (B) Neighbor-joining tree based on the median FST value for genome-wide autosomal SNPs. The Batwa and Baka population samples for this analysis excluded individuals with >10% Bakiga and Nzebi/Nzime ancestry, respectively, as estimated with ADMIXTURE (10). Pairwise median FST values: Batwa-Baka = 0.0135; Batwa-Bakiga = 0.0140; Batwa-Nzebi/Nzime = 0.0137; Baka-Bakiga = 0.0105; Baka-Nzebi/Nzime = 0.0086; Bakiga-Nzebi/Nzime = 0.0033.
Fig. 2.
Fig. 2.
Batwa and Bakiga admixture and stature. (A) Population structure analysis based on autosomal SNPs. Each individual is represented as a vertical line, with population origins indicated below the lines. Cluster membership proportions are depicted in orange (inferred proportion of Batwa ancestry) and blue (inferred proportion of Bakiga ancestry). (B) Boxplots of Batwa and Bakiga male and female stature estimates. (C–E) Relationships between Bakiga ancestry and stature for (C) Batwa males, (D) Batwa females, and (E) all Batwa individuals after regressing out the sex effect from the stature estimate.
Fig. 3.
Fig. 3.
Batwa pygmy phenotype-associated genomic regions. (A) Manhattan plot of results for admixture mapping analysis of Batwa stature. SNPs passing the genome-wide level of significance at FDR = 0.30 (29 genomic regions), FDR = 0.25 (18 regions), and FDR 0.20 (13 regions) are highlighted in yellow, orange, and red, respectively. (B) Proportion of positive correlations between Batwa stature (corrected for genome-wide Bakiga ancestry) and local level of Bakiga ancestry for pygmy phenotype-associated regions identified by the admixture mapping analysis at the three FDR cutoffs. Observed results are indicated by orange asterisks; the proportions of positive correlations are 0.92, 0.83, and 0.76 for FDR = 0.20, 0.25, and 0.30, respectively. Black squares and dashed lines indicate mean and 95% CI results, respectively, from a permutation analysis in which admixture mapping was performed 100 times after permuting the stature estimates among individuals. Genomic regions significantly associated with stature in each permutation (always fewer than observed in the original data analysis) were stored and ultimately pooled across all of the permutations (separately for each of the three FDR cutoffs). From these pools, we drew 100 random samples of significant regions for each cutoff to match the observed number of significant regions from the original analysis and computed the proportion of regions from each random sample with positive statureancestry correlations. The proportion of observed regions with positive statureancestry correlations is significantly greater than expected based on the permutation results for the two most stringent FDR cutoffs (P < 0.01, P = 0.01, and P = 0.07 for FDR = 0.20, 0.25, and 0.30, respectively).
Fig. 4.
Fig. 4.
Cross-population analysis of selection signatures for pygmy phenotype-associated genomic regions. (A) Boxplot and fold-change comparisons of |iHS| and median FST values for SNPs located inside (In) vs. outside (Out) the 16 Batwa pygmy phenotype-associated regions identified by admixture mapping and supported by GEMMA (21). P values were computed with Wilcoxon tests. Fold-change = (median In − median Out)/median In. (B) Similar comparisons of |iHS| and median FST values for SNPs located inside versus outside 66 genomic regions previously reported to be associated with stature variation among west central African rainforest hunter-gatherers (6, 29). The Batwa are east central African rainforest hunter-gatherers and the Baka are west central African rainforest hunter-gatherers. The Bakiga and Nzebi/Nzime, respectively, are their Bantu-speaking agricultural neighbors.

References

    1. Perry GH, Dominy NJ. Evolution of the human pygmy phenotype. Trends Ecol Evol. 2009;24(4):218–225. - PubMed
    1. Migliano AB, et al. Evolution of the pygmy phenotype: Evidence of positive selection fro genome-wide scans in African, Asian, and Melanesian pygmies. Hum Biol. 2013;85(1-3):251–284. - PubMed
    1. López Herráez D, et al. Genetic variation and recent positive selection in worldwide human populations: Evidence from nearly 1 million SNPs. PLoS ONE. 2009;4(11):e7888. - PMC - PubMed
    1. Cavalli-Sforza LL. African pygmies: An evaluation of the state of research. In: Cavalli-Sforza LL, editor. African Pygmies. Orlando, FL: Academic Press; 1986. pp. 361–426.
    1. Diamond JM. Anthropology. Why are pygmies small? Nature. 1991;354(6349):111–112. - PubMed

Publication types