. 2014 Sep 2;111(35):12913-8.
doi: 10.1073/pnas.1404109111. Epub 2014 Aug 18.

Optogenetic neuronal stimulation promotes functional recovery after stroke

Affiliations

Optogenetic neuronal stimulation promotes functional recovery after stroke

Michelle Y Cheng et al. Proc Natl Acad Sci U S A. .

Abstract

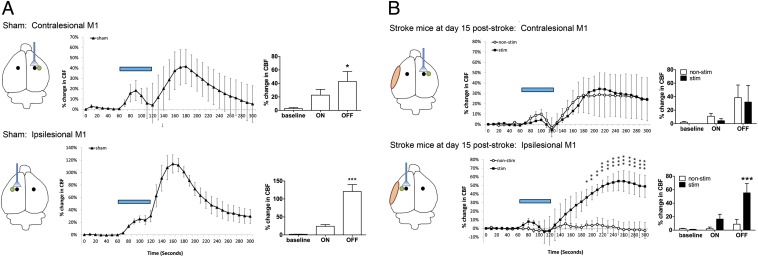
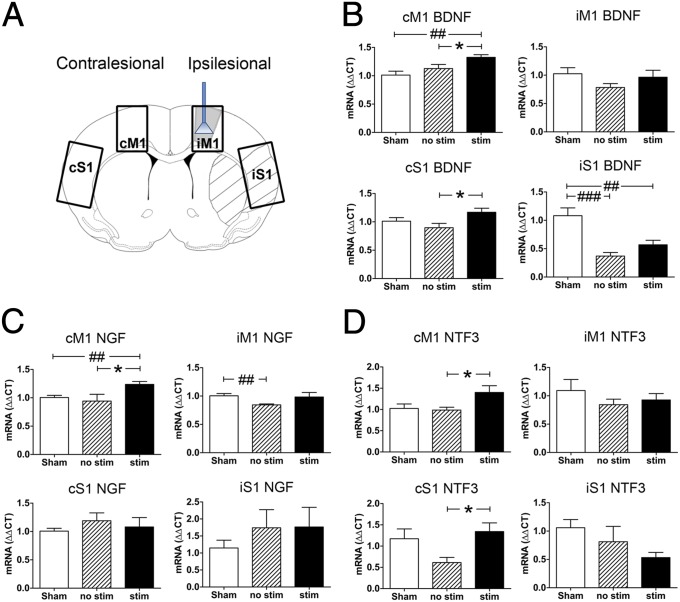
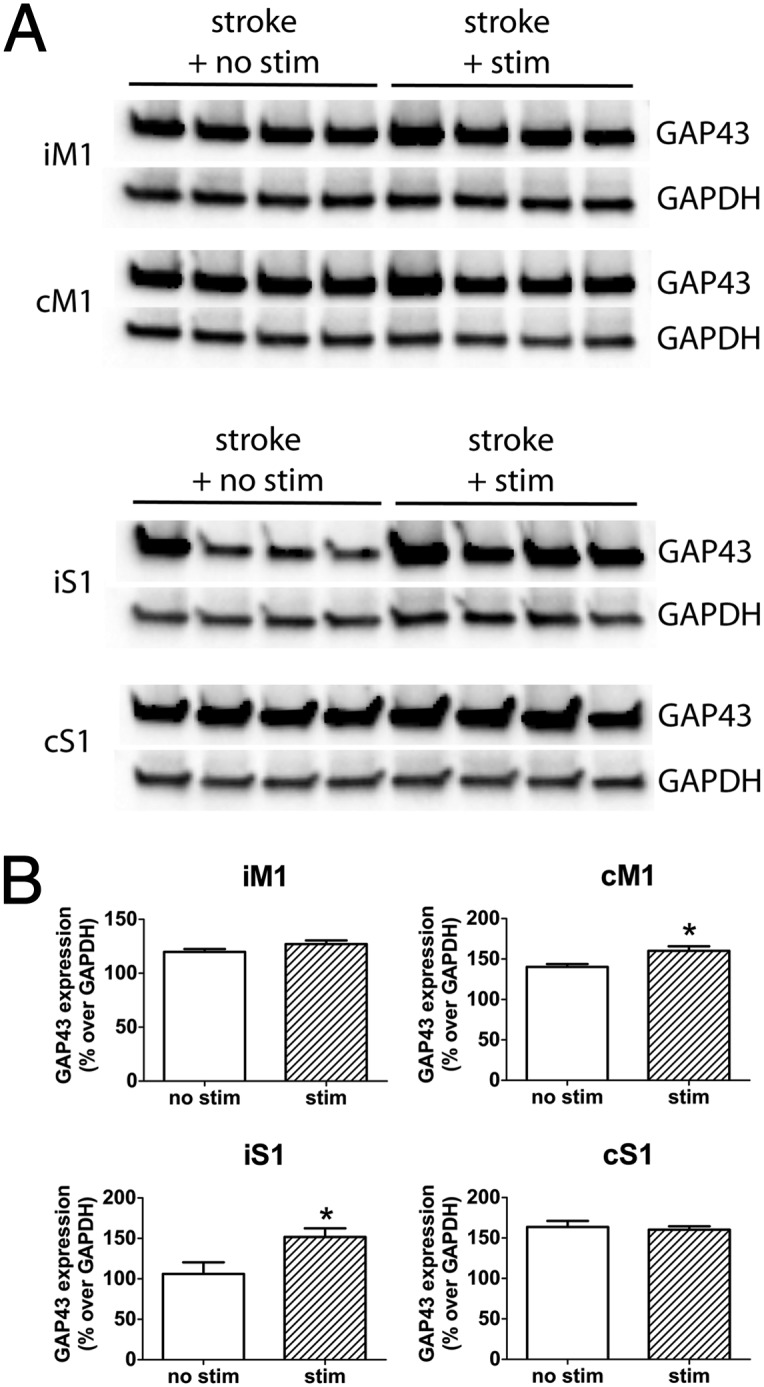
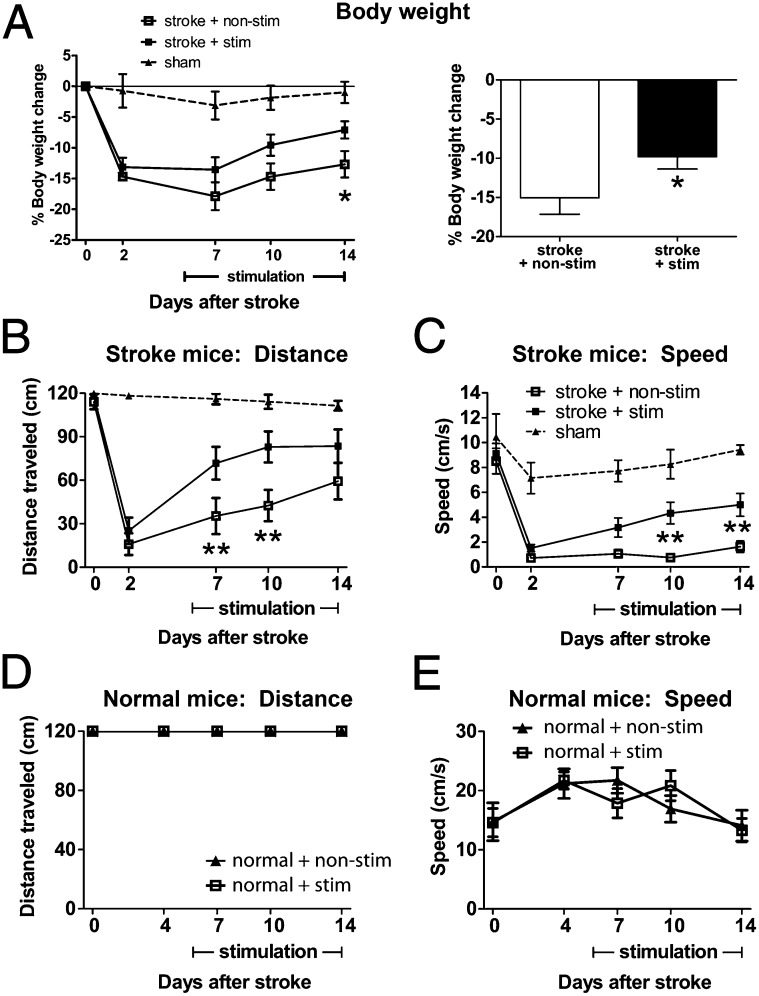
Clinical and research efforts have focused on promoting functional recovery after stroke. Brain stimulation strategies are particularly promising because they allow direct manipulation of the target area's excitability. However, elucidating the cell type and mechanisms mediating recovery has been difficult because existing stimulation techniques nonspecifically target all cell types near the stimulated site. To circumvent these barriers, we used optogenetics to selectively activate neurons that express channelrhodopsin 2 and demonstrated that selective neuronal stimulations in the ipsilesional primary motor cortex (iM1) can promote functional recovery. Stroke mice that received repeated neuronal stimulations exhibited significant improvement in cerebral blood flow and the neurovascular coupling response, as well as increased expression of activity-dependent neurotrophins in the contralesional cortex, including brain-derived neurotrophic factor, nerve growth factor, and neurotrophin 3. Western analysis also indicated that stimulated mice exhibited a significant increase in the expression of a plasticity marker growth-associated protein 43. Moreover, iM1 neuronal stimulations promoted functional recovery, as stimulated stroke mice showed faster weight gain and performed significantly better in sensory-motor behavior tests. Interestingly, stimulations in normal nonstroke mice did not alter motor behavior or neurotrophin expression, suggesting that the prorecovery effect of selective neuronal stimulations is dependent on the poststroke environment. These results demonstrate that stimulation of neurons in the stroke hemisphere is sufficient to promote recovery.

Keywords: channelrhodopsin; stroke recovery.


Conflict of interest statement

The authors declare no conflict of interest.

Figures

Fig. 1.
Fig. 1.
iM1 neuronal stimulation activates peri-infarct areas and contralesional cortex. (A) High expression of Thy-1–ChR2–YFP in layer V pyramidal neurons of M1. (Scale bar, 100 µm.) (B, Upper) Stimulation paradigm with three successive 1-min laser stimulations (blue bars) separated by 3-min rest intervals. (Lower) Representative optrode tracing of neuronal firings that result from the application of this paradigm to iM1. (C) Enlarged image of a stimulation interval in the optrode tracing of B, showing individual spiking from the light pulses (red bracket). (DF, Left) Ischemic regions (striped) and implantation sites in M1. An optrode (blue) with a recording electrode (black) is placed in iM1 and a second recording electrode (brown) is placed in iS1 (D), iStr (E), or cM1 (F). (Center) Representative optrode tracings for dual simultaneous recordings. (Right) Enlarged images of individual spikes. iM1 stimulation resulted in activation of the ischemic iS1 and iStr, as well as cM1.
Fig. 2.
Fig. 2.
Experimental design and time line. (A) Mice were handled and pretrained on several motor-sensory behavior tests before collecting baseline. Preimplant baseline was collected 1 d before fiber optic cannula implant surgery. Prestroke baseline was collected 1 d before stroke surgery (30-min suture model). Optogenetic neuronal stimulation began at poststroke day 5. Stimulation continued until poststroke day 14 (6 d/wk). Behavior tests were performed on days 2, 7, 10, and 14. On poststroke day 15, one group of mice was placed under anesthesia for CBF measurements and sacrificed that day. Another group was sacrificed for qPCR studies or histology. At poststroke day 5, another group was used for CBF measurement and sacrificed that day (indicated by dotted line). These mice were not used for behavior studies, as indicated by dotted line. (B) Chart of the five experimental groups used for CBF, qPCR, and behavior studies and the types of surgery for each group.
Fig. 3.
Fig. 3.
Repeated iM1 neuronal stimulations improved CBF and the neurovascular coupling response after stroke. Changes in CBF in response to a 1-min stimulation (blue bars) on either cM1 or iM1 were measured in (A) sham mice and (B) stimulated and nonstimulated stroke mice at poststroke day 15. (Left) Illustration of the stimulation site (indicated by fiber), the ischemic area (orange) and the CBF measurement site (green). (Center) Time lapse recordings of percentage change in CBF, consisting of three periods: baseline (1 min), laser-on stimulation (1 min), and a laser off (3 min). (Right) Peak percentage CBF change in each period. (A) Sham mice exhibited a similar neurovascular coupling response in both hemispheres, with an increased CBF during the laser-on period and a larger CBF response after laser was turned off. *P < 0.05, ***P < 0.001; one-way ANOVA with Dunnet's post hoc test. n = 4–6 per group. (B) At poststroke day 15, both stimulated and nonstimulated stroke mice exhibited a similar neurovascular coupling response in the cM1, but only the stimulated stroke mice exhibited significant improvement of the neurovascular coupling response in the iM1. *P < 0.05, **P < 0.01, ***P < 0.001; two-way ANOVA with Bonferroni’s post hoc test. n = 4–6 per group.
Fig. 4.
Fig. 4.
Repeated iM1 neuronal stimulations increased the expression of neurotrophins after stroke. (A) Neurotrophin mRNA expression in brains of stimulated and nonstimulated stroke mice and sham mice sacrificed on day 15. Diagram illustrates the stimulation site, infarct regions, and iM1, cM1, iS1, and cS1 dissected. qPCR was used to examine the expression of neurotrophins. (B) BDNF was significantly lower in stimulated and nonstimulated stroke mice in iS1, compared with sham. Stimulated stroke mice exhibited significantly higher BDNF expression than nonstimulated stroke mice in cM1 and cS1. Stimulated mice also exhibited significantly higher BDNF than sham mice in cM1 (#P < 0.05). (C) NGF and (D) NTF3 expression were also higher in cM1, and NTF3 was higher in cS1 for stimulated vs. nonstimulated mice. *P < 0.05, significant difference between stimulated and nonstimulated stroke mice, one-way ANOVA with Fisher's LSD. ##P < 0.01, ###P < 0.001; significant difference from sham mice, one-way ANOVA with Fisher's LSD test. n = 6–9 per group.
Fig. 5.
Fig. 5.
iM1 neuronal stimulations increased GAP43 expression. (A) Western blot of GAP43 and GAPDH expression in iM1, cM1, iS1, and cS1 of nonstimulated and stimulated stroke mice (poststroke day 15). (B) Relative optical density measurements of GAP43 expression expressed as percentage over GAPDH. Stimulated mice exhibit significantly higher GAP43 expression in cM1 and iS1. n = 4 per group. *P < 0.05; significant difference between stim and nonstim group, Student t test.
Fig. 6.
Fig. 6.
iM1 neuronal stimulations improved functional recovery. (A) Stimulated stroke mice regained their body weight significantly faster than nonstimulated stroke mice at poststroke day 14. (Left) Time course of body weight changes. (Right) Average of percent body weight change during the stimulation period (*P < 0.05, Student t test). Stimulated mice performed significantly better in the rotating beam test, with a longer distance traveled (B) and a faster speed (C). *P < 0.05, **P < 0.01, significant difference between stim and nonstim group, two-way ANOVA repeated measures with Fisher's LSD. Sham, n = 8; nonstim, n = 16; stim, n = 21. Stimulation has no effect on distance traveled (D) or speed (E) in normal mice. n = 6 per group.

References

    1. Sharma N, Cohen LG. Recovery of motor function after stroke. Dev Psychobiol. 2012;54(3):254–262. - PMC - PubMed
    1. Ward NS. Mechanisms underlying recovery of motor function after stroke. Postgrad Med J. 2005;81(958):510–514. - PMC - PubMed
    1. Carmichael ST. Plasticity of cortical projections after stroke. Neuroscientist. 2003;9(1):64–75. - PubMed
    1. Murphy TH, Corbett D. Plasticity during stroke recovery: From synapse to behaviour. Nat Rev Neurosci. 2009;10(12):861–872. - PubMed
    1. Nudo RJ. Postinfarct cortical plasticity and behavioral recovery. Stroke. 2007;38(2) Suppl:840–845. - PubMed

Publication types

MeSH terms

LinkOut - more resources