. 2014 Sep 2;111(35):E3631-40.
doi: 10.1073/pnas.1402449111. Epub 2014 Aug 18.

Loss of Miro1-directed mitochondrial movement results in a novel murine model for neuron disease

Affiliations

Loss of Miro1-directed mitochondrial movement results in a novel murine model for neuron disease

Tammy T Nguyen et al. Proc Natl Acad Sci U S A. .

Abstract

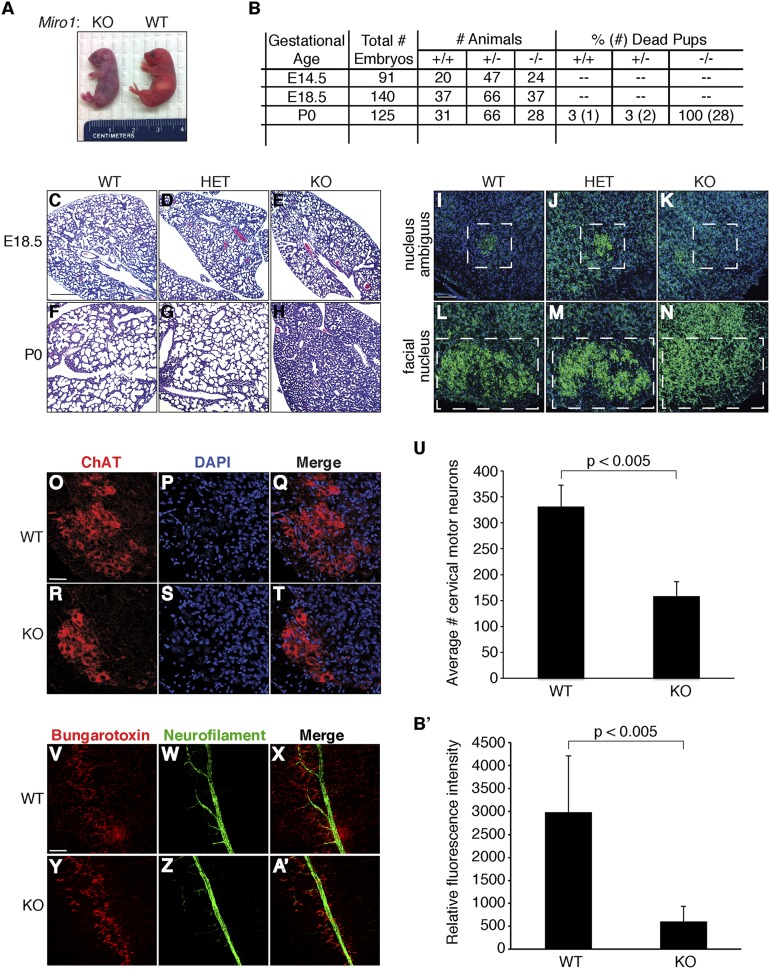
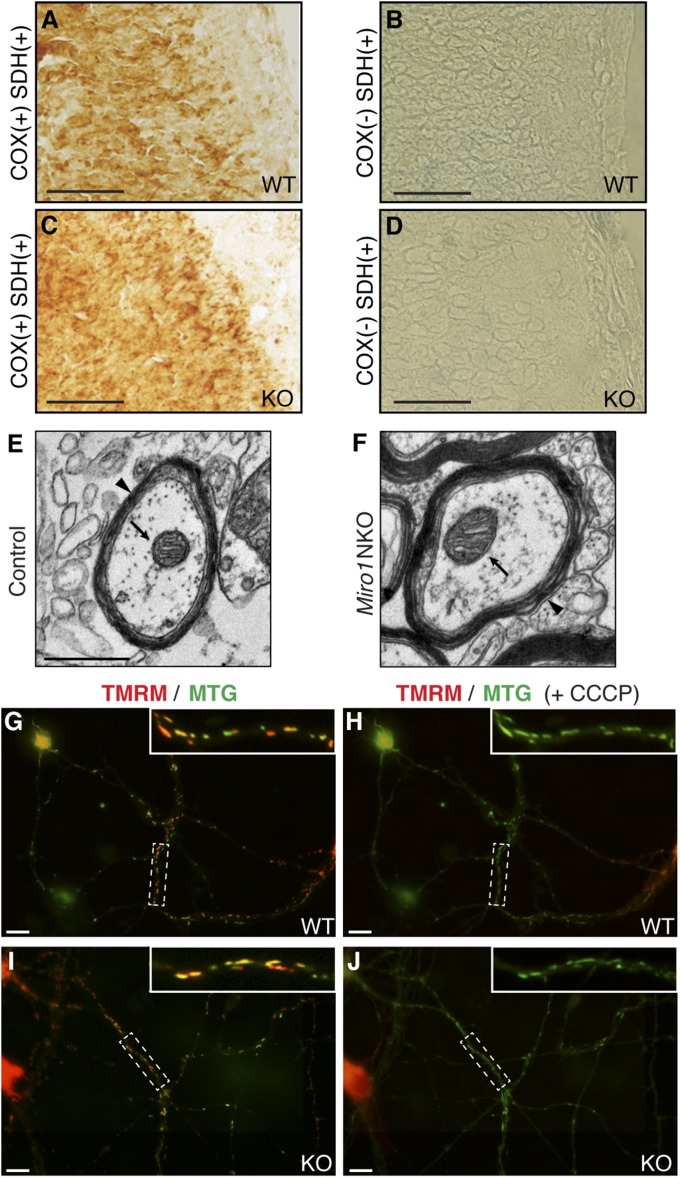
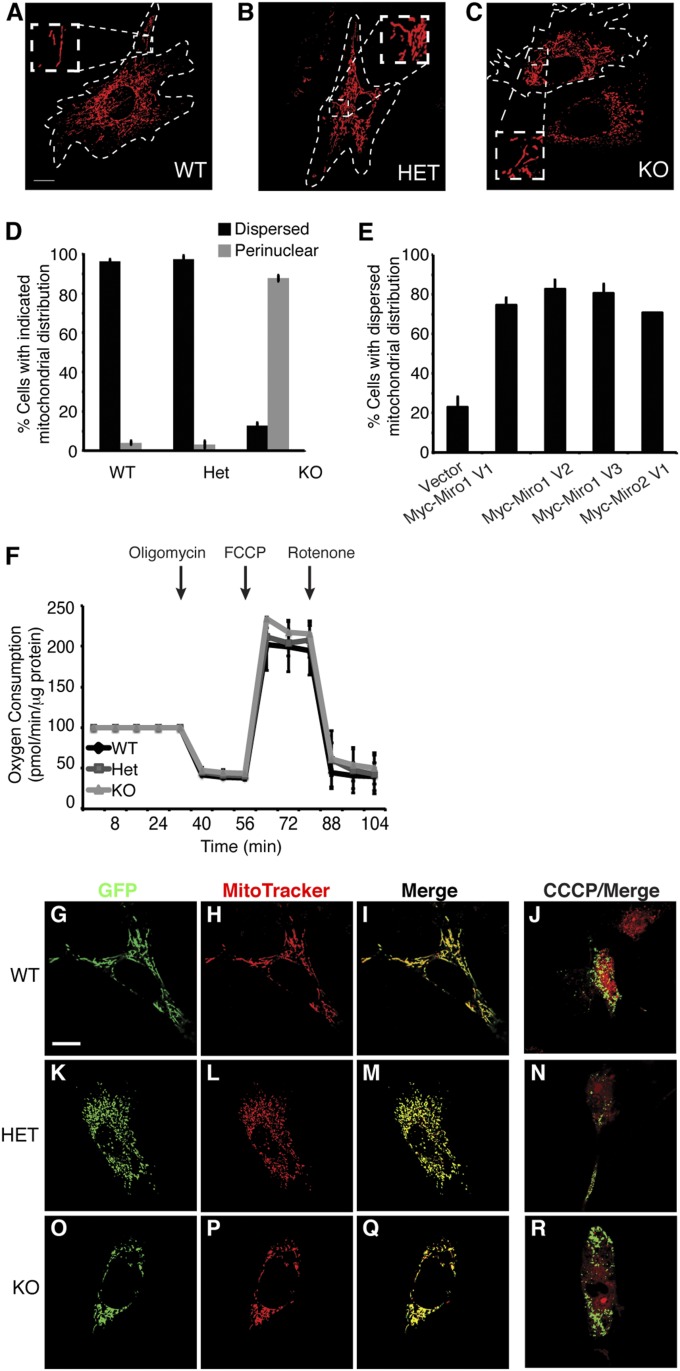
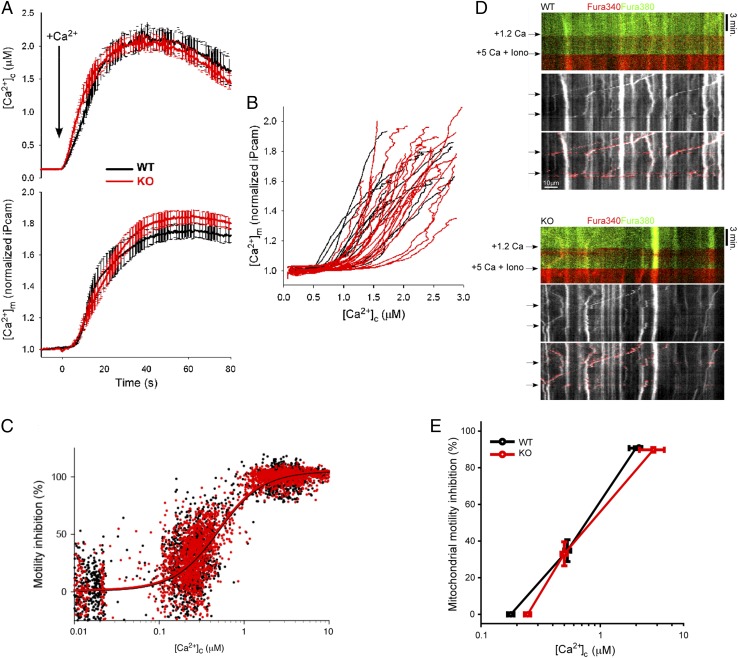
Defective mitochondrial distribution in neurons is proposed to cause ATP depletion and calcium-buffering deficiencies that compromise cell function. However, it is unclear whether aberrant mitochondrial motility and distribution alone are sufficient to cause neurological disease. Calcium-binding mitochondrial Rho (Miro) GTPases attach mitochondria to motor proteins for anterograde and retrograde transport in neurons. Using two new KO mouse models, we demonstrate that Miro1 is essential for development of cranial motor nuclei required for respiratory control and maintenance of upper motor neurons required for ambulation. Neuron-specific loss of Miro1 causes depletion of mitochondria from corticospinal tract axons and progressive neurological deficits mirroring human upper motor neuron disease. Although Miro1-deficient neurons exhibit defects in retrograde axonal mitochondrial transport, mitochondrial respiratory function continues. Moreover, Miro1 is not essential for calcium-mediated inhibition of mitochondrial movement or mitochondrial calcium buffering. Our findings indicate that defects in mitochondrial motility and distribution are sufficient to cause neurological disease.

Keywords: Ca2+-dependent motility; Miro GTPase; mitochondrial respiration.


Conflict of interest statement

The authors declare no conflict of interest.

Figures

Fig. 1.
Fig. 1.
Miro1 deletion causes postnatal lethality and loss of specific neurons required for respiration. (A) Newborn WT and KO P0 mice after birth. Birth occurs at ∼E19.5. The homozygous Miro1 KO is cyanotic. (B) Loss of Miro1 leads to postnatal lethality. (CH) P0 Miro1 KO mice fail to aerate lung tissue. H&E staining shows normal lung tissue in all genotypes before birth at E18.5 (CE), aerated lung tissue in WT and HET genotypes at P0 (F and G), but unexpanded lung tissue in the KO genotype at P0 (H). (Scale bar: 300 μm.) (IN) Loss of Miro1 disrupts cranial nuclei formation in the hindbrain. (IK) Nissl (green) and DAPI (blue) staining of the NA in the hindbrain of E18.5 animals. White dashed boxes mark the green NA region, which is present in the WT and HET genotypes but absent in the KO genotype. (LN) Nissl (green) and DAPI (blue) staining of the facial nucleus (FN). White dashed boxes mark the FN region, which has defined margins in the WT and HET genotypes but not in the KO genotype. (Scale bar: 100 μm.) (OT) Loss of Miro1 reduces the number of cervical motor neurons. Representative images of anti-choline acetyltransferase (ChAT) (red, motor neurons) and DAPI (blue, nuclei) labeling of cervical motor neurons in E18.5 WT (OQ) and KO (RT) animals. (Scale bar: 50 μm.) (U) Quantification of cervical motor neurons in WT (n = 4) and KO (n = 7) animals. Data are represented as mean ± SD. (VZ, and A′) Loss of Miro1 reduces phrenic nerve branching. Antibungarotoxin (red, neuromuscular junctions with diaphragm) and antineurofilament (green, phrenic nerve) labeling of floating preparations in E18.5 WT (VX) and KO (YA′) animals. (Scale bar: 100 μm.) (B′) Quantification of phrenic nerve branching in WT (n = 7) and KO (n = 6) animals. Data are represented as mean ± SD. (Also see Fig. S1.)
Fig. 2.
Fig. 2.
Miro1 NKO mice develop upper MND phenotypes. Images of open (A) and clasped (B) hind-limb reflex in P45 control and Miro1 NKO (Miro1F/− Eno2Cre/+) mice, respectively. (Scale bar: 10 mm.) Images of P45 control (C) and Miro1 NKO (D) animals. NKO mice exhibit kyphosis and have stiff tails and hind limbs. (E) Average weights of control (black) and Miro1 NKO (gray) mice at the indicated postnatal ages (n = 10). Data are represented as mean ± SD. (F) Average composite phenotype score for control (black) and Miro1 NKO (gray) mice at the indicated postnatal ages (n = 10). Data are represented as mean ± SD. (G) Kaplan–Meier survival curve for control (Miro1F/+ and Miro1F/; red and gray lines, respectively), Miro1 NKO (black line), and Miro1 MNKO (Miro1F/ Mnx1Cre/+; dashed blue line) mice (n = 10). Representative images of H&E-stained brainstem (H and I) and anterior horn lumbar spinal cord (J and K) of P30 littermate control (n = 6) and Miro1 NKO (n = 5) mice, respectively. Arrows mark eosinophilic Bunina-like bodies in Miro1 NKO mice that are not present in control mice. (Scale bar: 50 μm.) Representative images (magnification: 1,000×) of lumbar spinal cord cross-sections from P30 Miro1 control (L) and Miro1 NKO (M) mice. Red arrowheads mark mitochondrial profiles in axons. The red arrow marks an axon lacking mitochondrial profiles in Miro1 NKO. (Scale bar: 2 μm.) (N) Percentage of axons with mitochondrial profiles in control and Miro1 NKO lumbar spinal cord sections (n = 2,564 axons from four control animals and 4,602 axons from four Miro1 NKO animals). Data are represented as mean ± SD. (Also see Fig. S2 and Movies S1–S3.)
Fig. 3.
Fig. 3.
Miro1 is required for efficient retrograde axonal mitochondrial movement. (A and B) Representative images of GFP-labeled mitochondria in axons of primary cortical neurons. (Scale bar: 50 μm.) Representative kymographs of mitochondrial movement in axons of Miro1 WT (C) and KO (D) primary cortical neurons. The anterograde direction is indicated. (E) Average percentage of mobile mitochondria in Miro1 WT (n = 36) and KO (n = 65) axons (P = 0.162). (F) Average percentage of time moving mitochondria remain in motion in Miro1 WT (n = 229) and KO (n = 427) axons (***P < 0.0001). (G) Normalized average anterograde and retrograde trace velocities of Miro1 WT (black, n = 119 anterograde and n = 110 retrograde) and KO (gray, n = 220 anterograde and n = 207 retrograde) mitochondria (**P < 0.005). (H) Normalized average anterograde and retrograde trace run lengths of Miro1 WT (black, n = 119 anterograde and n = 110 retrograde) and KO (gray, n = 220 anterograde and n = 207 retrograde) mitochondria (***P < 0.0001). In EH, error bars are mean ± SEM. (Also see Fig. S3.)
Fig. 4.
Fig. 4.
Miro1 loss does not abolish mitochondrial bioenergetic function. COX/SDH activity histochemical double labeling of representative cryosections of cerebral cortex of E18.5 Miro1 WT (A and B, n = 3) and KO (C and D, n = 3) embryos. Brown staining reflects COX activity (A and C), and SDH activity results in blue staining (B and D) (controls treated with COX inhibitor). (Scale bars: 50 μm.) (Also see Fig. S4.) (E and F) Representative cross-sectional images of axons from the lumbar spinal cord of P30 Miro1 WT and NKO animals. Arrows mark cristae structure within mitochondrial profiles. Arrowheads mark myelin sheaths. (Scale bar: 0.5 μm.) Double labeling of primary cortical Miro1 WT (G and H) and KO (I and J) neurons with mitochondrial membrane potential-independent MitoTracker Green (MTG) and potential-dependent TMRM (red). Panels show the same field of view before (G and I) and 2 min after (H and J) treatment with 10 μM carbonyl cyanide m-chlorophenyl hydrazone (CCCP) (“+CCCP”). (GJ, Insets, Upper Right) Magnified views of the boxed area are displayed as Insets in GJ. (Scale bar: 10 μm. Magnification: 3×.)
Fig. 5.
Fig. 5.
Miro1 loss does not affect mitochondrial bioenergetic function in MEFs. (AC) Mitochondrial morphology and distribution in the indicated MEF genotypes were examined after staining with MitoTracker CM-H2XROS (red). Boxed areas are magnified to show mitochondrial morphology. (Scale bar: 10 μm.) (D) Quantification of dispersed (black bars) vs. perinuclear (gray bars) mitochondrial distribution in primary MEFs (n = 100). Error bars represent mean ± SD from three independent experiments. (E) Quantification of mitochondrial distribution in Miro1 KO MEFs overexpressing Myc-tagged Miro1 splice variants and Miro2 (n = 100). Error bars represent mean ± SD from three independent experiments. (F) Primary oxygen consumption capacity was examined in the Miro1 WT, HET, and KO MEFs after stressing mitochondrial respiration with the indicated drugs. Data are represented as mean ± SD. FCCP, carbonilcyanide p-triflouromethoxyphenylhydrazone. (GR) Mitochondrial membrane potential (∆Ψ) determined by comparing mitochondrial GFP-OMP25 (G, K, and O; potential-independent, green) and MitoTracker Red CM-H2XROS (H, L, and P; potential-dependent, red) labeling in merged images (I, M, and Q) using MEFs of the indicated genotypes. (Scale bar: 10 μm.) (J, N, and R) Merged images show lack of colocalization when mitochondrial respiratory activity (and MitoTracker Red CM-H2XROS accumulation) is dissipated by CCCP treatment. (Scale bar: 20 μm.) (Also see Fig. S5.)
Fig. 6.
Fig. 6.
Miro1 loss does not interfere with mitochondrial Ca2+ uptake or Ca2+-mediated inhibition of mitochondrial motility. (A) Graphs depict the average synchronized traces ± SEM of [Ca2+]c (Upper) and [Ca2+]m (Lower) in the indicated MEFs during store-operated calcium entry as determined by fura2 and inverse pericam (iPcam), respectively. Included in the means are all cells that showed maximum [Ca2+]c in the range of 1–3 μm (WT, n = 11; KO, n = 23). (B) [Ca2+]m as a function of [Ca2+]c during the rising phase of [Ca2+]c is shown for each cell included in the means. (C) Dose–response relationship between [Ca2+]c and motility inhibition in Miro1 WT (black; IC50: 498 ± 18 nM, n = 20) and KO (red; IC50: 492 ± 15 nM, n = 22). (D) Kymographs generated from single processes in WT or KO primary cortical neurons. Overlay of fura2 fluorescence at 340 nm (red) and 380 nm (green) excitation (Top), MitoTracker Green fluorescence (Middle, grayscale), and MitoTracker Green overlaid with calculated motility (Bottom, red). (Scale bar: 10 μm.) Iono, ionomycin. (E) Plot shows the mean ± SEM of [Ca2+]c and mitochondrial motility inhibition in cortical neurons at rest, after 1.2 mM CaCl2, and after 5 mM CaCl2 plus Iono. Data are derived from those processes where [Ca2+]c rose to the range of 0.3–1.0 μm after the addition of 1.2 mM CaCl2. (WT, n = 33 from three embryos; KO, n = 23 from five embryos). (Also see Fig. S6.)

References

    1. Perlson E, Maday S, Fu MM, Moughamian AJ, Holzbaur ELF. Retrograde axonal transport: Pathways to cell death? Trends Neurosci. 2010;33(7):335–344. - PMC - PubMed
    1. Sheng Z-H, Cai Q. Mitochondrial transport in neurons: Impact on synaptic homeostasis and neurodegeneration. Nat Rev Neurosci. 2012;13(2):77–93. - PMC - PubMed
    1. Shirendeb UP, et al. Mutant huntingtin’s interaction with mitochondrial protein Drp1 impairs mitochondrial biogenesis and causes defective axonal transport and synaptic degeneration in Huntington’s disease. Hum Mol Genet. 2012;21(2):406–420. - PMC - PubMed
    1. Sterky FH, Lee S, Wibom R, Olson L, Larsson N-G. Impaired mitochondrial transport and Parkin-independent degeneration of respiratory chain-deficient dopamine neurons in vivo. Proc Natl Acad Sci USA. 2011;108(31):12937–12942. - PMC - PubMed
    1. Wang X, Perry G, Smith MA, Zhu X. Amyloid-beta-derived diffusible ligands cause impaired axonal transport of mitochondria in neurons. Neurodegener Dis. 2010;7(1-3):56–59. - PMC - PubMed

Publication types

MeSH terms