. 2014 Aug 1:8:73.
doi: 10.3389/fnana.2014.00073. eCollection 2014.

Computational modeling of the effects of auditory nerve dysmyelination

Affiliations

Computational modeling of the effects of auditory nerve dysmyelination

Angus M Brown et al. Front Neuroanat. .

Abstract

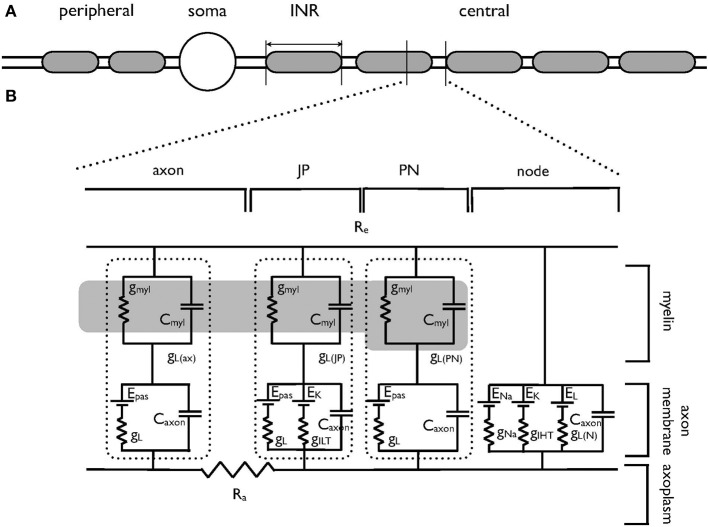
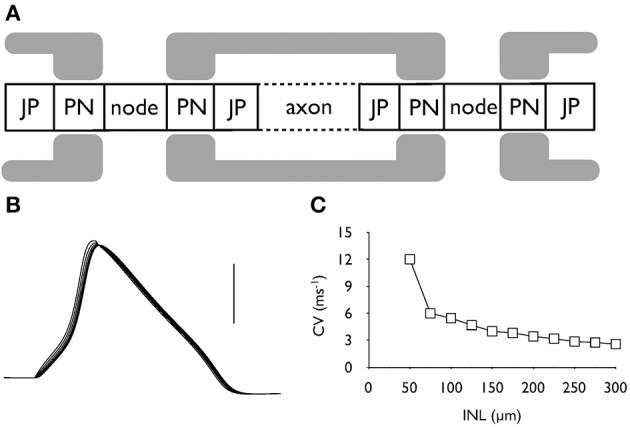
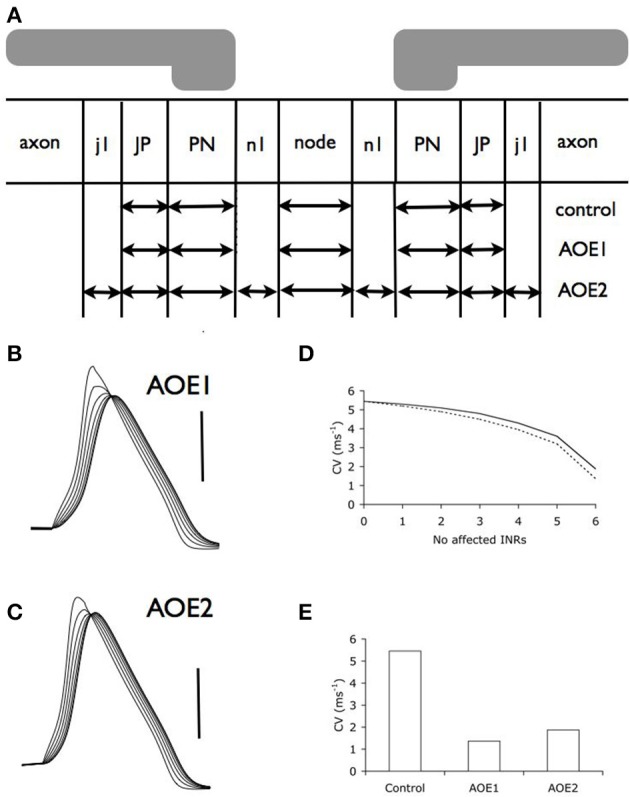
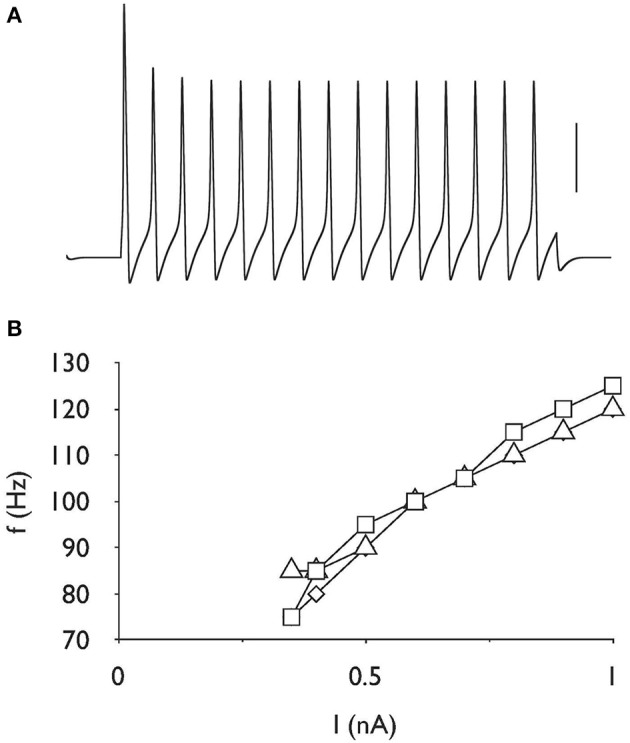
Our previous study showed that exposure to loud sound leading to hearing loss elongated the auditory nerve (AN) nodes of Ranvier and triggered notable morphological changes at paranodes and juxtaparanodes. Here we used computational modeling to examine how theoretical redistribution of voltage gated Na(+), Kv3.1, and Kv1.1 channels along the AN may be responsible for the alterations of conduction property following acoustic over-exposure. Our modeling study infers that changes related to Na(+) channel density (rather than the redistribution of voltage gated Na(+), Kv3.1, and Kv1.1 channels) is the likely cause of the decreased conduction velocity and the conduction block observed after acoustic overexposure (AOE).

Keywords: action potential; conduction block; conduction velocity; deafness; hearing loss; myelin domains; myelin sheath; node of Ranvier.


Figures

Figure 1
Figure 1
Schematic model of the auditory nerve. (A) The auditory nerve fiber is divided into three distinct regions. The peripheral axonal region terminates in the organ of Corti. The soma resides in the spiral ganglion. The central axon projects to the cochlear nucleus, is myelinated with internodal myelinated regions modeled as 100 μm in length. (B) Equivalent circuit of the central portion of the auditory nerve, which has been adapted from an existing model of corpus callosum axon (Tagoe et al., 2014). The morphological and electrical values are contained in Tables 1, 2 respectively. The axon is divided into the nodal region and the internodal region. The internodal region is subdivided into the paranodal (PN) juxtaparanodal (JP) and axonal regions (axon). The nodal region expresses the voltage-dependent conductances of the INa (gNa) and IHT (gIHT) currents as well as a leak current (gL). GiLT is expressed in the JP. The axolemma of the internodal regions expresses a leak current (gL), as does the overlying myelin (gmyl). The dotted lines enclose the leak and capacitative properties of each INR component. Internal resistance (Ra) is constant throughout the model and external resistance (Re) is zero. The dark region represents the myelin, and only one PN and JP abutting the node are shown for clarity. gmyl and Cmyl are the passive conductance and capacitance across the myelin, respectively. gL is the passive conductance, gL(N) refers to the passive conductance at the node, Epas is the reversal potential for the passive conductance (VL), and ENa and EK are the reversal potentials for the Na+ current and ILT and IHT respectively.
Figure 2
Figure 2
Action potential conduction along the central portion of the auditory nerve. (A) Schematic model of the axonal compartments in the control auditory nerve model. (B) Evoked action potentials recorded at six successive nodes illustrating action potential conduction along an axon. Scale bar is 50 mV and the duration of the recording is 2 ms. (C) The conduction velocity decreases as internodal length (INL) is increased from the control value of 100 μm.
Figure 3
Figure 3
Auditory overexposure decreases conduction velocity. (A) Schematic model of the central portion of the auditory nerve after AOE, illustrating the morphological changes incurred by the nerve. See Table 2 for dimensions of compartments. (B,C). Action potentials evoked from six successive nodes after AOE1 (B) or AOE2 (C) treatment demonstrated a decrease in the conduction velocity. Scale bars 50 mV in B and C and duration of recording is same as Figure 2B. (D) Incremental decrease in conduction velocity as more INRs are affected by AOE-induced dysmyelination in AOE1 (dotted line) and AOE2 (line) models. (E) Conduction velocity (with an INL of 100 μm) decreases as a result of both AOE1 and AOE2 (see Methods for details).
Figure 4
Figure 4
Firing rate is unchanged after AOE. (A) Action potentials evoked by a current of 0.35 nA for 200 ms, demonstrating the capacity for repetitive firing in the control model. Scale bar is 50 mV and the duration of the entire trace is 250 ms. (B) Stimulus intensity versus frequency response showing linear increase in firing frequency in response to increasing stimulus current up to 1 nA. There is little difference in the firing frequency properties for control (□), AOE 1 (◊) or AOE 2 (▵) treatment. Note y-axis starts at 70 Hz.
Figure 5
Figure 5
The effect of gNa on conduction velocity. (A) Decreasing the value of gNa relative to the control value as 100% resulted in a non-linear decrease in conduction velocity. (B) Nodal recordings of gL under control and AOE treated conditions. Scale bars 0.01 nA and 1 ms.

References

    1. Bakiri Y., Karadottir R., Cossell L., Attwell D. (2011). Morphological and electrical properties of oligodendrocytes in the white matter of the corpus callosum and cerebellum. J. Physiol. 589, 559–573 10.1113/jphysiol.2010.201376 - DOI - PMC - PubMed
    1. Brew H. M., Hallows J. L., Tempel B. L. (2003). Hyperexcitability and reduced low threshold potassium currents in auditory neurons of mice lacking the channel subunit Kv1.1. J. Physiol. 548, 1–20 10.1113/jphysiol.2002.035568 - DOI - PMC - PubMed
    1. Carnevale N. T., Hones M. L. (2006). The NEURON Book. Cambridge: Cambridge University Press; 10.1017/CBO9780511541612 - DOI
    1. Craner M. J., Newcombe J., Black J. A., Hartle C., Cuzner M. L., Waxman S. G. (2004). Molecular changes in neurons in multiple sclerosis: altered axonal expression of Nav1.2 and Nav1.6 sodium channels and Na+/Ca2+ exchanger. Proc. Natl. Acad. Sci. U.S.A. 101, 8168–8173 10.1073/pnas.0402765101 - DOI - PMC - PubMed
    1. Devaux J., Alcaraz G., Grinspan J., Bennett V., Joho R., Crest M., et al. (2003). Kv3.1b is a novel component of CNS nodes. J. Neurosci. 23, 4509–4518 - PMC - PubMed

LinkOut - more resources