. 2014:2014:893516.
doi: 10.1155/2014/893516. Epub 2014 Jul 17.

Anandamide protects HT22 cells exposed to hydrogen peroxide by inhibiting CB1 receptor-mediated type 2 NADPH oxidase

Affiliations

Anandamide protects HT22 cells exposed to hydrogen peroxide by inhibiting CB1 receptor-mediated type 2 NADPH oxidase

Ji Jia et al. Oxid Med Cell Longev. 2014.

Abstract

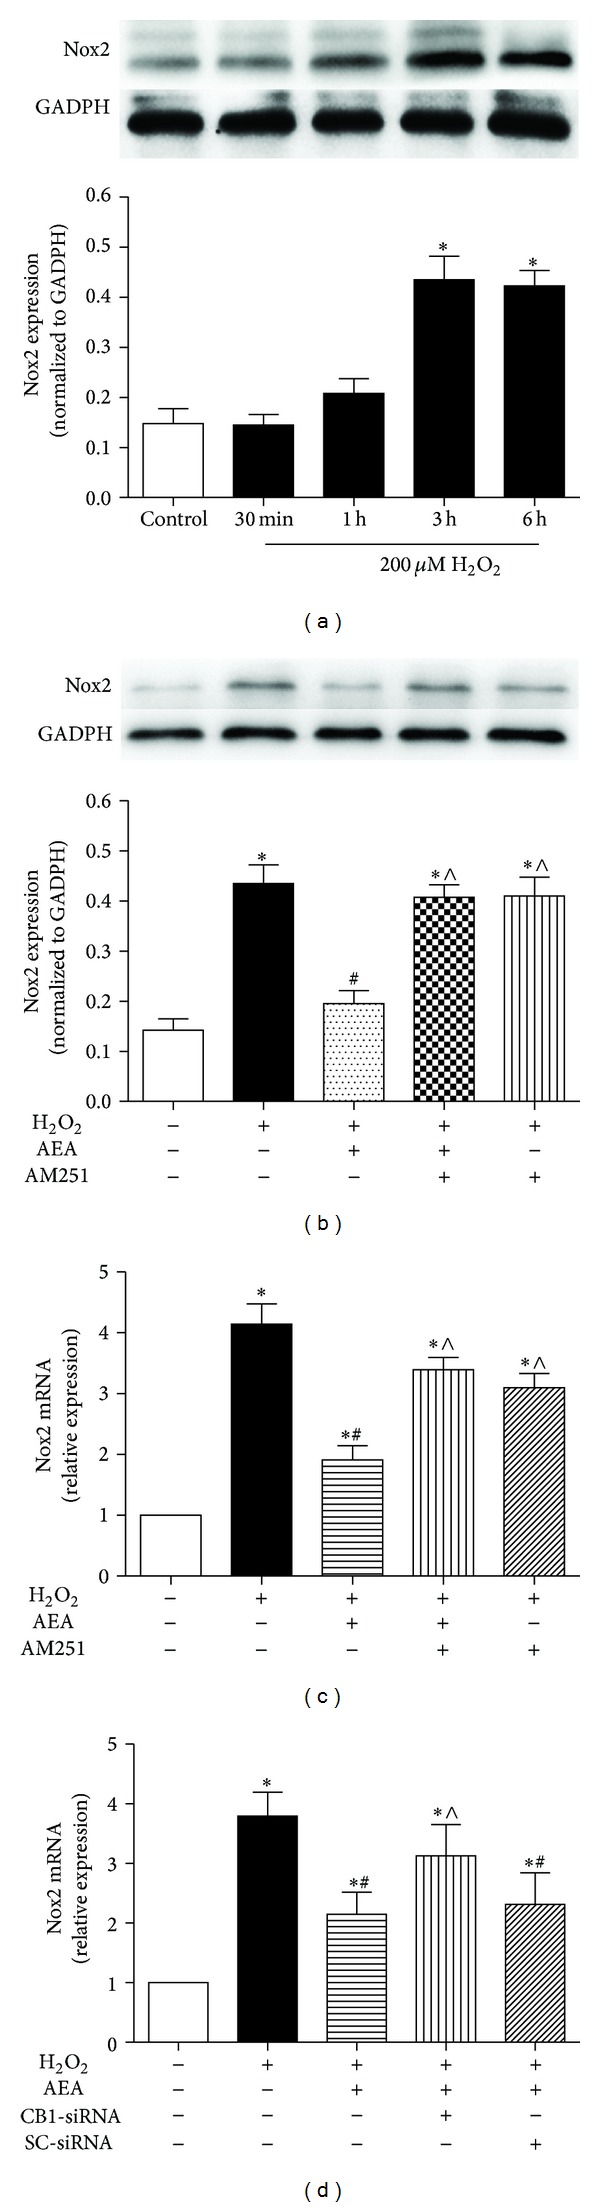
Background: Endogenous cannabinoid anandamide (AEA) protects neurons from oxidative injury in rodent models; however the mechanism of AEA-induced neuroprotection remains to be determined. Activation of neuronal NADPH oxidase 2 (Nox2) contributes to oxidative damage of the brain, and inhibition of Nox2 can attenuate cerebral oxidative stress. We aimed to determine whether the neuronal Nox2 was involved in protection mediated by AEA.

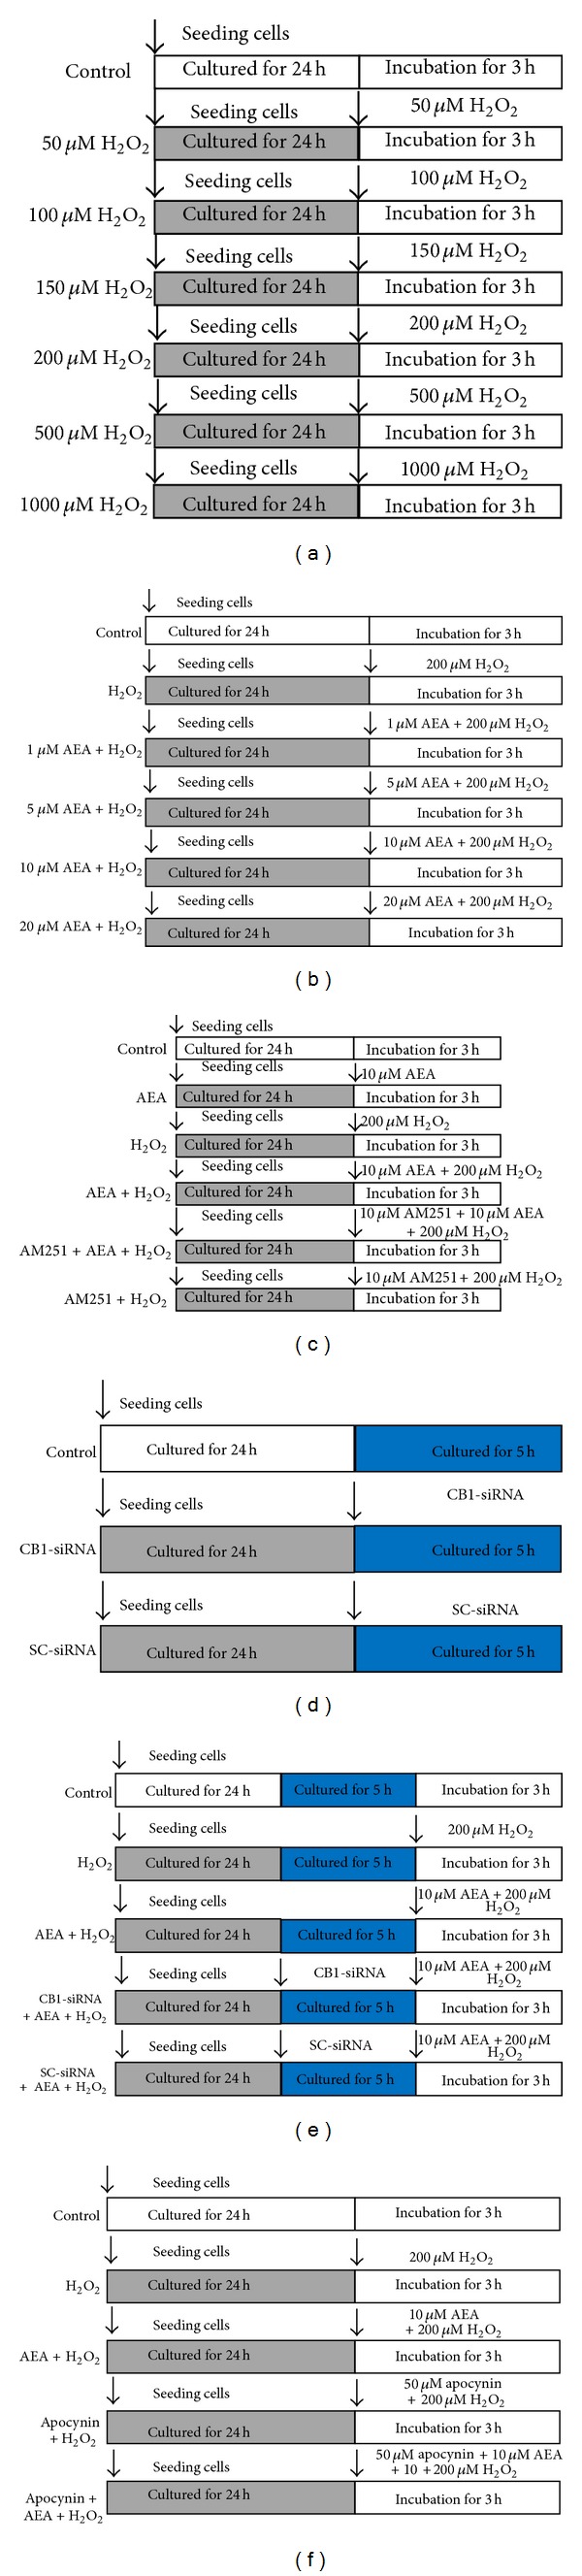
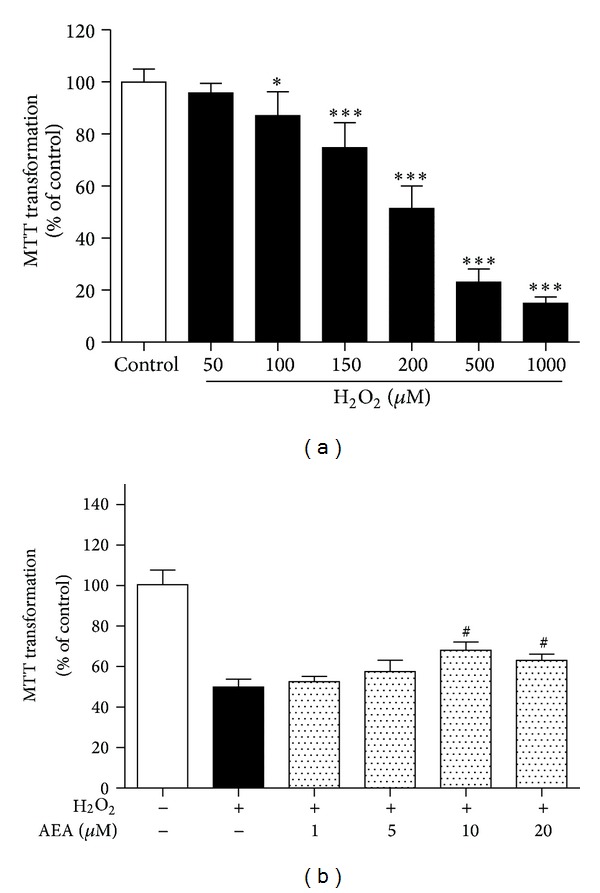
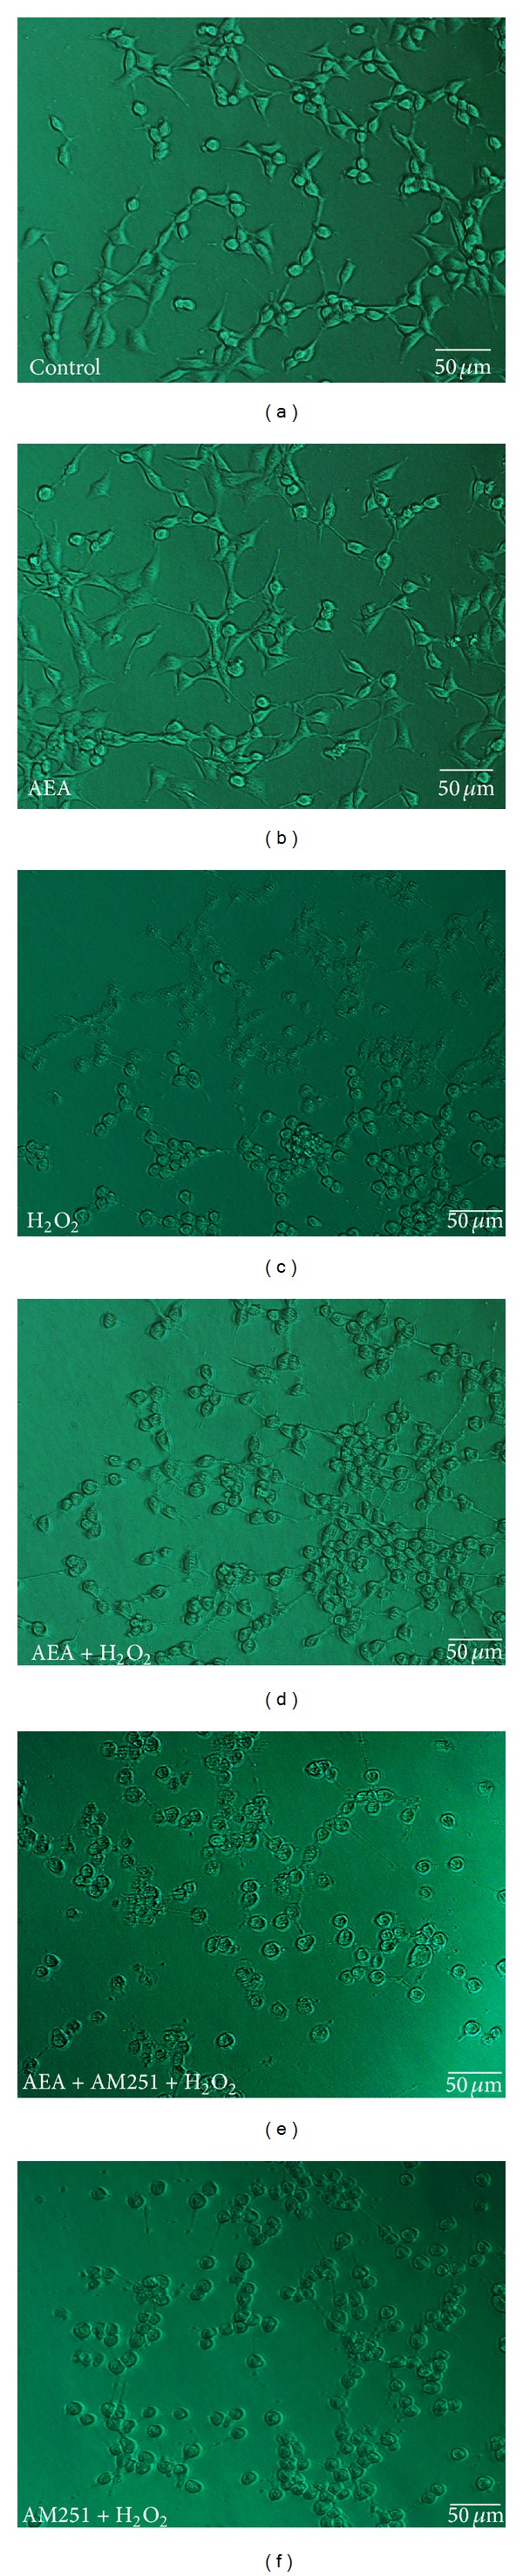
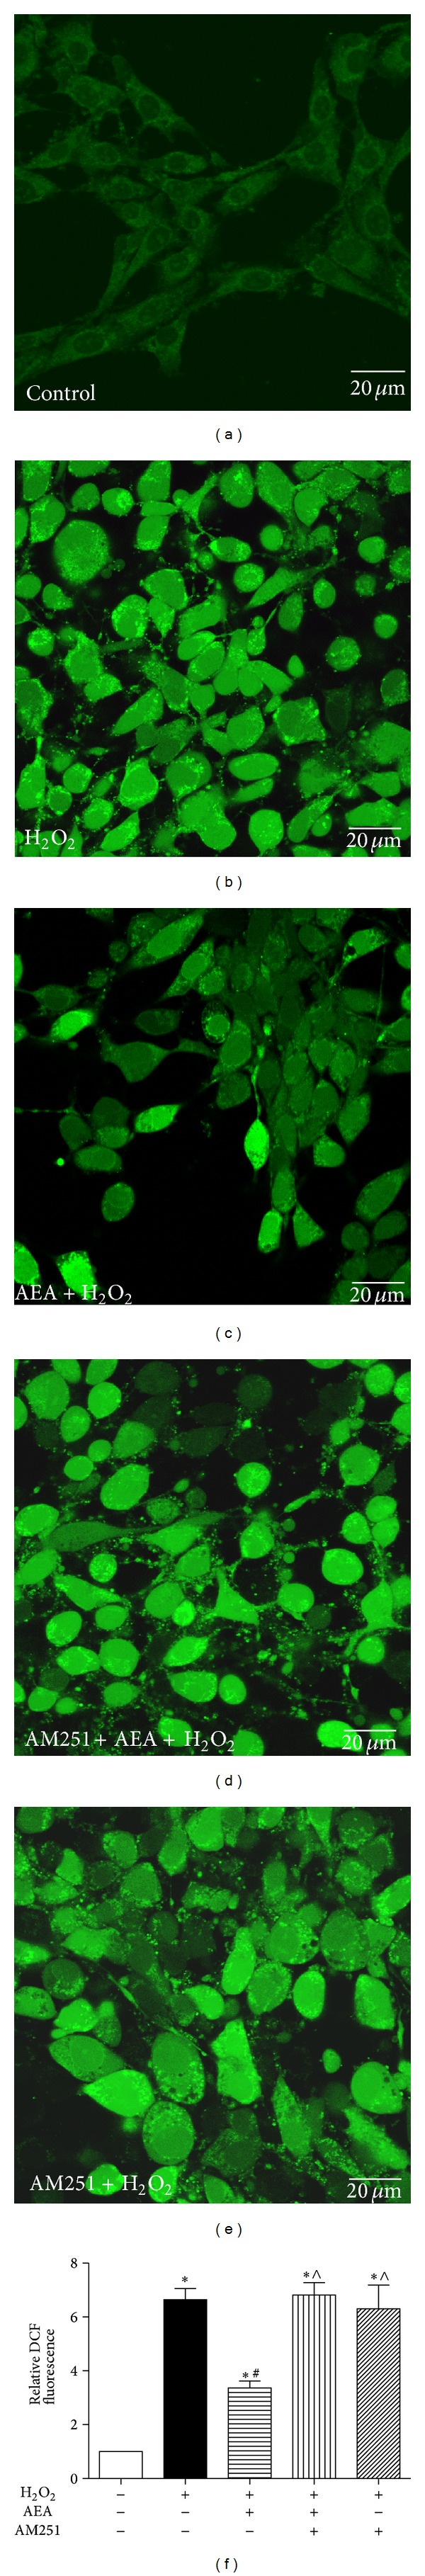
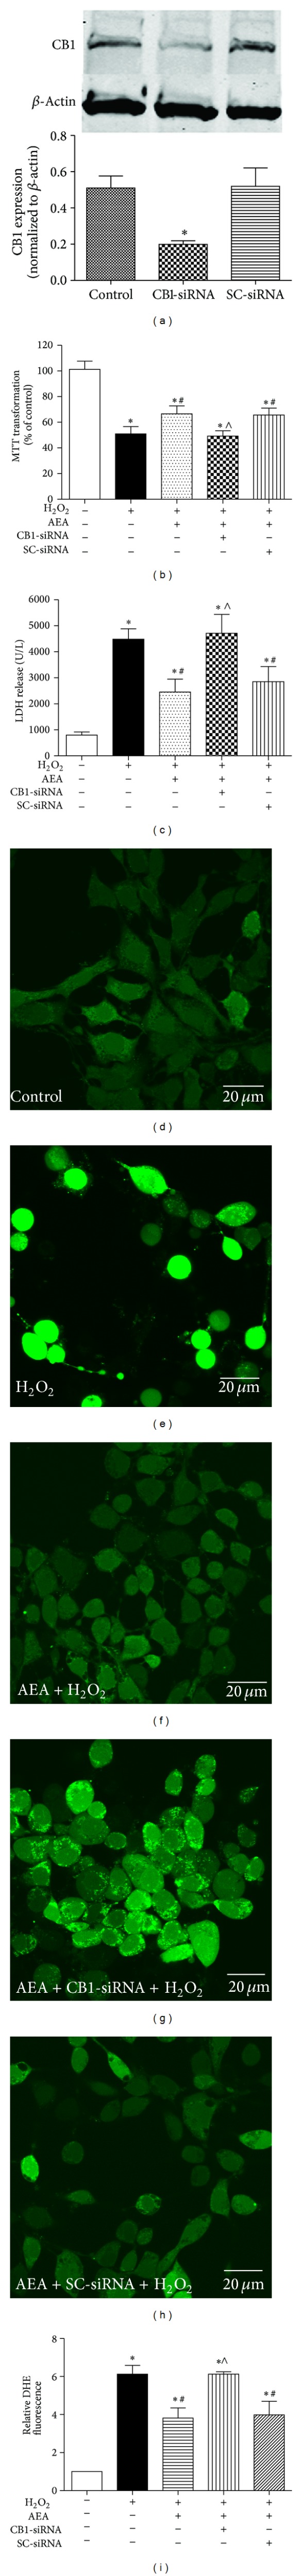
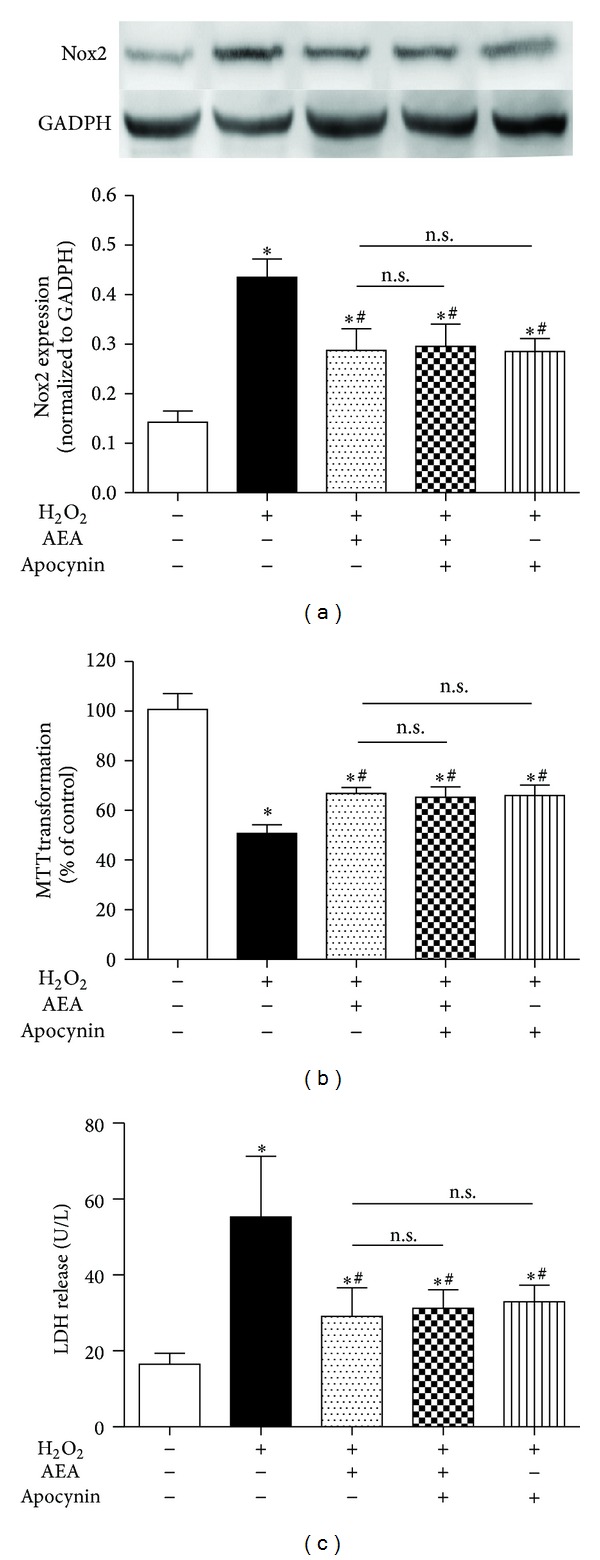
Methods: The mouse hippocampal neuron cell line HT22 was exposed to hydrogen peroxide (H2O2) to mimic oxidative injury of neurons. The protective effect of AEA was assessed by measuring cell metabolic activity, apoptosis, lactate dehydrogenase (LDH) release, cellular morphology, intracellular reactive oxygen species (ROS), and antioxidant and oxidant levels and Nox2 expression.

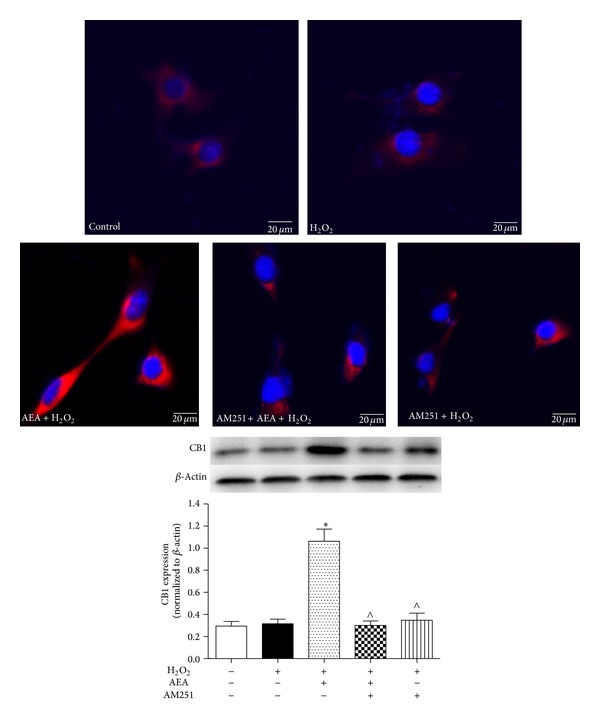
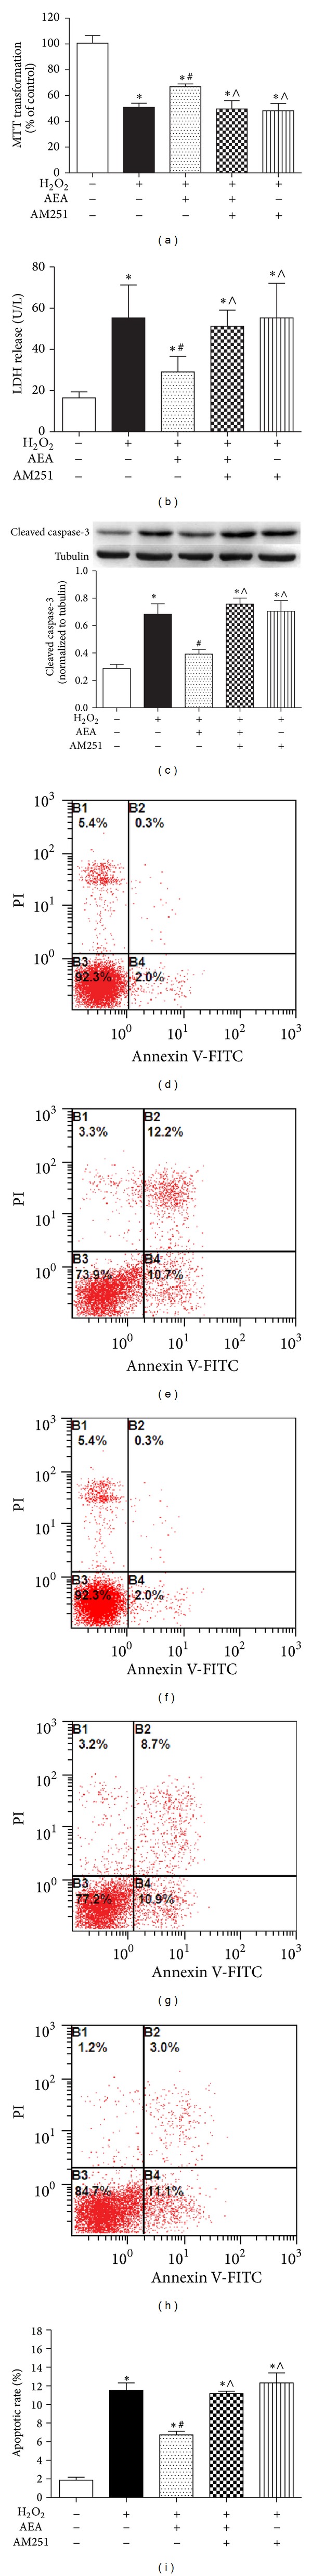
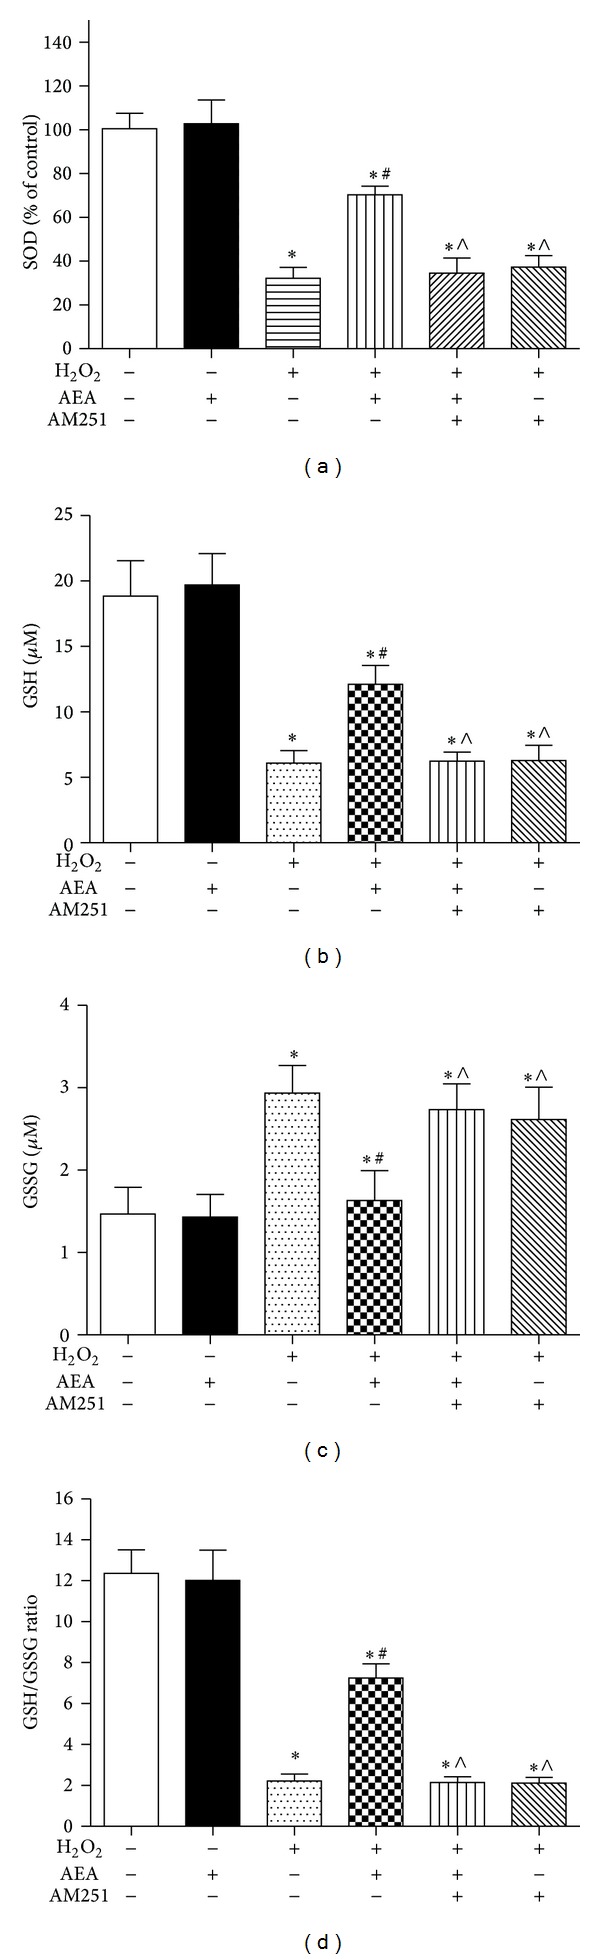
Results: HT22 cells exposed to H2O2 demonstrated morphological changes, decreased LDH release, reduced metabolic activity, increased levels of intracellular ROS and oxidized glutathione (GSSG), reduced levels of superoxide dismutase (SOD), and reduced glutathione (GSH) and increased expression of Nox2. AEA prevented these effects, a property abolished by simultaneous administration of CB1 antagonist AM251 or CB1-siRNA.

Conclusion: Nox2 inhibition is involved in AEA-induced cytoprotection against oxidative stress through CB1 activation in HT22 cells.


Figures

Figure 1
Figure 1
Experimental protocol diagram. (a) The HT22 cells were assigned into seven groups. The control cells were cultured in drug-free medium, and the other six groups were exposed to different concentrations of H2O2 for 3 h, ranging from 50 μM to 1000 μM. MTT assay was taken to determine the injury degree. (b) The cells were divided into six groups; except for control and H2O2 only groups, the other four groups were exposed to 200 μM H2O2 plus different concentrations of AEA for 3 h. MTT assay was taken to evaluate the injury degree. (c) The cells were assigned into six groups, including control, AEA, H2O2, AEA + H2O2, AM251 + AEA + H2O2, and AM251 + H2O2 groups. After an incubation of 3 h, MTT assay, LDH release, and western blotting were taken to determine the roles of CB1 and Nox2 in AEA-induced protection. (d) The cells were divided into three groups, including control, CB1-siRNA, and SC-siRNA groups; after an incubation of 5 h, western blotting was used to evaluate the silencing rate of CB1 protein expression. (e) Then, the cells were divided into five groups, including control, H2O2, AEA + H2O2, CB1-siRNA + AEA + H2O2, and SC-siRNA + AEA + H2O2; the cell injury was evaluated by MTT and LDH release at 3 h after incubation, and ROS generation was evaluated by measuring fluorescence intensity. (f) The cells were divided into five groups, including control, H2O2, AEA + H2O2, apocynin + AEA + H2O2, and apocynin + AEA + H2O2; western blotting, MTT assay, and LDH release were taken to measure Nox2 expression and cell injury.
Figure 2
Figure 2
AEA increased the metabolic activity of HT22 cells exposed to H2O2 in a dose-dependent manner. (a) The correlation between the H2O2 concentration and cell metabolic activity. HT22 cells were exposed to different concentrations of H2O2 for 3 h (n = 8). (b) AEA increased the cell metabolic activity of HT22 cells exposed to 200 μM H2O2 for 3 h (n = 8). Results are expressed as means ± SD, *P < 0.05, ***P < 0.001 versus the control (no H2O2, and no AEA), # P < 0.05 versus the cells exposed to H2O2 alone.
Figure 3
Figure 3
AEA upregulated the expression of CB1 in HT22 cells. Immunofluorescence staining and western blotting were used to investigate the AEA-induced effect on CB1 protein expression in HT22 cells. The cells were divided into five groups, Control: cells cultured in drug-free medium; H2O2: cells exposed to 200 μM H2O2 for 3 h; AEA + H2O2: cells exposed to 10 μM AEA plus 200 μM H2O2 for 3 h; AM251 + AEA + H2O2: cells exposed to 10 μM AEA plus 10 μM CB1 antagonist AM251 at the presence of 200 μM H2O2 for 3 h; AM251 + H2O2: cells exposed to 10 μM AM251 plus 200 μM H2O2 for 3 h. CB1 protein (red) was expressed in HT22 cells. AEA upregulated the expression of CB1 receptor; however CB1 antagonist AM251 reversed the CB1 upregulation in HT22 cells. Nuclei were counter-stained with DAPI (blue). Results are expressed as means ± SD (n = 4). *P < 0.05 versus control (no H2O2, no AEA, and no AM251), P < 0.05 versus the cells exposed to AEA plus H2O2. Bar = 20 μm.
Figure 4
Figure 4
AEA protected HT22 cells exposed to H2O2 via CB1. (a) CB1 antagonist AM251 reversed AEA-induced protection on cell metabolic activity (n = 8). (b) AM251 reversed AEA-induced protection on LDH release (n = 6). (c) AM251 reversed AEA-induced reduction of cleaved caspase-3 expression (n = 4). (d)–(h) Apoptotic rates assessed by flow cytometry. (d) Control cells cultured in drug-free medium. (e) Cells exposed to 200 μM H2O2 for 3 h. (f) Cells exposed to 10 μM AEA plus 200 μM H2O2 for 3 h. (g) Cells exposed to 10 μM AEA plus 10 μM AM251 in the presence of 200 μM H2O2 for 3 h. (h) Cells exposed to CB1 antagonist AM251 of 10 μM plus 200 μM H2O2 for 3 h. (i) Statistical results of (c)–(g). Results are expressed as means ± SD (n = 4). *P < 0.05 versus the control (no H2O2, no AEA, and no AM251), # P < 0.05 versus the cells exposed to H2O2 alone, and P < 0.05 versus the cells exposed to AEA plus H2O2.
Figure 5
Figure 5
AEA ameliorated the morphology of HT22 cells exposed to H2O2 via CB1. (a) Control cells cultured in drug-free medium. (b) Cells exposed to 10 μM AEA for 3 h. (c) Cells exposed to 200 μM H2O2 for 3 h. (d) Cells exposed to 10 μM AEA plus 200 μM H2O2 for 3 h. (e) Cells exposed to 10 μM AEA plus 10 μM AM251 at the presence of 200 μM H2O2 for 3 h. (f) Cells exposed to CB1 antagonist AM251 of 10 μM plus 200 μM H2O2 for 3 h. H2O2 markedly damaged the cell morphology and hindered the growth of neurites. AEA attenuated the H2O2-induced injury of HT22 cells whereas CB1 antagonist AM251 reversed the AEA-induced protective effect on cell morphology. Bar = 50 μm.
Figure 6
Figure 6
AEA decreased intracellular ROS generation via CB1. The intracellular ROS levels were assessed by ROS reagent kit. (a)–(e) indicate the fluorescence intensity of ROS. (a) Control cells cultured in drug-free medium. (b) Cells exposed to 200 μM H2O2 for 3 h. (c) Cells exposed to 10 μM AEA plus 200 μM H2O2 for 3 h. (d) Cells exposed to 10 μM AEA plus 10 μM AM251 in the presence of 200 μM H2O2 for 3 h. (e) Cells exposed to 10 μM CB1 antagonist AM251 plus 200 μM H2O2 for 3 h. (f) Statistical results of (a)–(e). Results are expressed as means ± SD (n = 6). *P < 0.05 versus the control (no H2O2, no AEA, and no AM251), # P < 0.05 versus the cells exposed to H2O2 alone, and P < 0.05 versus the cells exposed to AEA plus H2O2.
Figure 7
Figure 7
AEA increased intracellular SOD and ameliorated GSH/GSSG ratio. The cells were divided into six groups, Control: cells cultured in drug-free medium; AEA: cells exposed to 10 μM AEA for 3 h; H2O2: cells exposed to 200 μM H2O2 for 3 h; AEA + H2O2: cells exposed to 10 μM AEA plus 200 μM H2O2 for 3 h; AM251 + AEA + H2O2: cells exposed to 10 μM AEA plus 10 μM CB1 antagonist AM251 in the presence of 200 μM H2O2 for 3 h; AM251 + H2O2: cells exposed to 10 μM AM251 plus 200 μM H2O2 for 3 h. The intracellular SOD, GSH, and GSSG levels were assessed by the corresponding reagent kit, and the GSH/GSSG ratio was calculated according to the GSH and GSSG levels. (a) Intracellular SOD level. (b) Intracellular GSH level. (c) Intracellular GSSG level. (d) Intracellular GSH/GSSG ratio. Results are expressed as means ± SD (n = 6). *P < 0.05 versus control (no H2O2, no AEA, and no AM251), # P < 0.05 versus the cells exposed to H2O2 alone, and P < 0.05 versus the cells exposed to AEA plus H2O2.
Figure 8
Figure 8
CB1-siRNA reversed AEA-induced protection against oxidative stress. The cells were divided into five groups, Control: cells cultured in drug-free medium; H2O2: cells exposed to 200 μM H2O2 for 3 h; AEA + H2O2: cells exposed to 10 μM AEA plus 200 μM H2O2 for 3 h; CB1-siRNA + AEA + H2O2: cells incubated with CB1-siRNA for 5 h and then exposed to 10 μM AEA plus 200 μM H2O2 for 3 h; scrambled siRNA (SC-siRNA) + AEA + H2O2: cells incubated with SC-siRNA for 5 h and then exposed to 10 μM AEA plus 200 μM H2O2 for 3 h. CB1-siRNA abolished the AEA-induced protection against 200 μM H2O2 in HT22 cells; SC-siRNA did not affect the protection. (a) CB1-siRNA significantly downregulated the expression of CB1, assessed by western blotting. (b) Cell metabolic activity, assessed by MTT (n = 8). (c) LDH release, assessed by reagent kit and spectrophotometry (n = 6). (d)–(h) The fluorescence intensity of ROS. (i) Statistical results of (d)–(h) (n = 6). Results are expressed as means ± SD, *P < 0.05 versus the control (no H2O2, no AEA, and no siRNA), # P < 0.05 versus the cells exposed to H2O2 alone, and P < 0.05 versus the cells exposed to AEA plus H2O2.
Figure 9
Figure 9
Nox2 expression was inhibited in the presence of AEA via CB1. (a) Nox2 expression was increased in HT22 cells exposed to H2O2 in a time-dependent manner. Then the cells were divided into five groups, Control: cells cultured in drug-free medium; H2O2: cells exposed to 200 μM H2O2 for 3 h; AEA + H2O2: cells exposed to 10 μM AEA plus 200 μM H2O2 for 3 h; AM251 + AEA + H2O2: cells exposed to 10 μM AEA plus 10 μM CB1 antagonist AM251 in the presence of 200 μM H2O2 for 3 h; AM251 + H2O2: cells exposed to 10 μM AM251 plus 200 μM H2O2 for 3 h. Nox2 protein expression (b) and mRNA transcription (c) were evaluated by western blotting and real-time PCR, respectively. (d) Incubation with CB1-siRNA for 5 h abolished the AEA-induced inhibition of Nox2 mRNA transcription. Results are expressed as means ± SD (n = 4). *P < 0.05 versus the control (no H2O2, no AEA, and no AM251 or siRNA), # P < 0.05 versus the cells exposed to H2O2 alone, and P < 0.05 versus the cells exposed to AEA plus H2O2.
Figure 10
Figure 10
Nox inhibitor did not induce a more significant reduction of Nox2 expression than AEA alone. The cells were divided into five groups, Control: cells cultured in drug-free medium; H2O2: cells exposed to 200 μM H2O2 for 3 h; AEA + H2O2: cells exposed to 10 μM AEA plus 200 μM H2O2 for 3 h; Apocynin + AEA + H2O2: cells exposed to 10 μM AEA plus 50 μM Nox inhibitor AM251 in the presence of 200 μM H2O2 for 3 h; Apocynin + AEA + H2O2: cells exposed to 50 μM apocynin plus 10 μM AEA in the presence of 200 μM H2O2 for 3 h. Nox2 protein expression (a) was evaluated by western blotting (n = 4). (b) Cell metabolic activity and (c) LDH release were determined by MTT (n = 8) and reagent kit (n = 6), respectively. Results are expressed as means ± S.D. *P < 0.05 versus the control (no H2O2, no AEA, and no apocynin), # P < 0.05 versus the cells exposed to H2O2 alone, n.s.: no significance.

Similar articles

Cited by

References

    1. Zhao ZY, Luan P, Huang SX, et al. Edaravone protects HT22 neurons from H2O2-induced apoptosis by inhibiting the MAPK signaling pathway. CNS Neuroscience and Therapeutics. 2013;19(3):163–169. - PMC - PubMed
    1. Chen S, Lin M, Chang C. Ischemic and oxidative damage to the hypothalamus may be responsible for heat stroke. Current Neuropharmacology. 2013;11(2):129–140. - PMC - PubMed
    1. Sun L, Jin Y, Dong L, Sumi R, Jahan R, Li Z. The neuroprotective effects of Coccomyxa gloeobotrydiformis on the ischemic stroke in a rat model. International Journal of Biological Sciences. 2013;9(8):811–817. - PMC - PubMed
    1. Gheysarzadeh A, Yazdanparast R. Inhibition of H2O2-induced cell death through FOXO1 modulation by EUK-172 in SK-N-MC cells. European Journal of Pharmacology. 2012;697(1–3):47–52. - PubMed
    1. Lu X, Xu H, Sun B, Zhu Z, Zheng D, Li X. Enhanced neuroprotective effects of resveratrol delivered by nanoparticles on hydrogen peroxide-induced oxidative stress in rat cortical cell culture. Molecular Pharmaceutics. 2013;10(5):2045–2053. - PubMed

Publication types

MeSH terms

LinkOut - more resources