. 2014 Aug 19;9(8):e104150.
doi: 10.1371/journal.pone.0104150. eCollection 2014.

Transcriptome analysis of the oil-rich tea plant, Camellia oleifera, reveals candidate genes related to lipid metabolism

Affiliations

Transcriptome analysis of the oil-rich tea plant, Camellia oleifera, reveals candidate genes related to lipid metabolism

En-Hua Xia et al. PLoS One. .

Abstract

Background: Rapidly driven by the need for developing sustainable sources of nutritionally important fatty acids and the rising concerns about environmental impacts after using fossil oil, oil-plants have received increasing awareness nowadays. As an important oil-rich plant in China, Camellia oleifera has played a vital role in providing nutritional applications, biofuel productions and chemical feedstocks. However, the lack of C. oleifera genome sequences and little genetic information have largely hampered the urgent needs for efficient utilization of the abundant germplasms towards modern breeding efforts of this woody oil-plant.

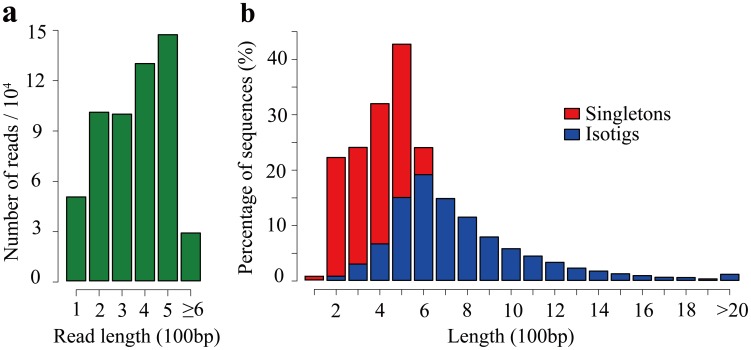
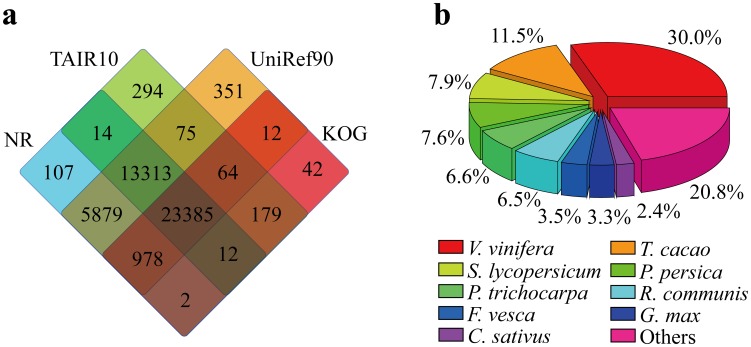
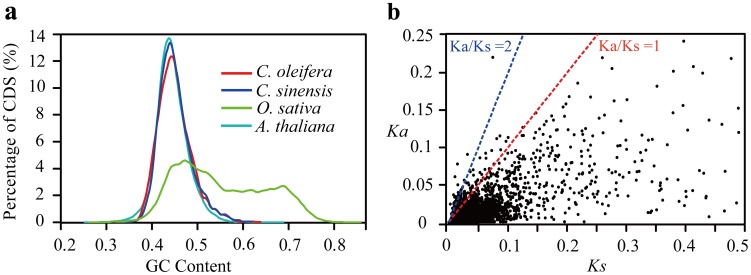
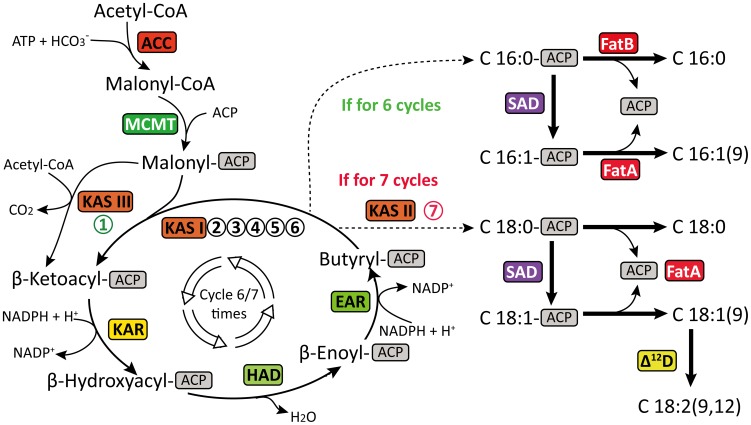
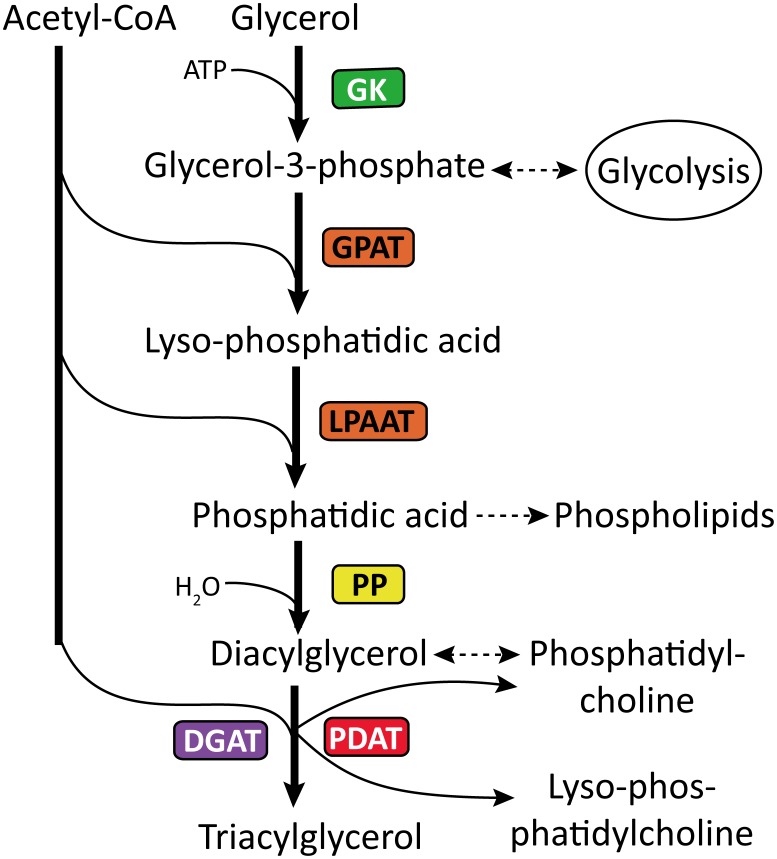
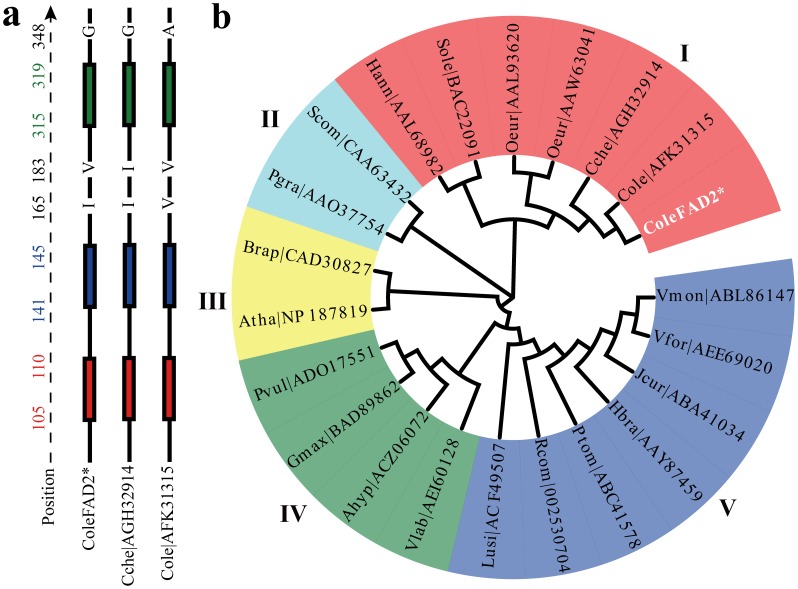
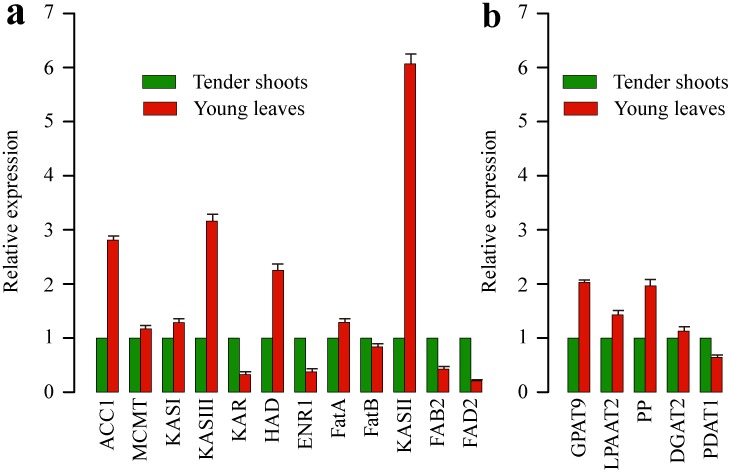
Results: Here, using the 454 GS-FLX sequencing platform, we generated approximately 600,000 RNA-Seq reads from four tissues of C. oleifera. These reads were trimmed and assembled into 104,842 non-redundant putative transcripts with a total length of ∼38.9 Mb, representing more than 218-fold of all the C. oleifera sequences currently deposited in the GenBank (as of March 2014). Based on the BLAST similarity searches, nearly 42.6% transcripts could be annotated with known genes, conserved domains, or Gene Ontology (GO) terms. Comparisons with the cultivated tea tree, C. sinensis, identified 3,022 pairs of orthologs, of which 211 exhibited the evidence under positive selection. Pathway analysis detected the majority of genes potentially related to lipid metabolism. Evolutionary analysis of omega-6 fatty acid desaturase (FAD2) genes among 20 oil-plants unexpectedly suggests that a parallel evolution may occur between C. oleifera and Olea oleifera. Additionally, more than 2,300 simple sequence repeats (SSRs) and 20,200 single-nucleotide polymorphisms (SNPs) were detected in the C. oleifera transcriptome.

Conclusions: The generated transcriptome represents a considerable increase in the number of sequences deposited in the public databases, providing an unprecedented opportunity to discover all related-genes associated with lipid metabolic pathway in C. oleifera. It will greatly enhance the generation of new varieties of C. oleifera with increased yields and high quality.


Conflict of interest statement

Competing Interests: The authors have declared that no competing interests exist.

Figures

Figure 1
Figure 1. Overview of C. oleifera transcriptome sequencing and assembly.
(a) Length distribution of 454 sequencing reads after filtering and trimming adapters. (b) Length distribution of the singletons and assembled isotigs.
Figure 2
Figure 2. Characteristics of the homology search of unigenes against four public protein databases.
(a) Venn diagram showing the BLAST searches of C. oleifera transcriptome against the four public protein databases. De novo reconstructed transcript sequences were used to BLAST against public databases including NCBI's NR, TAIR10, UniRef90 and KOG. The number of transcripts that have significant hits (E-value≤10−5) against the four databases is shown in each intersection of the Venn diagram. (b) Species distribution is shown as the percentage of the total homologous sequences (with an E-value≤10−5). We searched the NCBI NR database by using BLASTx and extracted the best hit of each sequence for analysis.
Figure 3
Figure 3. Histogram presentation of the most abundant Gene Ontology (GO) terms assigned to the C. oleifera transcriptome.
The NR based Blast2GO results are summarized into three main GO categories: biological process (BP), cellular component (CC), and molecular function (MF). Only the top ten GO terms for each main function category are shown (blue: BP; red: CC; green: MF). The corresponding GO IDs are presented in parentheses. The x-axis indicates the number of genes assigned to the same GO term. One unigene may be matched to multiple GO terms.
Figure 4
Figure 4. Distribution of simple sequence repeats (SSRs), single nucleotide polymorphisms (SNPs) and insertion/deletions (InDels) in C. oleifera isotigs.
(a) Di-, tri-, tetra-, penta- and hexa-nucleotide repeats were analyzed. The x-axis shows the type of the SSRs, whereas y-axis shows total number of SSRs in different classes. (b) Frequencies of different SNPs/InDels. The x-axis indicates the substitution type of SNPs/InDels, while y-axis represents the number of SNPs/InDels for each substitution type.
Figure 5
Figure 5. Characteristics of the 3,022 orthologous genes between C. oleifera and C. sinensis.
(a) Distribution of GC content of CDS sequences among the C. oleifera, C. sinensis, O. sativa and A. thaliana. The CDS sequences of O. sativa (version 7.0) and A. thaliana (version 10) were downloaded from MSU Rice Genome Annotation Project (http://rice.plantbiology.msu.edu/) and TAIR (http://www.arabidopsis.org/), respectively. (b) Distribution of Ka and Ks. The mean Ka/Ks value is 0.39. The red line indicates the threshold of Ka/Ks = 1, whereas the blue line shows the more conservative threshold of Ka/Ks = 2. Analysis was performed using the method by Yang & Nielsen (2000).
Figure 6
Figure 6. Core reactions of fatty acid biosynthesis reconstructed based on the de novo assembly and annotation of C. oleifera transcriptome.
During fatty acid biosynthesis, two-carbon units are added for each cycle reaction, and the four-step cycle is repeated until the appropriate chain-length is reached. Finally, different types of fatty acids are synthesized. The identified enzymes are shown in boxes and abbreviated as below: ACC, acetyl-CoA carboxylase (EC: 6.4.1.2); MAT, malonyl-CoA ACP transacylase (EC: 2.3.1.39); KAS, beta-ketoacyl-ACP synthase (KAS I, EC: 2.3.1.41; KASII, EC: 2.3.1.179; KAS III, EC: 2.3.1.180); KAR, beta-ketoacyl-ACP reductase (EC: 1.1.1.100); HAD, beta-hydroxyacyl-ACP dehydrase (EC: 4.2.1.-); EAR, enoyl-ACP reductase (EC: 1.3.1.9); AAD, acyl-ACP desaturase (EC: 1.14.19.2); OAH, oleoyl-ACP hydrolase (EC: 3.1.2.14); FatA, Acyl-ACP thioesterase A (EC: 3.1.2.-); Δ12D, Δ126)-desaturase (EC: 1.4.19.6). The numbers-in-circles indicates the repeat time of the condensation reaction.
Figure 7
Figure 7. Triacylglycerol (TAG) biosynthesis pathway reconstructed based on the de novo assembly and annotation of C. oleifera transcriptome.
Identified enzymes are shown in boxes, including: GK, glycerol kinase (EC: 2.7.1.30); GPAT, glycerol-3-phosphate O-acyltransferase (EC: 2.3.1.15); AGPAT, 1-acyl-sn-glycerol-3-phosphate O-acyltransferase (EC: 2.3.1.51); PP, phosphatidate phosphatase (EC: 3.1.3.4); DGAT, diacylglycerol O-acyltransferase (EC: 2.3.1.20); and PDAT, phopholipid∶ diacyglycerol acyltransferase (EC: 2.3.1.158). The dashed arrows denote reaction(s) in which the enzymes are not shown.
Figure 8
Figure 8. Phylogenetic analyses of the FAD2 genes among 20 oil-plants.
(a) The alignment of Cole|AFK31315 (C. oleifera, AFK31315), Cche|AGH32914 (C. chekiangoleosa, AGH32914) and ColeFAD2 (ColeIsotig4522:451–1599) amino acid sequences. The solid black lines indicate conserved amino acids. The filled boxes represent three H-boxes, including HECGH (red box), HRRHH (blue box), and HVAHH (green box). The position (left) is based on FAD2 gene in C. chekiangoleosa (AGH32914). The three inconsistent amino acids were plotted in uppercase letters (black). Multiple sequence alignment was performed using ClustalW , package. (b) The amino acid sequences were used for phylogenetic tree analysis. The asterisk indicates the FAD2 gene (ColeFAD2) detected in the assembled C. oleifera transcriptome (ColeIsotig4522:451–1599). I–V represent the five groups of all the 20 oil-plants classified by the sequence similarity. The GenBank accession numbers and the full species names of the genes used here are: Scom|CAA63432 (Solanum commersonii, CAA63432); Atha|NP_187819 (Arabidopsis thaliana, NP_187819); Hann|AAL68982 (Helianthus annuus, AAL68982); Brap|CAD30827 (Brassica rapa, CAD30827); Sole|BAC22091 (Spinacia oleracea, BAC22091); Oeur|AAL93620 (Olea europaea, AAL93620); Pgra|AAO37754 (Punica granatum, AAO37754); Oeur|AAW63041 (Olea europaea, AAW63041); Gmax|BAD89862 (Glycine max, BAD89862); Hbra|AAY87459 (Hevea brasiliensis, AAY87459); Jcur|ABA41034 (Jatropha curcas, ABA41034); Ptom|ABC41578 (Populus tomentosa, ABC41578); Vmon|ABL86147 (Vernicia Montana, ABL86147); Lusi|ACF49507 (Linum usitatissimum, ACF49507); Rcom|002530704 (Ricinus communis, XP_002530704); Ahyp|ACZ06072 (Arachis hypogaea, ACZ06072); Pvul|ADO17551 (Phaseolus vulgaris, ADO17551); Vfor|AEE69020 (Vernicia fordii, AEE69020); Vlab|AEI60128 (Vitis labrusca, AEI60128); Cole|AFK31315 (C. oleifera, AFK31315); Cche|AGH32914 (C. chekiangoleosa, AGH32914).
Figure 9
Figure 9. Quantitative RT-PCR validations of the 17 candidate lipid-related genes in the C. oleifera transcriptome.
17 candidate unigenes involved in lipid metabolism including (a) fatty acid and (b) TAG pathways were selected for the quantitative RT-PCR analysis. Standard error of the mean for three biological replicates (nested with three technical replicates) is represented by the error bars. Results represent the mean (± SD) of the three experiments. The translation elongation factor 1-alpha (TEF) gene was chosen as an internal standard.

References

    1. Ohlrogge JB (1994) Design of new plant products: engineering of fatty acid metabolism. Plant Physiol 104: 821–826. - PMC - PubMed
    1. Yu Y, Ren S, Tan K (1999) Study on climatic regionalization and layer and belt distribution of oiltea camellia quality in China. J Nat Res 14: 123–127.
    1. Shanan H, Ying G (1982) The comprehensive utilization of camellia fruits. Am Camellia Yearbk 37: 104–107.
    1. Stack L, Ruter J (2006) Teaoil Camellia-Eastern “Olive” for the world. In: XXVII International Horticultural Congress-IHC2006: International Symposium on Asian Plants with Unique Horticultural 769: . pp. 43–48.
    1. Xia L, Zhang A, Xiao T (1993) An introduction to the utilization of camellia oil in China. Am Camellia Yearbk 48: 12–15.

Publication types

MeSH terms