

A quantitative comparison of single-cell whole genome amplification methods
- PMID: 25136831
- PMCID: PMC4138190
- DOI: 10.1371/journal.pone.0105585
A quantitative comparison of single-cell whole genome amplification methods
Abstract
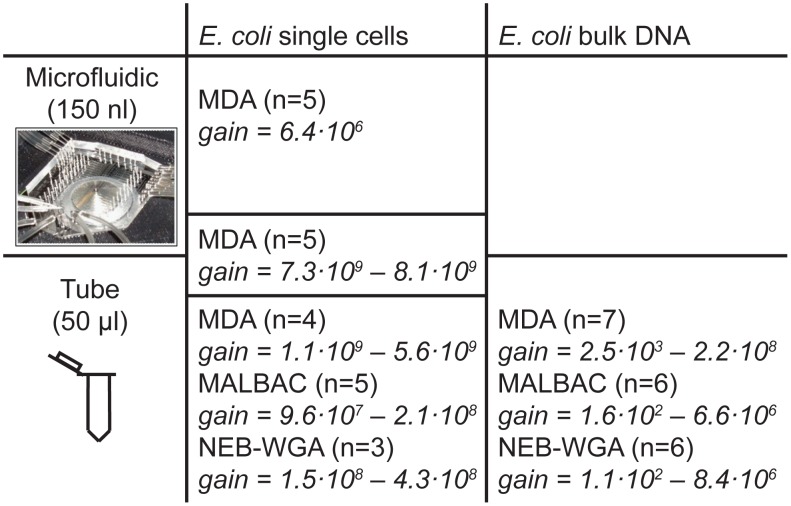
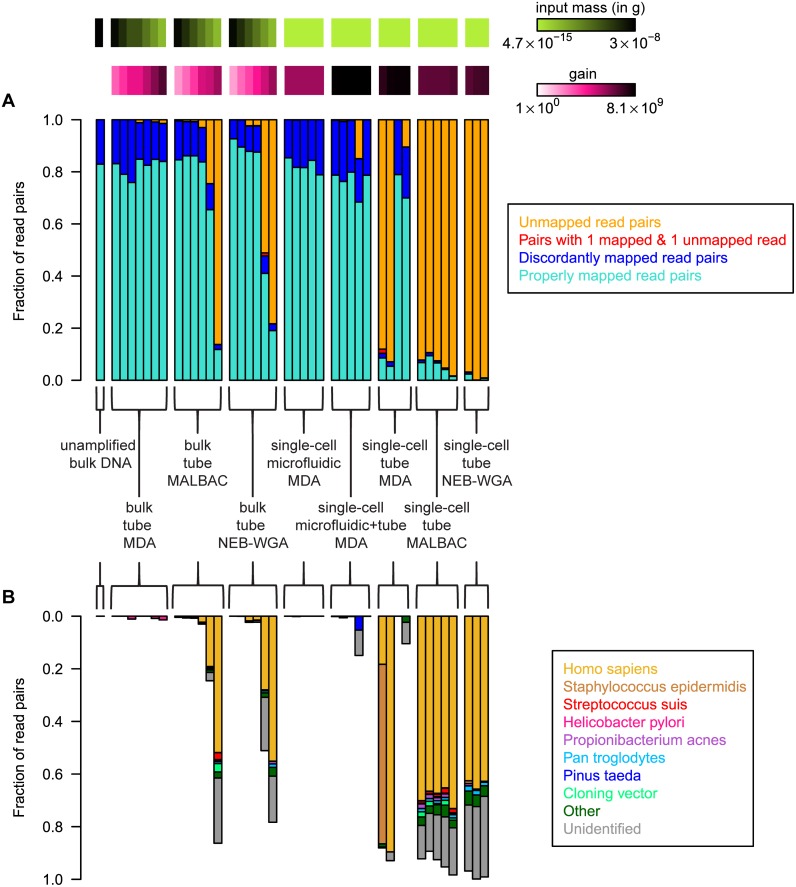
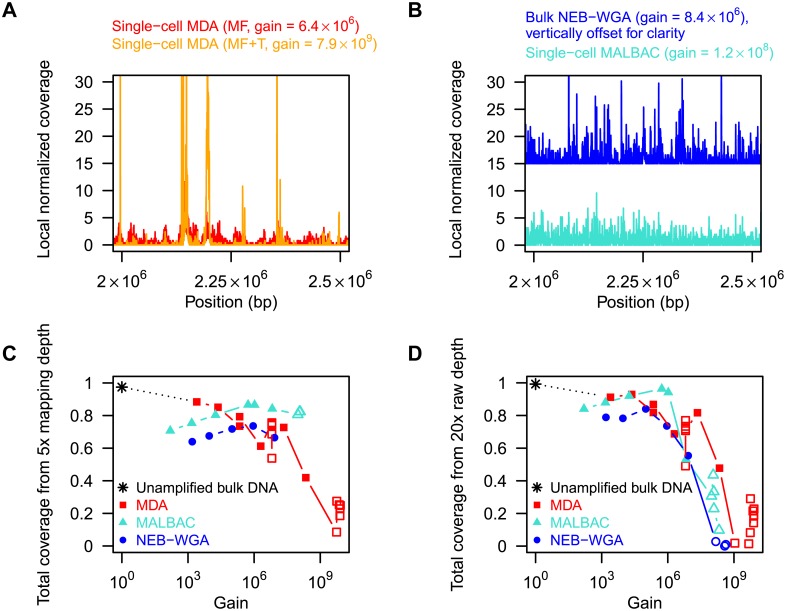
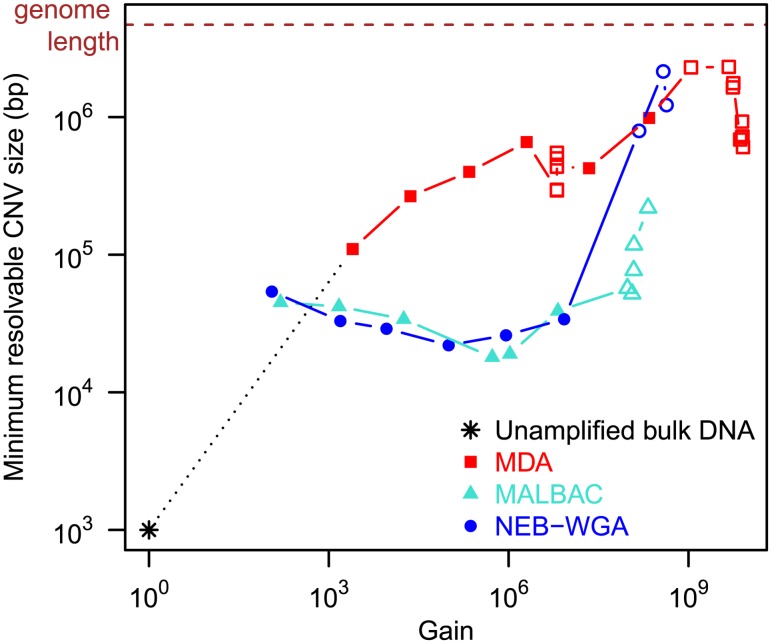
Single-cell sequencing is emerging as an important tool for studies of genomic heterogeneity. Whole genome amplification (WGA) is a key step in single-cell sequencing workflows and a multitude of methods have been introduced. Here, we compare three state-of-the-art methods on both bulk and single-cell samples of E. coli DNA: Multiple Displacement Amplification (MDA), Multiple Annealing and Looping Based Amplification Cycles (MALBAC), and the PicoPLEX single-cell WGA kit (NEB-WGA). We considered the effects of reaction gain on coverage uniformity, error rates and the level of background contamination. We compared the suitability of the different WGA methods for the detection of copy-number variations, for the detection of single-nucleotide polymorphisms and for de-novo genome assembly. No single method performed best across all criteria and significant differences in characteristics were observed; the choice of which amplifier to use will depend strongly on the details of the type of question being asked in any given experiment.
Conflict of interest statement
Figures
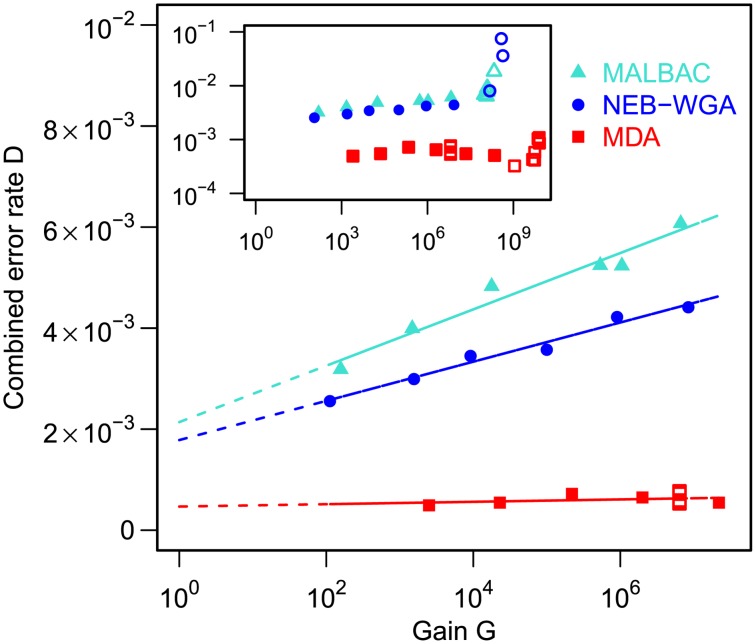
 are also shown: their slope approximately indicates the per-base per-cycle replication error rate. Inset: D versus G over the entire gain range. Filled symbols signify bulk experiments, open symbols single-cell experiments.
References
-
- Wells D, Delhanty JD (2000) Comprehensive chromosomal analysis of human preimplantation embryos using whole genome amplification and single cell comparative genomic hybridization. Mol Hum Reprod 6: 1055–1062. - PubMed
Publication types
MeSH terms
Substances
Associated data
- SRA/SAMN02782248
- SRA/SAMN02782249
- SRA/SAMN02782250
- SRA/SAMN02782251
- SRA/SAMN02782252
- SRA/SAMN02782253
- SRA/SAMN02782254
- SRA/SAMN02782255
- SRA/SAMN02782256
- SRA/SAMN02782257
- SRA/SAMN02782258
- SRA/SAMN02782259
- SRA/SAMN02782260
- SRA/SAMN02782261
- SRA/SAMN02782262
- SRA/SAMN02782263
- SRA/SAMN02782264
- SRA/SAMN02782265
- SRA/SAMN02782266
- SRA/SAMN02782267
- SRA/SAMN02782268
- SRA/SAMN02782269
- SRA/SAMN02782270
- SRA/SAMN02782271
- SRA/SAMN02782272
- SRA/SAMN02782273
- SRA/SAMN02782274
- SRA/SAMN02782275
- SRA/SAMN02782276
- SRA/SAMN02782277
- SRA/SAMN02782278
- SRA/SAMN02782279
- SRA/SAMN02782280
- SRA/SAMN02782281
- SRA/SAMN02782282
- SRA/SAMN02782283
- SRA/SAMN02782284
- SRA/SAMN02782285
- SRA/SAMN02782286
- SRA/SAMN02782287
- SRA/SAMN02782288
- SRA/SAMN02782289
Grants and funding
LinkOut - more resources
Full Text Sources
Other Literature Sources
