. 2014 Aug 19;12(8):e1001928.
doi: 10.1371/journal.pbio.1001928. eCollection 2014 Aug.

Bistable expression of virulence genes in salmonella leads to the formation of an antibiotic-tolerant subpopulation

Affiliations

Bistable expression of virulence genes in salmonella leads to the formation of an antibiotic-tolerant subpopulation

Markus Arnoldini et al. PLoS Biol. .

Abstract

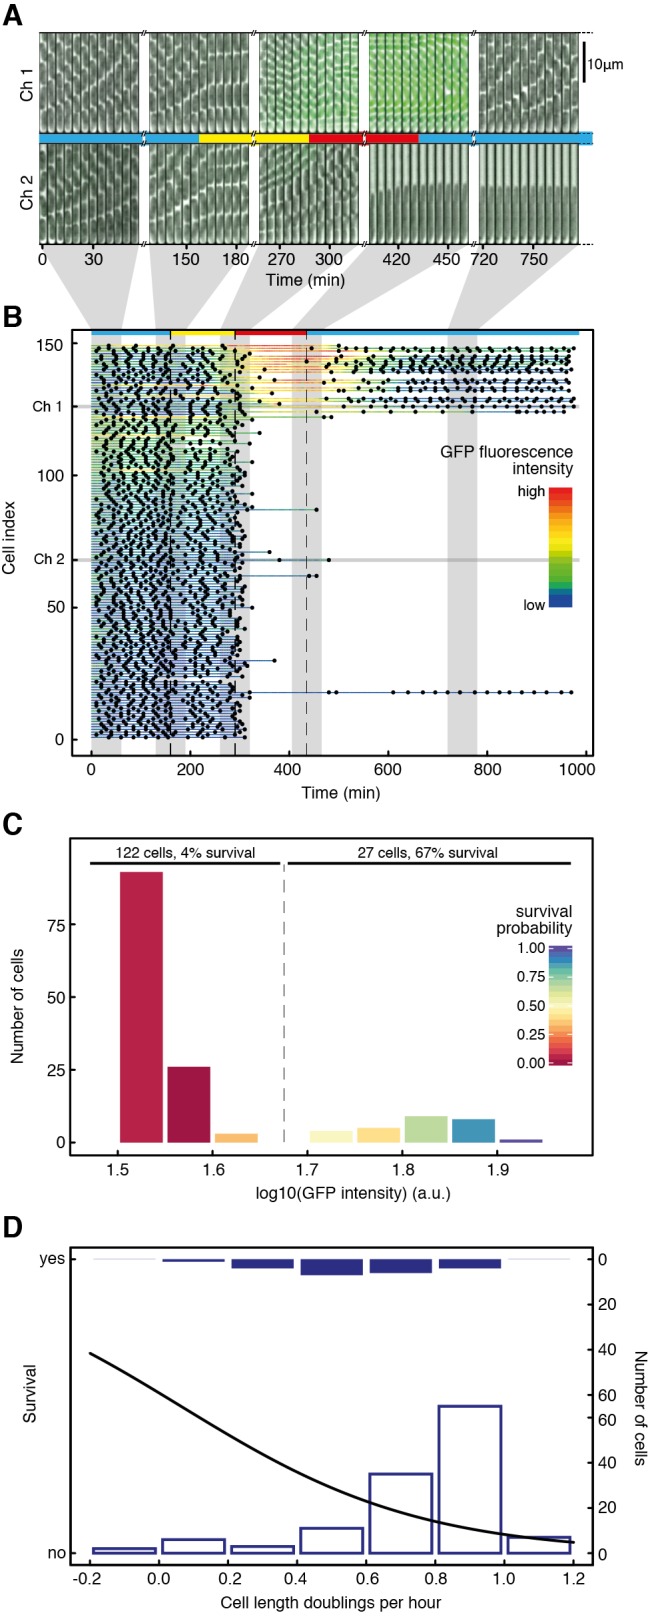
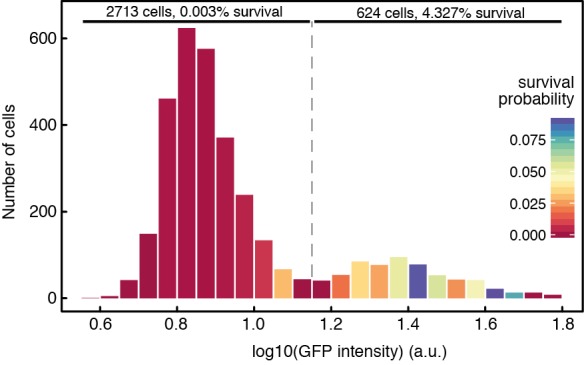
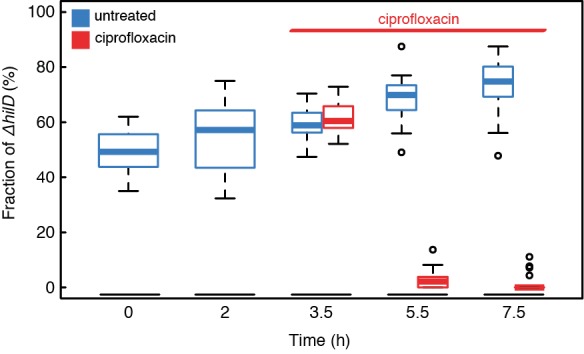
Phenotypic heterogeneity can confer clonal groups of organisms with new functionality. A paradigmatic example is the bistable expression of virulence genes in Salmonella typhimurium, which leads to phenotypically virulent and phenotypically avirulent subpopulations. The two subpopulations have been shown to divide labor during S. typhimurium infections. Here, we show that heterogeneous virulence gene expression in this organism also promotes survival against exposure to antibiotics through a bet-hedging mechanism. Using microfluidic devices in combination with fluorescence time-lapse microscopy and quantitative image analysis, we analyzed the expression of virulence genes at the single cell level and related it to survival when exposed to antibiotics. We found that, across different types of antibiotics and under concentrations that are clinically relevant, the subpopulation of bacterial cells that express virulence genes shows increased survival after exposure to antibiotics. Intriguingly, there is an interplay between the two consequences of phenotypic heterogeneity. The bet-hedging effect that arises through heterogeneity in virulence gene expression can protect clonal populations against avirulent mutants that exploit and subvert the division of labor within these populations. We conclude that bet-hedging and the division of labor can arise through variation in a single trait and interact with each other. This reveals a new degree of functional complexity of phenotypic heterogeneity. In addition, our results suggest a general principle of how pathogens can evade antibiotics: Expression of virulence factors often entails metabolic costs and the resulting growth retardation could generally increase tolerance against antibiotics and thus compromise treatment.


Conflict of interest statement

The authors have declared that no competing interests exist.

Figures

Figure 1
Figure 1. Expression of ttss-1 is associated with tolerance to antibiotic exposure.
(A and B) We used time-lapse analysis of single cells to study tolerance to antibiotics. Bacteria were first grown in LB medium (marked blue), shifted to spent LB at 160 min (yellow), shifted to spent LB containing 0.05 µg/ml ciprofloxacin at 290 min (red), and shifted back to LB at 435 min (blue). (A) Bacterial cells were grown in microfluidic devices in dead-ended channels, with medium flowing through a bigger main channel orthogonal to them. The top row shows a temporal montage of images of a channel in which the bottom cell started expressing ttss-1 and resumed division after exposure to 0.05 µg/ml ciprofloxacin (“Ch 1”), and the bottom row shows a temporal montage of images of a channel in which the bottom cell did not express ttss-1 and did not resume division after exposure to antibiotic (“Ch 2”). For each channel, five sets of still images from different phases of the experiment are shown. Each set consists of 12 images recorded at 5-min time intervals. (B) Quantitative analysis of all 149 cells from this experiment. Every horizontal line represents data for an individual cell over 975 min. Dots mark the time points at which this cell divided. Cells are sorted according to ttss-1 expression during antibiotic exposure, measured as mean GFP fluorescence during that time interval. The cell index indicates the rank of a cell according to its mean GFP expression during antibiotic exposure; a lower cell index indicates lower GFP expression, and a higher cell index indicates higher GFP expression. The color of the lines indicates real-time GFP intensity. Shading indicates the data corresponding to the cells shown in (A). Three independent experiments were performed, all of them showing significant positive correlations of survival with ttss-1 expression (logistic regression with ANOVA, p = 8.8×10⁻¹⁴, 2.4×10⁻⁵, 1.3×10⁻⁸; N = 149, 137, and 144), indicating that T1+ cells preferentially survive antibiotic exposure. (C) Histogram of cells in different GFP categories. Color-coding of the columns denotes the probabilities to survive exposure to 0.05 µg/ml ciprofloxacin. The columns were assigned visually to two categories according to GFP intensity (“GFP on,” “GFP off”), and the percentage of cells surviving in the different categories was calculated. (D) Analysis of the single cell elongation rates 75 min before and 25 min after addition of antibiotic and survival. The black curve indicates the survival probability depending on the cell elongation rate as determined by a logistic regression model. The histograms show how many cells were in the respective ranges of elongation rates, and whether they survive antibiotic treatment (full bars, top) or die (empty bars, bottom). For all three experiments, survival was negatively correlated with single cell elongation rates (logistic regression with ANOVA, p = 7.8×10⁻⁴, 3.2×10⁻⁴, 1.0×10⁻⁴, N = 151, 137, and 114).
Figure 2
Figure 2. Tolerance of T1+ cells is also observed at a clinically relevant antibiotic concentration.
Pooled results of three independent experiments analogous to the one shown in Figure 1, except that cells were exposed to a higher ciprofloxacin concentration, 10 µg/ml. We determined the ttss-1 expression levels of a total of 3,337 cells (measured as GFP fluorescence intensity at the last time point during antibiotic exposure) and recorded their fate during exposure to antibiotics. The histogram shows the number of cells in different GFP intensity categories, indicating ttss-1 expression levels. Background fluorescence intensity (measured in areas of the image not containing cells) was subtracted from the measured GFP values in order to allow pooling of different experiments. Color-coding denotes the probabilities to survive exposure to 10 µg/ml ciprofloxacin for each GFP intensity category. In three independent experiments, cells that express ttss-1 have a significantly higher survival probability (logistic regression with ANOVA, p = 0.03, 6.2×10⁻⁸, 4.2×10⁻³; N = 653, 1,208, and 1,476). In addition, columns were assigned visually to two categories according to their GFP expression (“GFP on,” “GFP off”), and the percentage of cells surviving in the different categories was calculated.
Figure 3
Figure 3. Selection for genetically avirulent mutants is reversed when exposed to antibiotic.
Dynamics of the fraction of ΔhilD cells in mixed cultures with wild-type cells over time. Cultures were inoculated with approximately 1∶1 ratios of the two strains. A kanamycin resistance marker was used to distinguish between strains. Without antibiotic challenge, ΔhilD cells increase in frequency relative to wild-type cells (blue boxes), whereas exposure to 0.05 µg/ml ciprofloxacin reverses the trend, and ΔhilD cells decrease in frequency relative to wild type (red boxes). Boxes span the range between upper and lower quartile; thick lines denote the median; whiskers denote the highest and lowest values still within 1.5 interquartile ranges of the upper and lower quartiles, respectively; empty circles represent data points that are outside this range. The addition of ciprofloxacin has a significant influence on the outcome of competition (two way ANOVA, Time×Treatment interaction, p<2×10⁻¹⁶, N = 20).

References

    1. Elowitz MB, Levine AJ, Siggia ED, Swain PS (2002) Stochastic gene expression in a single cell. Science 297: 1183–1186. - PubMed
    1. Raser JM, O'Shea EK (2005) Noise in gene expression: origins, consequences, and control. Science 309: 2010–2013. - PMC - PubMed
    1. Kærn M, Elston TC, Blake WJ, Collins JJ (2005) Stochasticity in gene expression: from theories to phenotypes. Nat Rev Genet 6: 451–464. - PubMed
    1. Silander OK, Nikolic N, Zaslaver A, Bren A, Kikoin I (2012) A genome-wide analysis of promoter-mediated phenotypic noise in Escherichia coli. PLoS Genet 8: e1002443. - PMC - PubMed
    1. Arnoldini M, Mostowy R, Bonhoeffer S, Ackermann M (2012) Evolution of stress response in the face of unreliable environmental signals. PLoS Comput Biol 8: e1002627. - PMC - PubMed

Publication types

MeSH terms

Substances