. 2014 Aug 19;9(8):e105231.
doi: 10.1371/journal.pone.0105231. eCollection 2014.

A novel cell line derived from pleomorphic adenoma expresses MMP2, MMP9, TIMP1, TIMP2, and shows numeric chromosomal anomalies

Affiliations

A novel cell line derived from pleomorphic adenoma expresses MMP2, MMP9, TIMP1, TIMP2, and shows numeric chromosomal anomalies

Aline Semblano Carreira Falcão et al. PLoS One. .

Abstract

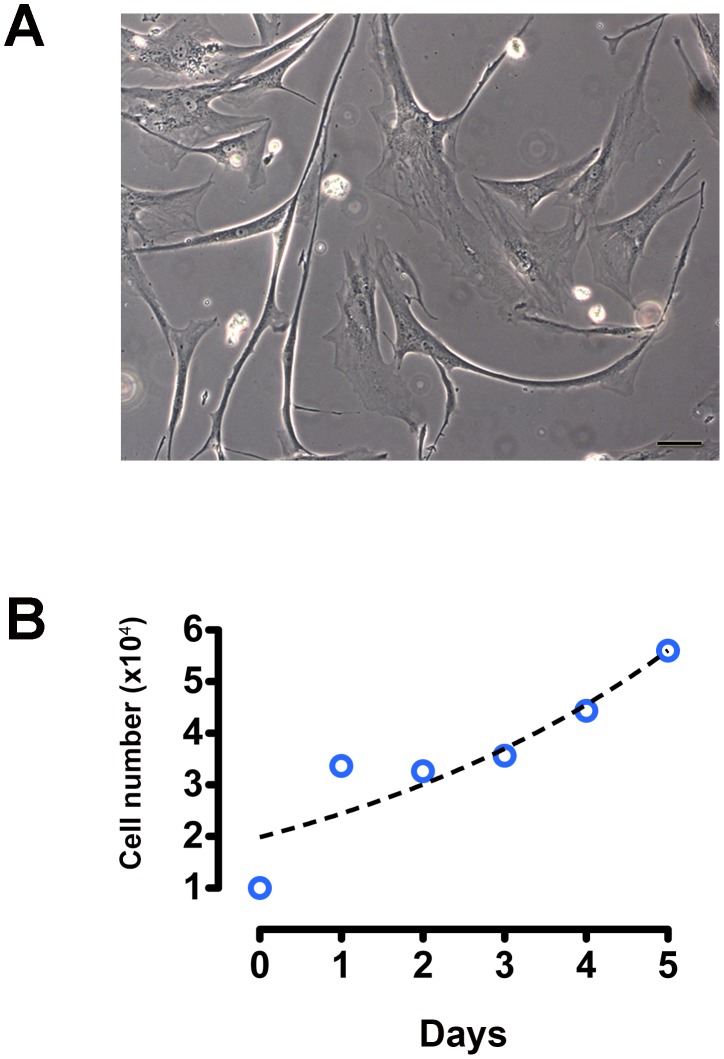
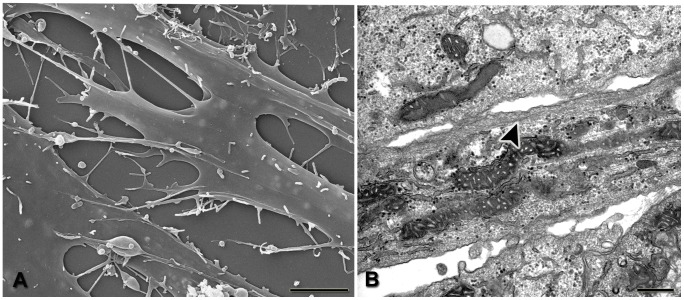
Pleomorphic adenoma is the most common salivary gland neoplasm, and it can be locally invasive, despite its slow growth. This study aimed to establish a novel cell line (AP-1) derived from a human pleomorphic adenoma sample to better understand local invasiveness of this tumor. AP-1 cell line was characterized by cell growth analysis, expression of epithelial and myoepithelial markers by immunofluorescence, electron microscopy, 3D cell culture assays, cytogenetic features and transcriptomic study. Expression of matrix metalloproteinases (MMPs) and their tissue inhibitors (TIMPs) was also analyzed by immunofluorescence and zymography. Furthermore, epithelial and myoepithelial markers, MMPs and TIMPs were studied in the tumor that originated the cell line. AP-1 cells showed neoplastic epithelial and myoepithelial markers, such as cytokeratins, vimentin, S100 protein and smooth-muscle actin. These molecules were also found in vivo, in the tumor that originated the cell line. MMPs and TIMPs were observed in vivo and in AP-1 cells. Growth curve showed that AP-1 exhibited a doubling time of 3.342 days. AP-1 cells grown inside Matrigel recapitulated tumor architecture. Different numerical and structural chromosomal anomalies were visualized in cytogenetic analysis. Transcriptomic analysis addressed expression of 7 target genes (VIM, TIMP2, MMP2, MMP9, TIMP1, ACTA2 e PLAG1). Results were compared to transcriptomic profile of non-neoplastic salivary gland cells (HSG). Only MMP9 was not expressed in both libraries, and VIM was expressed solely in AP-1 library. The major difference regarding gene expression level between AP-1 and HSG samples occurred for MMP2. This gene was 184 times more expressed in AP-1 cells. Our findings suggest that AP-1 cell line could be a useful model for further studies on pleomorphic adenoma biology.


Conflict of interest statement

Competing Interests: The authors have declared that no competing interests exist.

Figures

Figure 1
Figure 1. Histopathological features of pleomorphic adenoma sample stained with hematoxilin & eosin.
Samples are tissue sections from the patient from whom the AP-1 cell line was derived. A fibrous tissue capsule surrounds a heterogeneous and dense epithelial cell population, distributed as sheets, cords and islets (A). Tumor cells show spindle or plasmacytoid phenotype (B), and are embedded in myxoid (C) and chondroid (D) stroma. Scale bars: A = 50 µm; B, C, D = 10 µm.
Figure 2
Figure 2. Pleomorphic adenoma expresses epithelial and myoepithelial markers in vivo.
Samples are tissue sections from the patient from whom the AP-1 cell line was derived. S-100 protein (A) exhibits cytoplasmic labeling, mostly in plasmacytoid cells. Cytoplasmic expression of vimentin (B) and smooth muscle actin (C) is observed in spindle and plasmacytoid cells. Cytokeratins AE1/AE3 (D) and CK-14 (E) show cytoplasmic staining in ductal, plasmacytoid and spindle cells. CK-19 (F) expression is found in ductal cells. Scale bars: A, B, C = 10 µm; D, E, F = 20 µm.
Figure 3
Figure 3. Pleomorphic adenoma expresses MMPs and TIMPs in vivo.
Samples are tissue sections from the patient from whom the AP-1 cell line was derived. MMP2 (A) is expressed in ductal cells, while MMP9 (B) is observed in spindle and plasmacitoyd cells. TIMP-1 (C) is observed in luminal cells of duct-like structures, and TIMP-2 (D) is found in spindle and plasmacytoid cells. Negative controls show no staining (E, F). Scale bars: 10 µm; E, F = 20 µm.
Figure 4
Figure 4. Cell culture and growth analysis.
Phase contrast microscopy displays AP-1 cells with polyhedral and spindle-shaped phenotype (A). Growth curve of AP-1 cells shows growth until the 5th day (B). Doubling time was 3.342 days. Points were fitted using exponential growth non-linear regression. Scale bar: A = 20 µm.
Figure 5
Figure 5. Characterization of AP-1 cells.
SEM shows cells with elongated and flattened morphology, with numerous thin cytoplasmic processes forming an intricate network (A). Analysis by TEM reveals the presence of well-developed Golgi complex, mitochondria, and large amounts of glycogen granules. Filamentous networks are found in the cytoplasm near the plasma membrane (B, arrowhead). Scale bars: A = 5 µm; B = 500 nm.
Figure 6
Figure 6. 3D cell culture assays.
AP-1 cells were grown within Matrigel, fixed and labeled with actin and DAPI. Actin staining reveals the cortical cytoskeleton, thus outlining cell boundaries. AP-1 cells grown inside Matrigel appear epitheliod, forming closely packed arrangements (A and B). Duct-like structures are observed (A and B, asterisks). Three-dimensional reconstruction by Volocity software clearly shows these duct-like spaces formed by multiple layers of cells (C and D). Overall, these features recapitulate pleomorphic adenoma in vivo phenotype. Scale bar: 50 µm.
Figure 7
Figure 7. Pleomorphic adenoma expresses epithelial and myoepithelial markers in vitro.
S-100 (A) is observed as dots distributed throughout cell cytoplasm. Vimentin (B), smooth muscle actin (C), CK-AE1/AE3 (D), CK-14 (E) and CK-19 (F) are present as filamentous network. Scale bars: A, D, F = 10 µm; B, C, E = 20 µm.
Figure 8
Figure 8. MMPs and TIMPs colocalize in vitro.
AP-1 cells exhibit MMP2/TIMP-2 (A, B, D) and MMP9/TIMP-1 (E, F, H) as colocalized dots (D, arrow). Quantitative fluorescence shows that MMP2 staining was clearly higher compared to MMP9 (bottom plots). Negative control exhibits no staining (boxed area). Scale bar: 20 µm.
Figure 9
Figure 9. Protease activity.
Conditioned media of AP-1 cells in the 7th and 13th passages were analyzed by zymography. Gelatinolytic bands corresponding to MMP2 and MMP9 are observed in both groups. Both active and latent forms of MMP2 are observed. MMP9 latent form seems to be secreted by cells in the 13th passage. MMP2 and MMP9 positive controls (Std MMP) are included. Zymographic experiments were carried out at least three times with consistent results.
Figure 10
Figure 10. Numerical and structural chromosomal abnormalities.
G-banded karyotype, euploid metaphases (A) shows rearrangements of terminal portions of chromosomes 2 and 8 long arms. Polyploid metaphases (B) reveal numerical variations for different chromosomes.
Figure 11
Figure 11. DNA Sequencing.
Length distribution of AP-1 and HSG reads. Some reads have short length (6–49 bp), removed to prevent alignment errors (A). Quality Graph of AP-1 and HSG libraries. The quality is over Phred 20 in most bases, but for both samples (AP-1 and HSG) the quality decreases in the sequences (B). Expression level (Fragments Per Kilobase Of Exon Per Million Fragments Mapped, FPKM) for the genes VIM, TIMP2, MMP2, MMP9,TIMP1, ACTA2 and PLAG1, for AP-1 and HSG library (C).

References

    1. Ellis GL, Auclair PL (1996) Atlas of Tumor Pathology. Tumors of the Salivary Glands. Washington: AFIP. 468 p.
    1. Ito FA, Jorge J, Vargas PA, Lopes MA (2009) Histopathological findings of pleomorphic adenomas of the salivary glands. Med Oral Patol Oral Cir Bucal 14: E57–61. - PubMed
    1. Riad MA, Abdel-Rahman H, Ezzat WF, Adly A, Dessouky O, et al. (2011) Variables related to recurrence of pleomorphic adenomas: outcome of parotid surgery in 182 cases. Laryngoscope 121(7): 1467–1472. - PubMed
    1. Antony J, Gopalan V, Smith RA, Lam AK (2012) Carcinoma ex pleomorphic adenoma: a comprehensive review of clinical, pathological and molecular data. Head Neck Pathol 6(1): 1–9. - PMC - PubMed
    1. Friedrich RE, Li L, Knop J, Giese M, Schmelzle R (2005) Pleomorphic adenoma of the salivary glands: analysis of 94 patients. Anticancer Res 25(3A): 1703–1705. - PubMed

Publication types

MeSH terms