. 2014 Aug 19;12(8):e1001933.
doi: 10.1371/journal.pbio.1001933. eCollection 2014 Aug.

The cytoplasmic capping complex assembles on adapter protein nck1 bound to the proline-rich C-terminus of Mammalian capping enzyme

Affiliations

The cytoplasmic capping complex assembles on adapter protein nck1 bound to the proline-rich C-terminus of Mammalian capping enzyme

Chandrama Mukherjee et al. PLoS Biol. .

Abstract

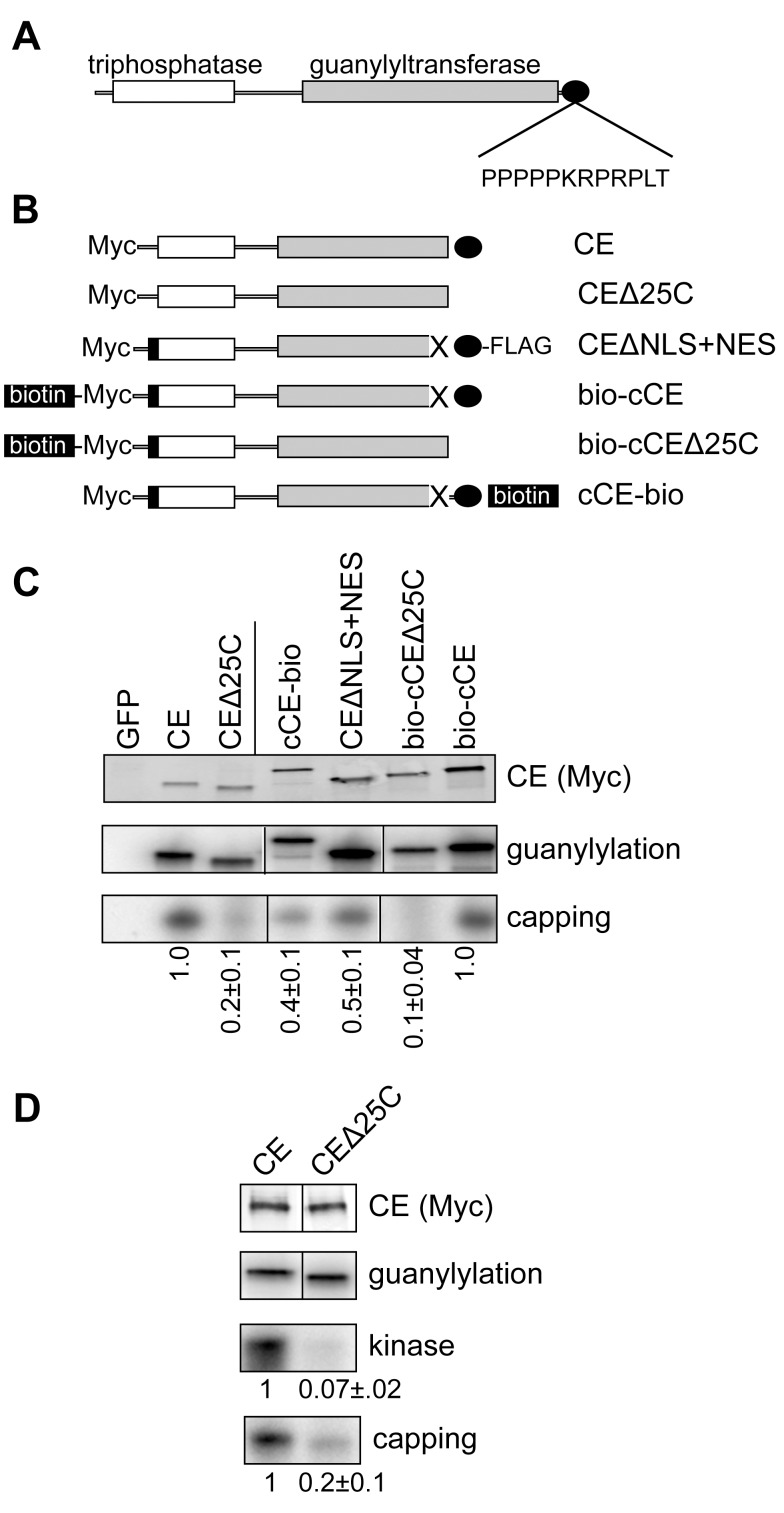
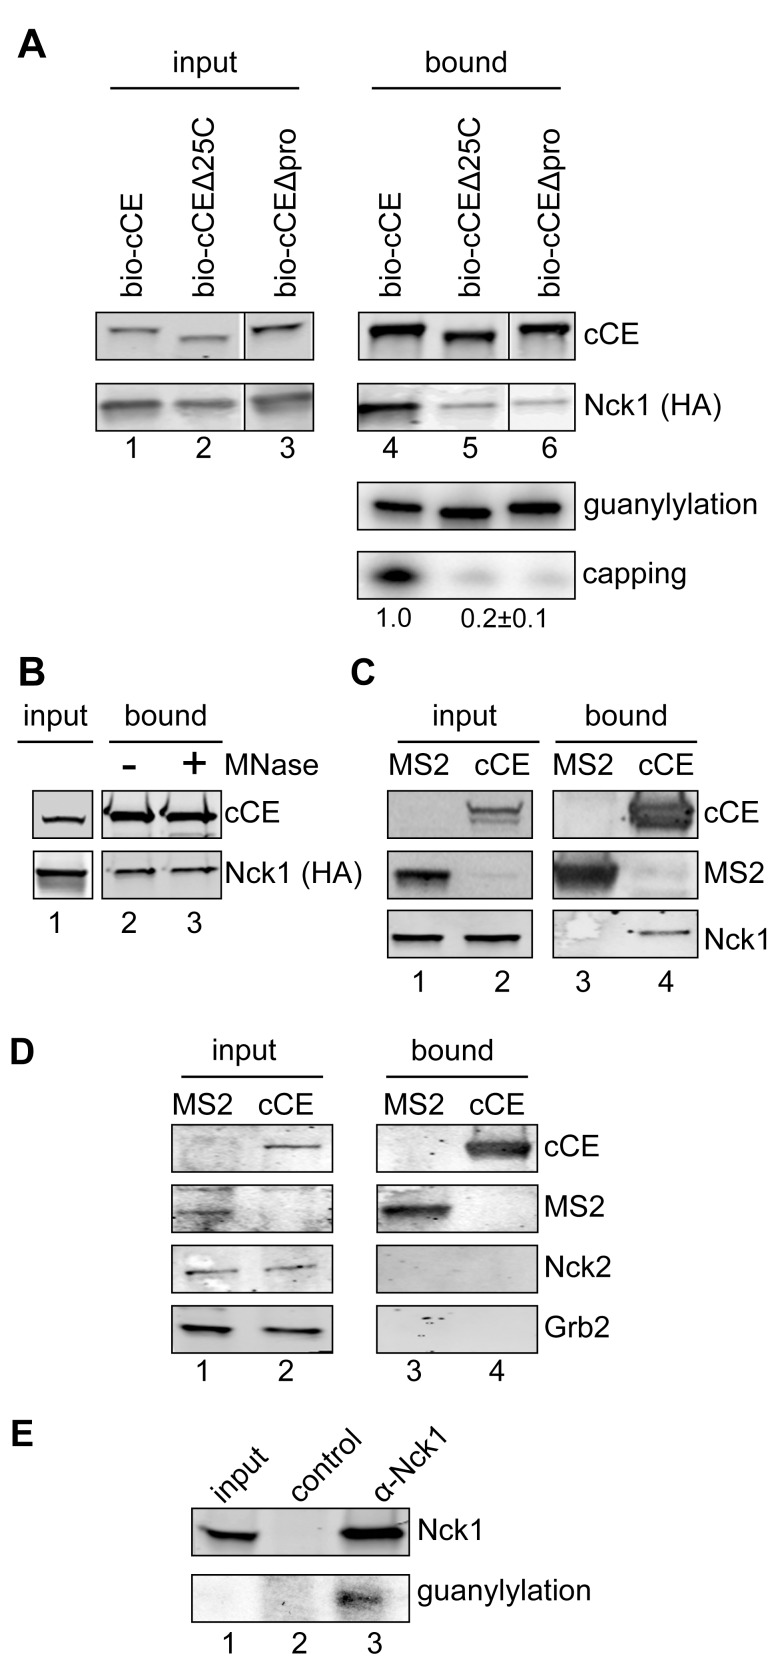
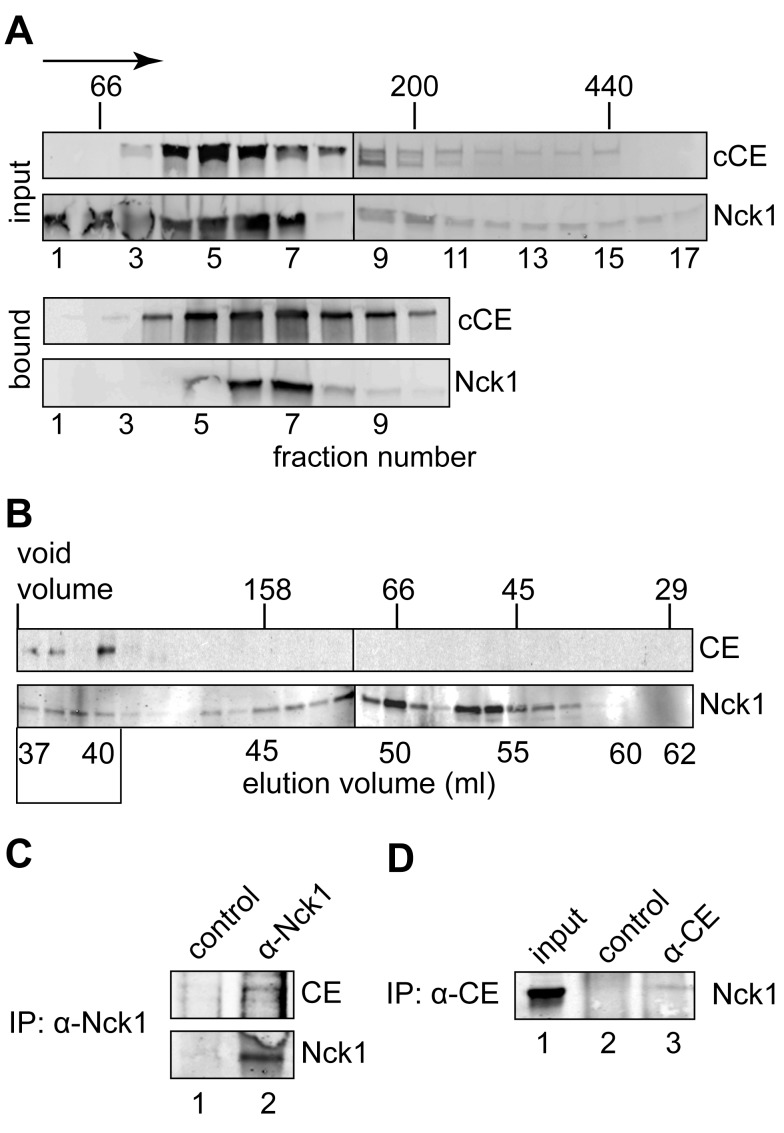
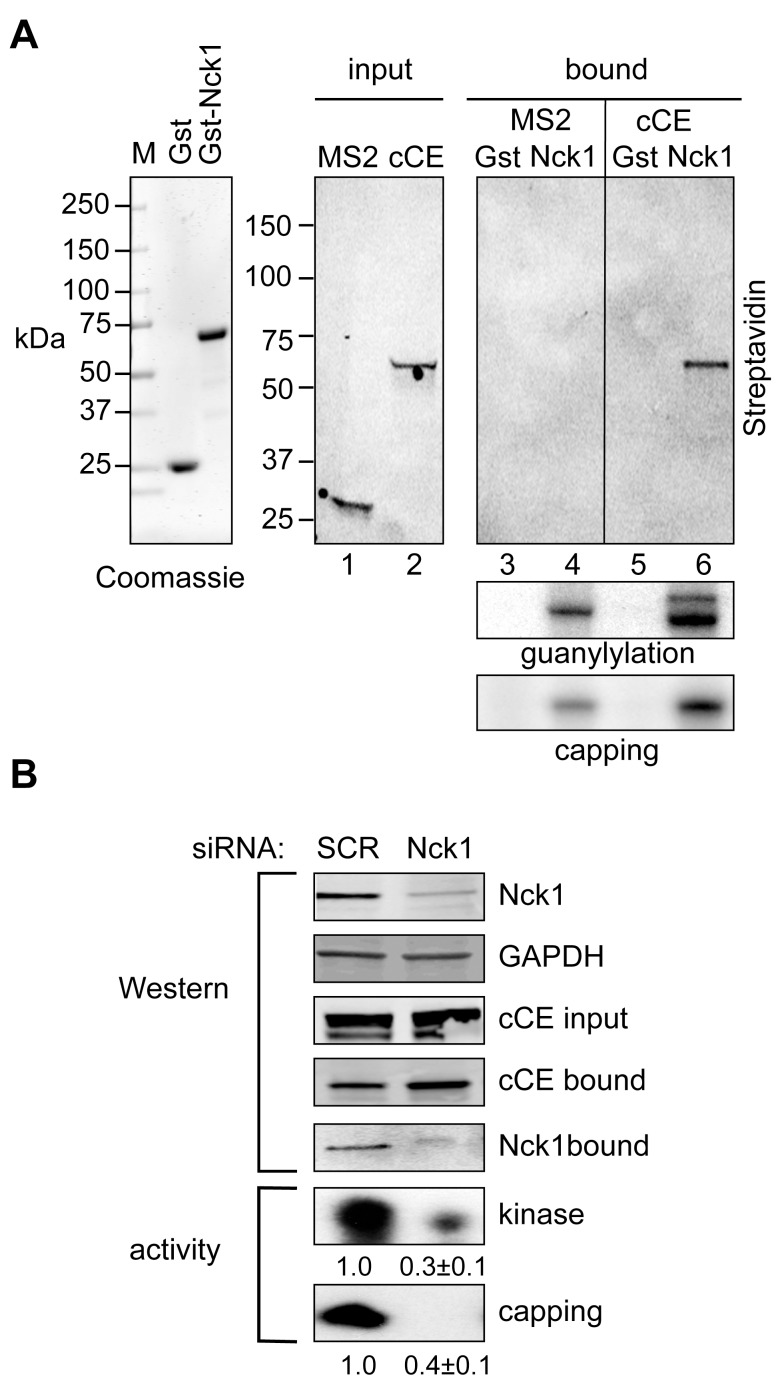
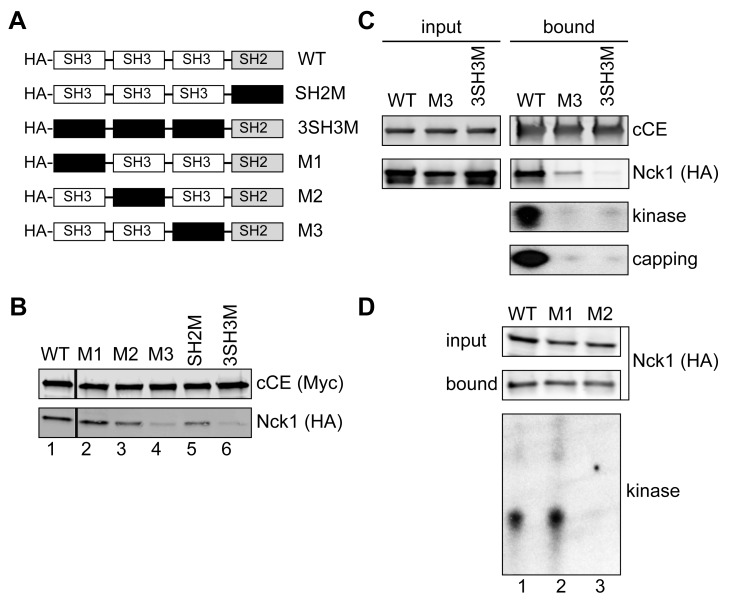
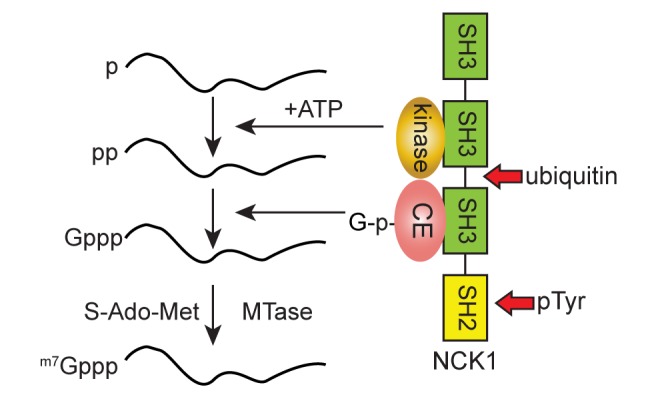
Cytoplasmic capping is catalyzed by a complex that contains capping enzyme (CE) and a kinase that converts RNA with a 5'-monophosphate end to a 5' diphosphate for subsequent addition of guanylic acid (GMP). We identify the proline-rich C-terminus as a new domain of CE that is required for its participation in cytoplasmic capping, and show the cytoplasmic capping complex assembles on Nck1, an adapter protein with functions in translation and tyrosine kinase signaling. Binding is specific to Nck1 and is independent of RNA. We show by sedimentation and gel filtration that Nck1 and CE are together in a larger complex, that the complex can assemble in vitro on recombinant Nck1, and Nck1 knockdown disrupts the integrity of the complex. CE and the 5' kinase are juxtaposed by binding to the adjacent domains of Nck1, and cap homeostasis is inhibited by Nck1 with inactivating mutations in each of these domains. These results identify a new domain of CE that is specific to its function in cytoplasmic capping, and a new role for Nck1 in regulating gene expression through its role as the scaffold for assembly of the cytoplasmic capping complex.


Conflict of interest statement

The authors have declared that no competing interests exist.

Figures

Figure 1
Figure 1. The capping enzyme C-terminus participates in assembly of the cytoplasmic capping complex.
(A) The organization of vertebrate CE is shown with the N-terminal triphosphatase domain indicated in white, the guanylyltransferase domain indicated in grey, and the proline-rich C-terminus indicated by the black oval. The proximity of the proline-rich sequence to the C-terminus is indicated by the sequence of the last 12 amino acids of human CE. (B) The forms of CE used to analyze the impact of C-terminal modifications is shown. In the nomenclature used here CE corresponds to full-length protein with an N-terminal Myc tag. CEΔ25C is the same protein missing the C-terminal 25 amino acids. This deletion includes the NLS. CEΔNLS+NES was described in Otsuka and colleagues and consists of Myc-tagged CE with the NLS deleted (X), a C-terminal FLAG tag and the HIV Rev NES (black box). In bio-cCE the NLS is deleted and a sequence that is biotinylated in vivo is added upstream of Myc tag and Rev NES. In bio-cCEΔ25C the C-terminal 25 amino acids of this protein were deleted. cCE-bio is similar to CEΔNLS+NES except that the C-terminal FLAG tag is replaced with the biotinylation sequence. (C) The plasmids shown in (B) or a plasmid expressing Myc-tagged GFP were transfected into HEK293 cells. GFP or CE and its associated proteins were recovered with anti-Myc beads (CE, CEΔ25C, cCE-bio, and CEΔNLS+NES) or streptavidin beads (bio-cCE and bio-cCEΔ25C). The recovered protein was incubated with α-[32P]GTP and analyzed for the covalent binding of [32P]GMP (guanylylation) , and for [32P]GMP labeling of 5′-monophosphate RNA (capping). The products were separated by denaturing gel electrophoresis and visualized by autoradiography. The amount of capping activity relative to guanylylation activity is shown at the bottom of the figure, with results normalized to either CE or to bio-cCE as indicated by the vertical line. (D) The experiment in (C) was repeated with an additional assay for 5′-kinase activity. The vertical line in the Western blot and guanylylation assay is to indicate that CE and CEΔ25C were separated by empty lanes on each of these gels. In (C and D) the mean ± standard deviation (n = 3) for recovered kinase and capping activity normalized to guanylylation activity is shown beneath each autoradiogram. In each case comparison to matching controls yielded p-value<0.05 by Student's t test.
Figure 2
Figure 2. Identification of Nck1 binding to cytoplasmic CE.
(A) HEK293 cells were co-transfected with plasmids expressing HA-Nck1 and bio-cCE (lanes 1 and 4), bio-cCEΔ25C (lanes 2 and 5), and bio-cCEΔpro in which the five C-terminal prolines shown in Figure 1A were deleted (bio-cCEΔpro, lanes 3 and 6). Protein recovered on streptavidin beads was analyzed by Western blotting with anti-Myc (cCE) and anti-HA (Nck1) antibodies (upper two panels). In the lower two panels the bound complexes were assayed as in Figure 1 for guanylylation and capping activity. The quantified capping activity (mean ± standard deviation, n = 3) for capping assay is shown beneath that autoradiogram. The same results were obtained for each of the modified forms of CE, with p-value<0.05 by Student's t test. (B) Cytoplasmic extract from cells expressing bio-cCE (cCE) and HA-Nck1 was treated ± micrococcal nuclease (MNase) prior to recovery of CE and associated proteins with streptavidin beads. Proteins were analyzed by Western blotting with anti-Myc (cCE) and anti-HA (Nck1) antibodies. (C) HEK293 cells were transfected with plasmids expressing bio-cCE or a protein consisting of two MS2 binding sites fused to the biotinylation sequence present in bio-cCE (MS2-bio) . Proteins recovered on streptavidin beads were analyzed by Western blotting with HRP-streptavidin (bio-cCE and MS2-bio), and with an antibody to endogenous Nck1. (D) The experiment in (C) was repeated except Western blots of recovered proteins were probed with antibodies to Nck2 and Grb2. (E) Cytoplasmic extract was immunoprecipitated with control IgG or anti-Nck1 antibody. 2.5% of input sample and 20% of the immunoprecipitated sample was used for Western blotting to determine Nck1 recovery, and 2.5% of input sample and 70% of the immunoprecipitated sample was assayed by guanylylation to determine CE recovery. The weak guanylylation signal seen in the input sample is due to the presence of a previously described inhibitory activity in cytoplasmic extract.
Figure 3
Figure 3. Identification of Nck1 as a component of the cytoplasmic capping complex.
(A) Cytoplasmic extract from cells expressing bio-cCE was separated on a 10%–50% glycerol gradient. Fractions containing each of these proteins were identified by Western blotting of input fractions with antibodies to the Myc tag on bio-cCE and to Nck1 (upper 2 panels). Streptavidin beads were used to recover bio-cCE from individual fractions and bound proteins were again analyzed by Western blotting with anti-Myc and anti-Nck1 antibodies (lower two panels). (B) Cytoplasmic extract from non-transfected cells was separated on a calibrated Sephacryl S-200 column. Starting with the void volume individual fractions were collected and analyzed by Western blotting with anti-CE and anti-Nck1 antibodies. The missing CE band in fraction 3 was due to sample loss during loading. (C) The fractions indicated with a box at the bottom of (B) were pooled and immunoprecipitated with anti-Nck1 or control IgG. 20% of the immunoprecipitated sample was used for Western blotting with anti-Nck1 antibody and 70% of the immunoprecipitated sample was used for Western blotting with anti-CE antibody. (D) Cytoplasmic extract from non-transfected cells was immunoprecipitated with anti-CE antibody or control IgG, and the recovered proteins were analyzed by Western blotting with anti-Nck1 antibody.
Figure 4
Figure 4. The cytoplasmic capping complex assembles on Nck1.
(A) Gst and Gst-Nck1 were expressed in E. coli and protein purified on glutathione agarose was analyzed by SDS-PAGE stained with Coomassie Blue (left panel). The middle panel is a Western blot using HRP-streptavidin of cytoplasmic extracts of cells that were transfected with plasmids expressing bio-cCE or MS2-bio. Gst- or Gst-Nck1 bound glutathione beads were added to each of these extracts (right panels) and bound proteins were analyzed by Western blotting with HRP-streptavidin (top panel), for guanylylation activity (middle panel), and for capping activity (bottom panel). The single band in guanylylation assay of MS2-bio expressing cells is endogenous CE, the two bands in bio-cCE expressing cells correspond to endogenous CE and bio-cCE. (B) 293 cells were transfected with Nck1 siRNA or a scrambled control and plasmid expressing bio-cCE. The effectiveness of Nck1 knockdown was determined by Western blotting with anti-Nck1 and anti-GAPDH antibodies, and the expression of bio-cCE and its recovery on streptavidin beads was monitored by Western blotting with anti-Myc antibody. The recovery of Nck1 with bio-cCE was determined by Western blotting with anti-Nck1 antibody (upper panels). In the bottom two panels the recovered complexes were assayed for recovery of 5′-kinase activity and capping activity, normalized to bio-cCE recovery, with the mean ± standard deviation (n = 3) shown beneath each autoradiogram. For each of these p-value was <0.05 by Student's t test.
Figure 5
Figure 5. Identification of the CE and 5′-kinase binding domains.
(A) The organization of Nck1 (wild type [WT]) is shown together with a series of plasmids expressing HA-tagged forms with inactivating mutations (black box) in each of the functional domains. (B) HEK293 cells were co-transfected with plasmids expressing the indicated forms of Nck1 and bio-cCE. Protein recovered on streptavidin beads was analyzed by Western blotting with antibodies to the Myc tag on bio-cCE and the HA tag on Nck1. (C) Cells were co-transfected with plasmids expressing bio-cCE and HA-tagged wild type Nck1 (WT) or Nck1 with inactivating mutations in the third SH3 domain (M3) or all 3 SH3 domains (3SH3M). Protein recovered on streptavidin beads was analyzed by Western blotting with Alexafluor800-coupled streptavidin (cCE) and anti-HA (Nck1) antibody. Kinase activity was assayed by incubating the recovered proteins with a 23 nt 5′-monophosphate RNA and γ-[32P]ATP, and capping activity was assayed by incubating recovered proteins with with ATP and α-[32P]GTP. The products of each reaction were separated on a denaturing polyacrylamide/urea gel and visualized by autoradiography. (D) HEK293 cells were transfected with the plasmids expressing HA-tagged forms of wild-type Nck1, or Nck1 with inactivating mutations in the first (M1) and second (M2) SH3 domains. Complexes recovered on anti-HA beads were analyzed by Western blotting (upper panels), and for 5′-kinase activity as in (C).
Figure 6
Figure 6. A functional role for Nck1 in cap homeostasis.
Triplicate cultures of U2OS cells were transfected with plasmids expressing HA-tagged wild-type Nck1, Nck1 mutated in the CE-binding domain (M3), or the 5′-kinase-binding domain (M2). Western blots showing overexpression of each of these proteins are in Figure S4. The appearance of uncapped forms of transcripts in the “capping inhibited” pool (grey bars) was determined by their recovery on streptavidin beads after ligation of an RNA adapter and hybridization to a biotinylated antisense DNA oligonucleotide . Each preparation contained an equal amount of uncapped human β-globin mRNA as an internal control and RNA recovered from M3 (A) and M2 (B) expressing cells was analyzed by qRT-PCR for four transcripts that accumulate uncapped forms in cells that are inhibited for cytoplasmic capping (DNAJB1, ILF2, MAPK1, RAB1A). The results are normalized to the signal from cells expressing wild-type Nck1. RNA from M3 (C) or M2 (D) expressing cells was also analyzed by qRT-PCR for three transcripts of the “uninduced” pool whose steady state levels are reduced when cytoplasmic capping is inhibited (TLR1, NME9, S100Z, black bars), one of the transcripts examined in a and b (MAPK1, grey bars), and a control transcript (BOP1, white bars). The results are presented as fold change with respect to wild-type Nck1 and are presented as mean ± standard deviation. The asterisk (*) indicates p<0.05 by Student's unpaired two-tailed t test.
Figure 7
Figure 7. Model for assembly of the cytoplasmic capping complex.
In this model Nck1 serves as the scaffold for assembly of the cytoplasmic capping complex, with the 5′-kinase and CE juxtaposed by binding to adjacent domains. The ubiquitination site between the second and third SH3 and the SH2 domain for binding tyrosine phosphoproteins (pTyr) are indicated by red arrows. It has yet to be determined how the methyltransferase joins the complex to complete the reaction.

References

    1. Schoenberg DR, Maquat LE (2009) Re-capping the message. Trends Biochem Sci 34: 435–442. - PMC - PubMed
    1. Schoenberg DR, Maquat LE (2012) Regulation of cytoplasmic mRNA decay. Nat Rev Genet 13: 246–259. - PMC - PubMed
    1. Gu M, Lima CD (2005) Processing the message: structural insights into capping and decapping mRNA. Curr Opin Struct Biol 15: 99–106. - PubMed
    1. Ni T, Corcoran DL, Rach EA, Song S, Spana EP, et al. (2010) A paired-end sequencing strategy to map the complex landscape of transcription initiation. Nat Methods 7: 521–527. - PMC - PubMed
    1. Kodzius R, Kojima M, Nishiyori H, Nakamura M, Fukuda S, et al. (2006) CAGE: cap analysis of gene expression. Nat Meth 3: 211–222. - PubMed

Publication types

MeSH terms