

High-resolution mesoscopic fluorescence molecular tomography based on compressive sensing
- PMID: 25137718
- PMCID: PMC5286913
- DOI: 10.1109/TBME.2014.2347284
High-resolution mesoscopic fluorescence molecular tomography based on compressive sensing
Abstract
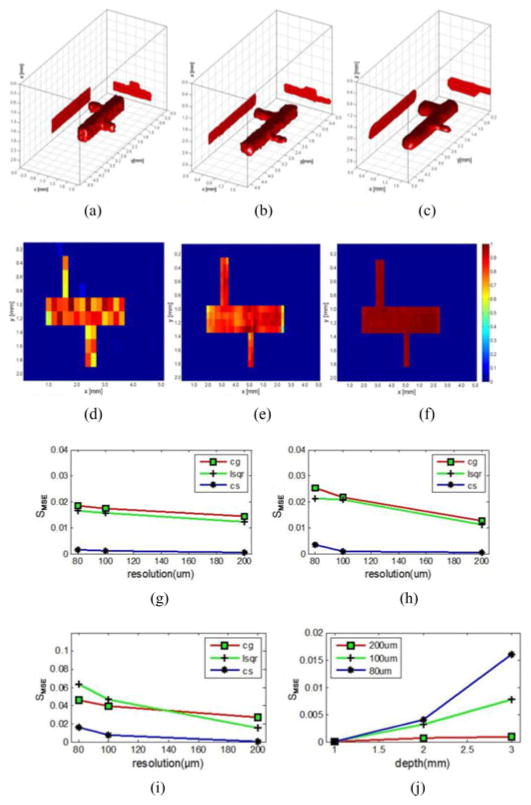
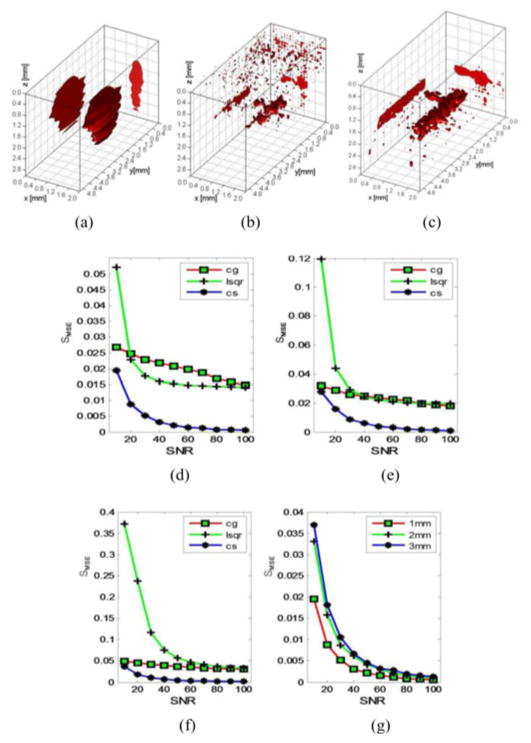
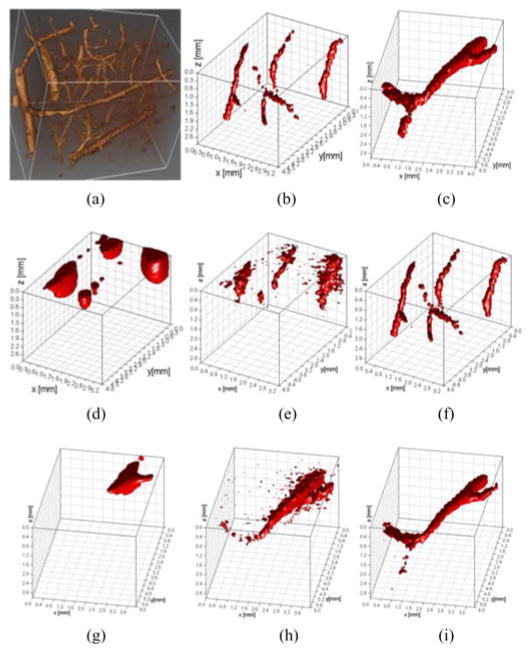
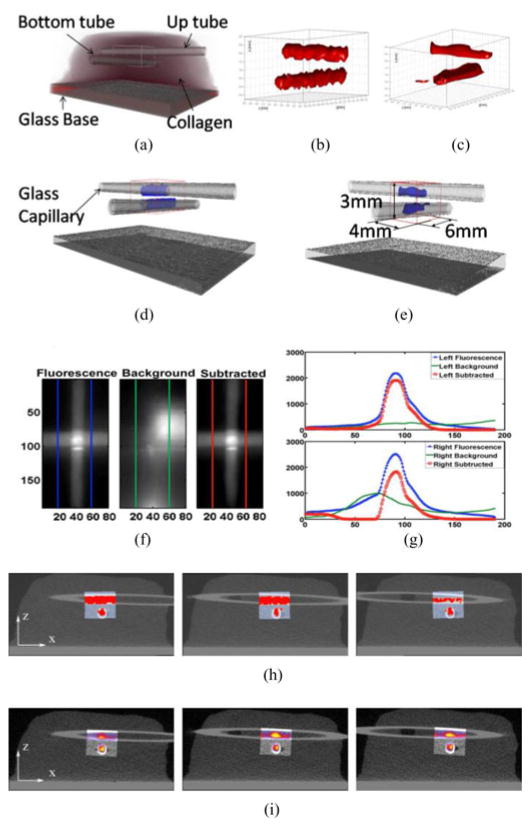
Mesoscopic fluorescence molecular tomography (MFMT) is new imaging modality aiming at 3-D imaging of molecular probes in a few millimeter thick biological samples with high-spatial resolution. In this paper, we develop a compressive sensing-based reconstruction method with l1-norm regularization for MFMT with the goal of improving spatial resolution and stability of the optical inverse problem. Three-dimensional numerical simulations of anatomically accurate microvasculature and real data obtained from phantom experiments are employed to evaluate the merits of the proposed method. Experimental results show that the proposed method can achieve 80 μm spatial resolution for a biological sample of 3 mm thickness and more accurate quantifications of concentrations and locations for the fluorophore distribution than those of the conventional methods.
Figures
Similar articles
-
An efficient numerical method for general L(p) regularization in fluorescence molecular tomography.IEEE Trans Med Imaging. 2010 Apr;29(4):1075-87. doi: 10.1109/TMI.2010.2042814. Epub 2010 Mar 15. IEEE Trans Med Imaging. 2010. PMID: 20236875
-
Fast image reconstruction in fluorescence optical tomography using data compression.Opt Lett. 2010 Mar 1;35(5):763-5. doi: 10.1364/OL.35.000763. Opt Lett. 2010. PMID: 20195345
-
Weighted depth compensation algorithm for fluorescence molecular tomography reconstruction.Appl Opt. 2012 Dec 20;51(36):8883-92. doi: 10.1364/AO.51.008883. Appl Opt. 2012. PMID: 23262629
-
Mesoscopic Optical Imaging of the Pancreas-Revisiting Pancreatic Anatomy and Pathophysiology.Front Endocrinol (Lausanne). 2021 Mar 4;12:633063. doi: 10.3389/fendo.2021.633063. eCollection 2021. Front Endocrinol (Lausanne). 2021. PMID: 33746904 Free PMC article. Review.
-
Optical clearing of unsectioned specimens for three-dimensional imaging via optical transmission and emission tomography.J Biomed Opt. 2008 Mar-Apr;13(2):021113. doi: 10.1117/1.2907968. J Biomed Opt. 2008. PMID: 18465962 Free PMC article. Review.
Cited by
-
Design and characterization of a time-domain optical tomography platform for mesoscopic lifetime imaging.Biomed Opt Express. 2022 Aug 10;13(9):4637-4651. doi: 10.1364/BOE.460216. eCollection 2022 Sep 1. Biomed Opt Express. 2022. PMID: 36187247 Free PMC article.
-
Improving mesoscopic fluorescence molecular tomography through data reduction.Biomed Opt Express. 2017 Jul 28;8(8):3868-3881. doi: 10.1364/BOE.8.003868. eCollection 2017 Aug 1. Biomed Opt Express. 2017. PMID: 28856056 Free PMC article.
-
System configuration optimization for mesoscopic fluorescence molecular tomography.Biomed Opt Express. 2019 Oct 11;10(11):5660-5674. doi: 10.1364/BOE.10.005660. eCollection 2019 Nov 1. Biomed Opt Express. 2019. PMID: 31799038 Free PMC article.
-
Recent methodology advances in fluorescence molecular tomography.Vis Comput Ind Biomed Art. 2018 Sep 5;1(1):1. doi: 10.1186/s42492-018-0001-6. Vis Comput Ind Biomed Art. 2018. PMID: 32240398 Free PMC article. Review.
-
Design and characterization of a dead-time regime enhanced early photon projection imaging system.Rev Sci Instrum. 2018 Apr;89(4):043707. doi: 10.1063/1.5003620. Rev Sci Instrum. 2018. PMID: 29716355 Free PMC article.
References
-
- Hillman EMC, Boas DA, Dale AM, Dunn AK. Laminar optical tomography: Demonstration of millimeter-scale depth-resolved imaging in turbid media. Opt Lett. 2004 Jul;29(14):1650–1652. - PubMed
-
- Yuan S, Li Q, Jiang J, Cable A, Chen Y. Three-dimensional coregistered optical coherence tomography and line-scanning fluorescence laminar optical tomography. Opt Lett. 2009 Jun;34(11):1615–1617. - PubMed
-
- Lee O, Kim JM, Bresler Y, Ye JC. Compressive diffuse optical tomography: Noniterative exact reconstruction using joint sparsity. IEEE Trans Med Imag. 2011 May;30(5):1129–1142. - PubMed
-
- Ye JC, Lee SY, Bresler Y. Exact reconstruction formula for diffuse optical tomography using simultaneous sparse representation. Proc. 5th IEEE Int. Symp. Biomed. Imag; Paris, France. 2008; pp. 1621–1624.
