. 2014 Oct 3;289(40):28006-18.
doi: 10.1074/jbc.M114.589077. Epub 2014 Aug 19.

Rapid binding of plasminogen to streptokinase in a catalytic complex reveals a three-step mechanism

Affiliations

Rapid binding of plasminogen to streptokinase in a catalytic complex reveals a three-step mechanism

Ingrid M Verhamme et al. J Biol Chem. .

Abstract

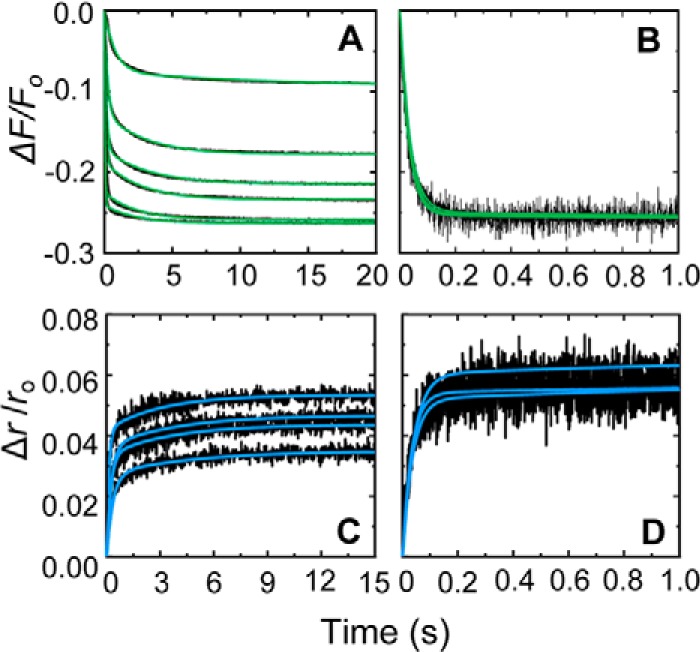
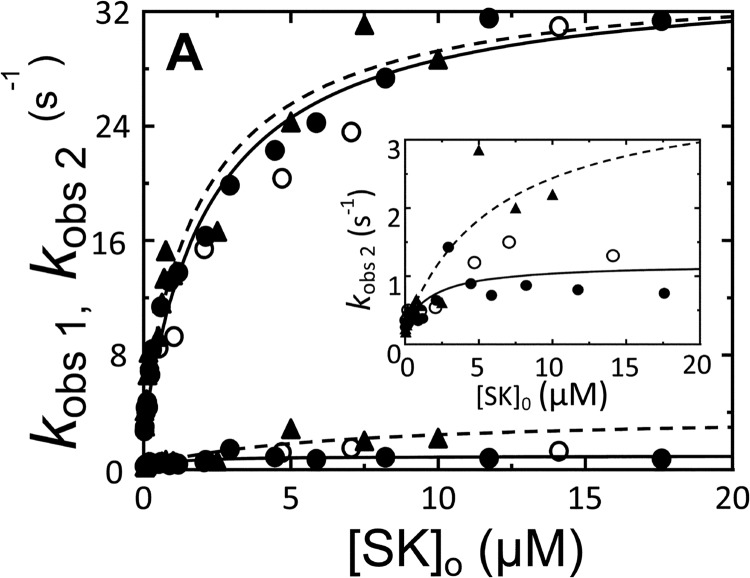
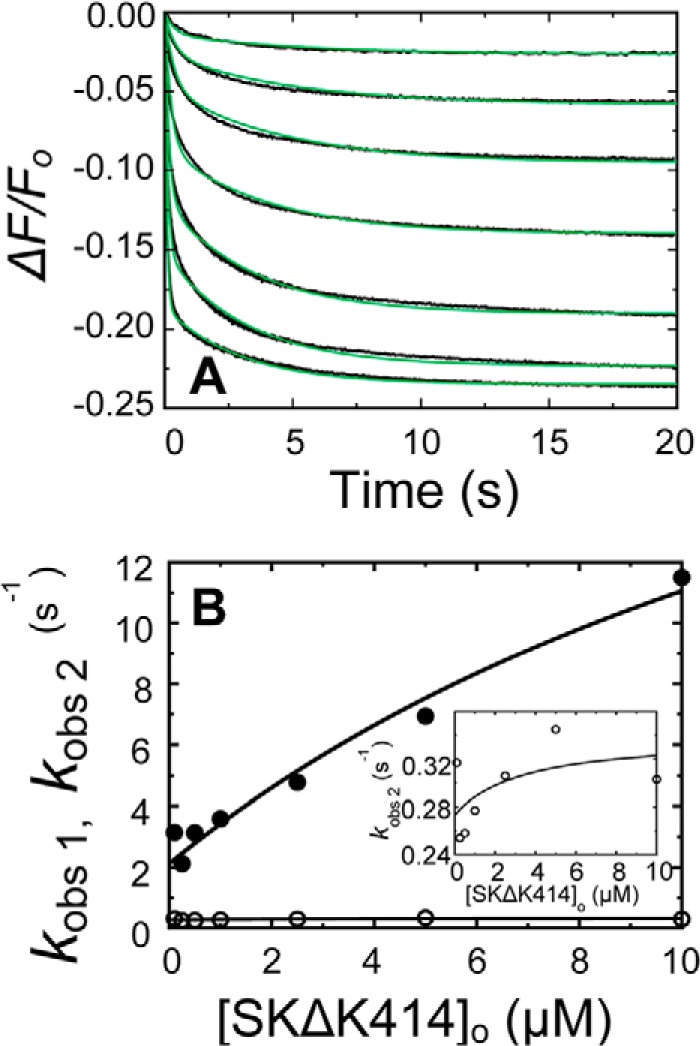
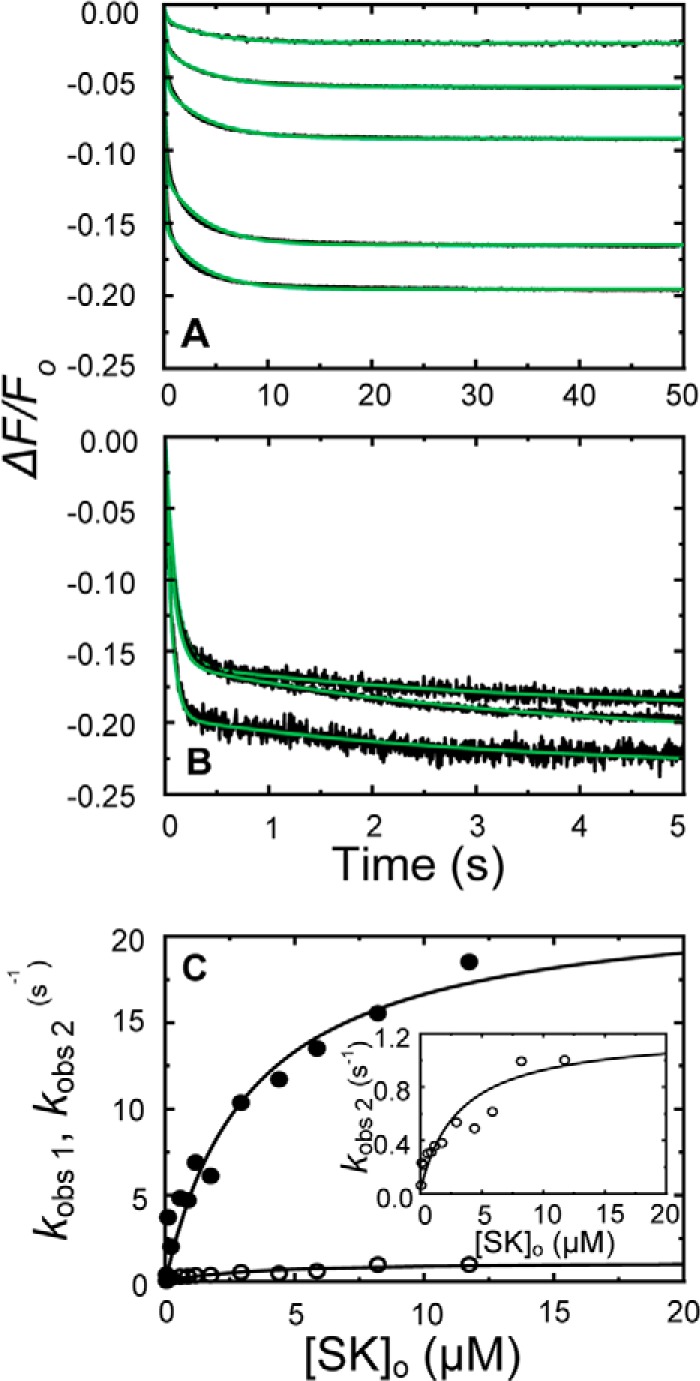
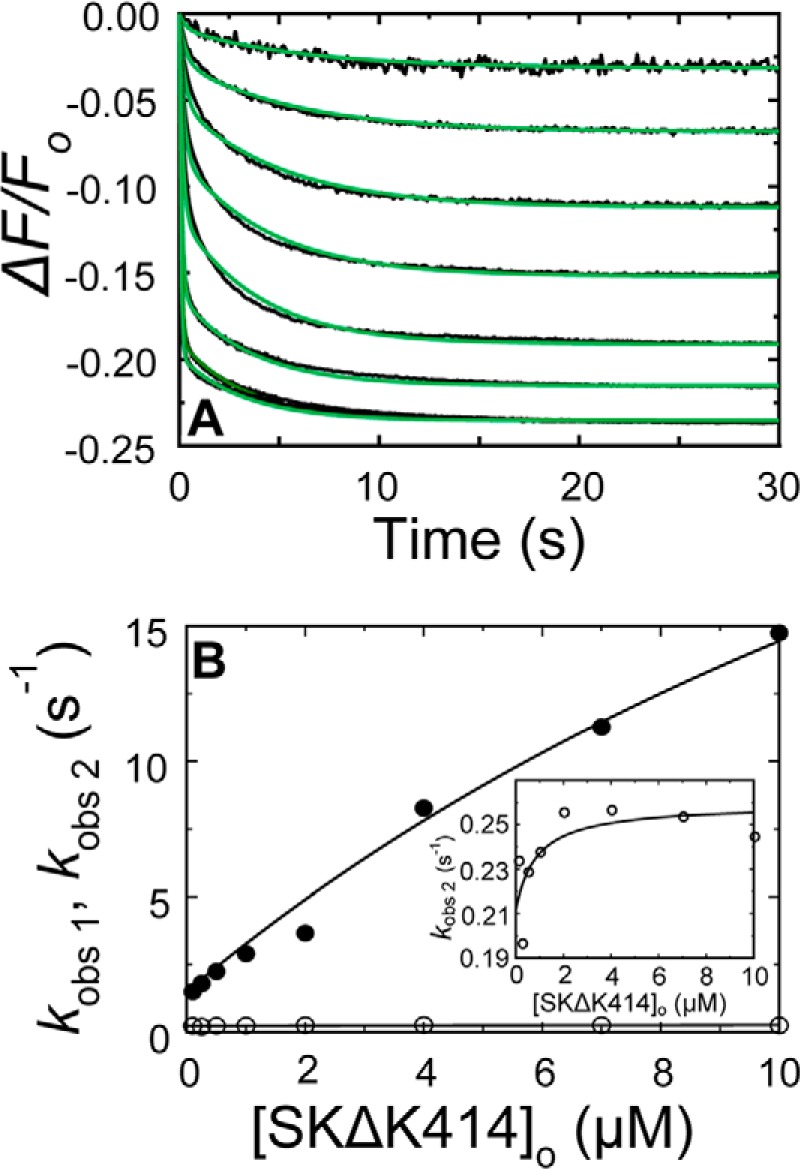
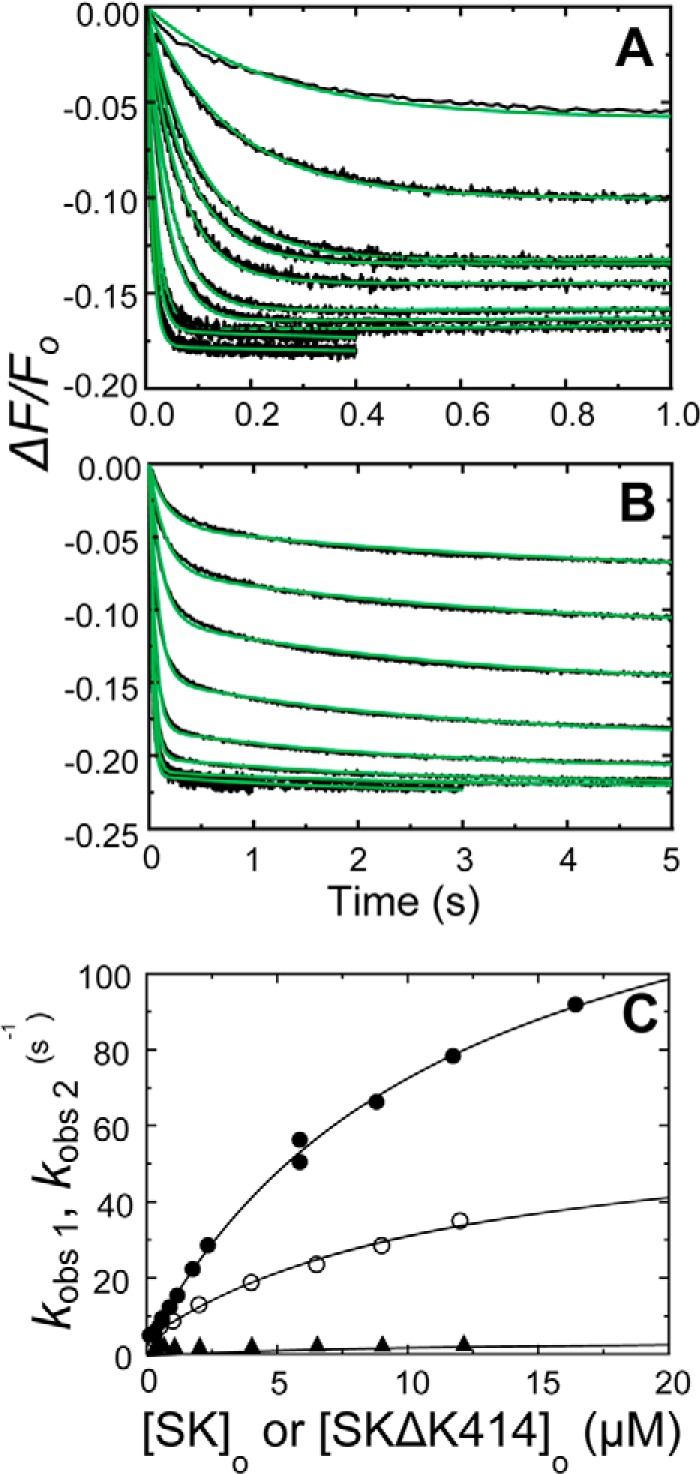
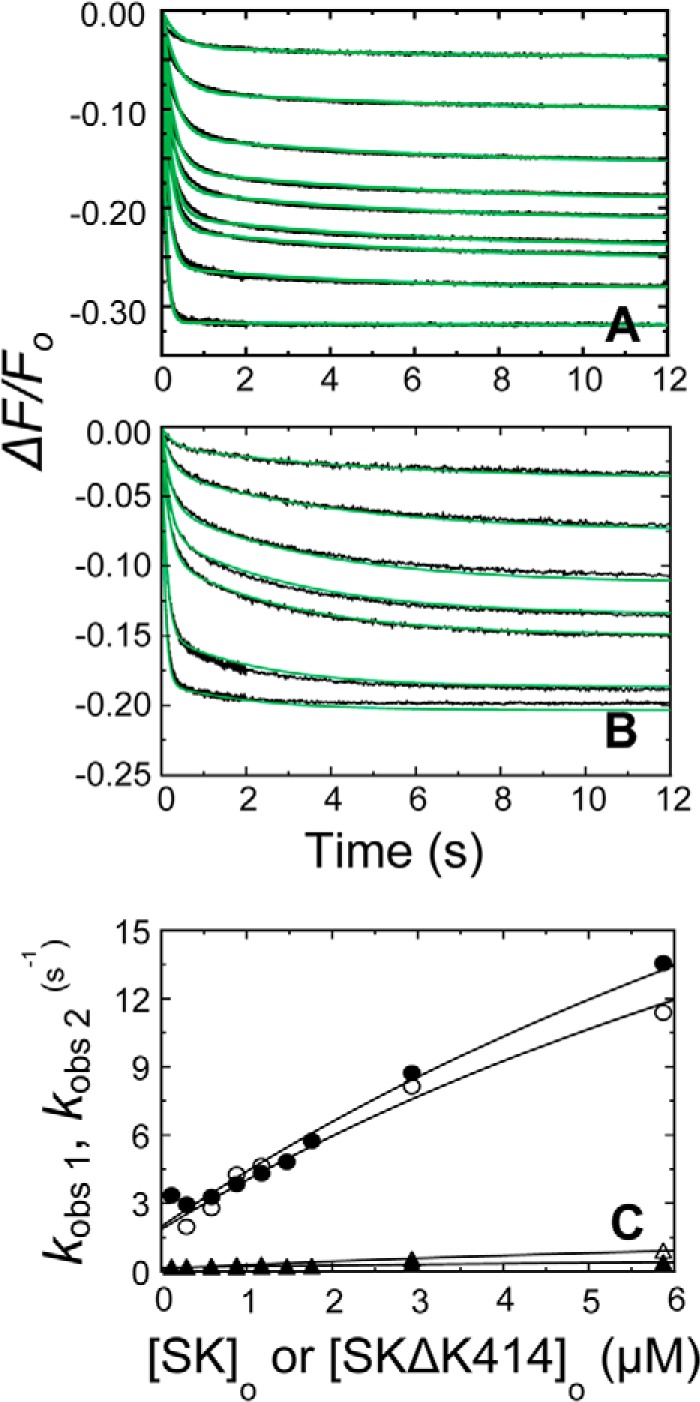
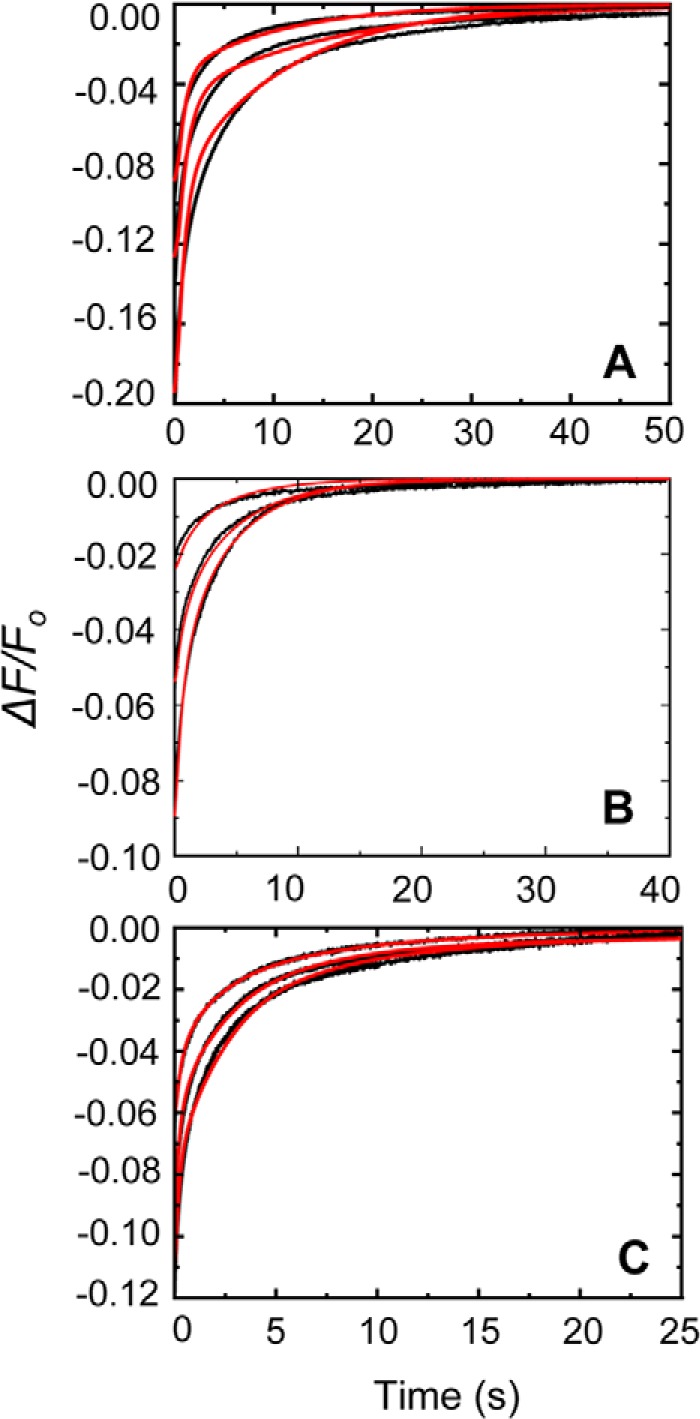
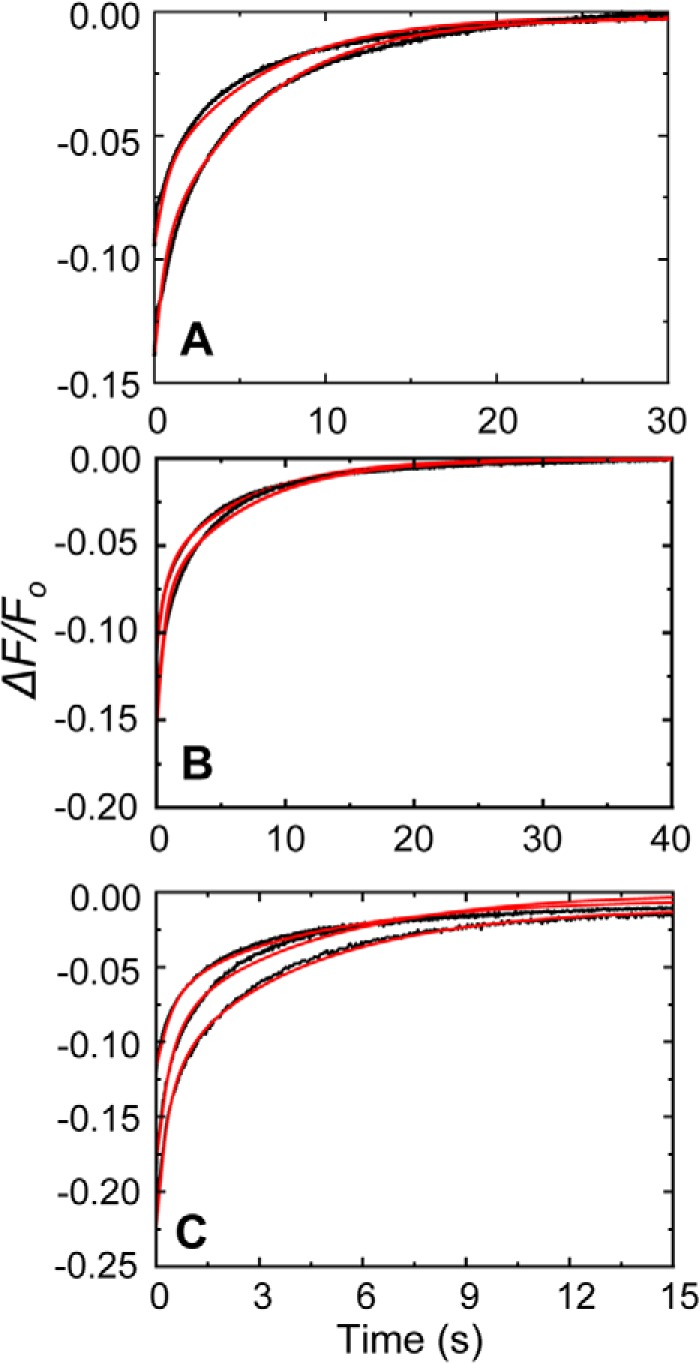
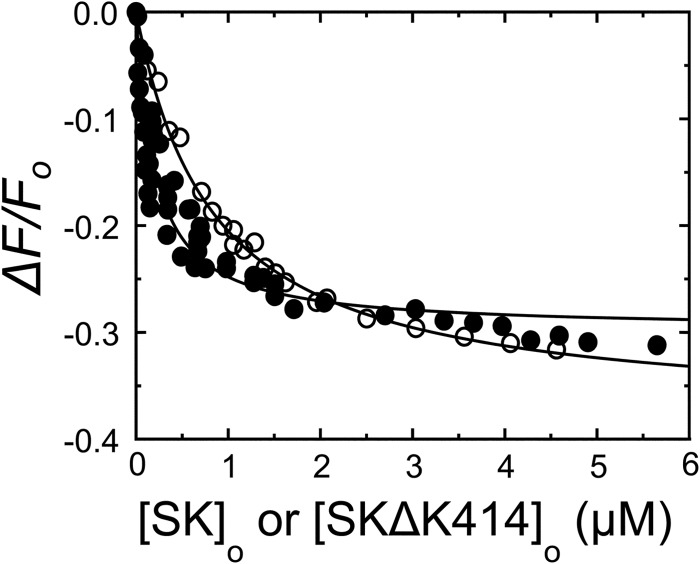
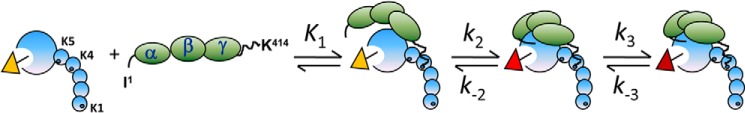
Rapid kinetics demonstrate a three-step pathway of streptokinase (SK) binding to plasminogen (Pg), the zymogen of plasmin (Pm). Formation of a fluorescently silent encounter complex is followed by two conformational tightening steps reported by fluorescence quenches. Forward reactions were defined by time courses of biphasic quenching during complex formation between SK or its COOH-terminal Lys(414) deletion mutant (SKΔK414) and active site-labeled [Lys]Pg ([5-(acetamido)fluorescein]-D-Phe-Phe-Arg-[Lys]Pg ([5F]FFR-[Lys]Pg)) and by the SK dependences of the quench rates. Active site-blocked Pm rapidly displaced [5F]FFR-[Lys]Pg from the complex. The encounter and final SK ·[5F]FFR-[Lys]Pg complexes were weakened similarly by SK Lys(414) deletion and blocking of lysine-binding sites (LBSs) on Pg kringles with 6-aminohexanoic acid or benzamidine. Forward and reverse rates for both tightening steps were unaffected by 6-aminohexanoic acid, whereas benzamidine released constraints on the first conformational tightening. This indicated that binding of SK Lys(414) to Pg kringle 4 plays a role in recognition of Pg by SK. The substantially lower affinity of the final SK · Pg complex compared with SK · Pm is characterized by a ∼ 25-fold weaker encounter complex and ∼ 40-fold faster off-rates for the second conformational step. The results suggest that effective Pg encounter requires SK Lys(414) engagement and significant non-LBS interactions with the protease domain, whereas Pm binding additionally requires contributions of other lysines. This difference may be responsible for the lower affinity of the SK · Pg complex and the expression of a weaker "pro"-exosite for binding of a second Pg in the substrate mode compared with SK · Pm.

Keywords: Bacterial Pathogenesis; Fibrinolysis; Fluorescence; Kinetics; Plasmin; Streptokinase.


Figures

FIGURE 1.
FIGURE 1.
Stopped-flow fluorescence changes of SK binding to [5F]FFR-[Lys]Pg. A and B, the fractional fluorescence intensity changes (ΔF/Fo) following rapid mixing of [5F]FFR-[Lys]Pg and nSK versus time are shown in the absence of lysine analogs at 20 nm [5F]FFR-[Lys]Pg and 0.42, 0.84, 1.58, 3.00, and 5.00 μm nSK (A) and at 10 nm [5F]FFR-[Lys]Pg and 8.2, 11.7, and 17.6 μm nSK (B). C and D, fractional fluorescence anisotropy changes (Δr/ro) are shown for 20 nm [5F]FFR-[Lys]Pg and 0.075, 0.15, 0.20, and 0.52 μm nSK (C) and for 4.7, 7.0, and 14 μm nSK (D). Green and blue solid lines represent the fits from numerical integration with the parameters given in Table 1 as described under “Experimental Procedures.”
FIGURE 2.
FIGURE 2.
SK concentration dependence of the kinetics of [5F]FFR-[Lys]Pg binding in the absence of lysine analogs. Dependences of kobs 1 and kobs 2 (●, nSK, fluorescence intensity; ○, nSK, fluorescence anisotropy; ▴, WT-SK, fluorescence intensity) on [SK]o are shown for binding to 10–20 nm [5F]FFR-[Lys]Pg. The inset shows the kobs 2 dependence on an enlarged scale. Solid and dashed lines represent the least square fits by Equation 2 with the parameters given in Table 1 for the reactions with nSK and WT-SK, respectively.
FIGURE 3.
FIGURE 3.
Kinetics of SKΔK414 binding to [5F]FFR-[Lys]Pg in the absence of lysine analogs. A, the fractional fluorescence intensity changes (ΔF/Fo) following rapid mixing of [5F]FFR-[Lys]Pg and SKΔK414 versus time are shown in the absence of lysine analogs at 20 nm [5F]FFR-[Lys]Pg and 0.1, 0.25, 0.5, 1.0, 2.5, 5.0, and 10 μm SKΔK414. Green solid lines represent the fits from numerical integration as described under “Experimental Procedures.” B, dependences of kobs 1 and kobs 2 (● and ○) on the total SKΔK414 concentration ([SKΔK414]o) are shown for binding to 20 nm [5F]FFR-[Lys]Pg. The inset shows the kobs 2 dependence on an enlarged scale. Solid lines represent the fits by Equation 2 with the parameters given in Table 1. Experiments were performed and analyzed as described under “Experimental Procedures.”
FIGURE 4.
FIGURE 4.
Kinetics of SK binding to [5F]FFR-[Lys]Pg in 50 mm 6-AHA. A and B, the fractional fluorescence intensity changes (ΔF/Fo) following rapid mixing of [5F]FFR-[Lys]Pg and nSK versus time in 50 mm 6-AHA are shown for 20 nm [5F]FFR-[Lys]Pg and 0.10, 0.26, 0.53, 1.53, and 3.06 μm nSK (A) and at 10 nm [5F]FFR-[Lys]Pg and 2.93, 4.40, and 8.21 μm nSK (B). Green solid lines represent the fits from numerical integration as described under “Experimental Procedures.” C, dependences of kobs 1 (●) and kobs 2 (○) on the total nSK concentration ([SK]o) are shown for binding to 10–20 nm [5F]FFR-[Lys]Pg. The inset shows the kobs 2 dependence on an enlarged scale. Solid lines represent the least-squares fits by Equation 2 with the parameters given in Table 1. Experiments were performed and analyzed as described under “Experimental Procedures.”
FIGURE 5.
FIGURE 5.
Kinetics of SKΔK414 binding to [5F]FFR-[Lys]Pg in 50 mm 6-AHA. A, the fractional fluorescence intensity changes (ΔF/Fo) following rapid mixing of [5F]FFR-[Lys]Pg and SKΔK414 versus time in 50 mm 6-AHA are shown for 20 nm [5F]FFR-[Lys]Pg and 0.1, 0.25, 0.5, 1, 2, 4, 7, and 10 μm SKΔK414. Green solid lines represent the fits from numerical integration as described under “Experimental Procedures.” B, dependences of kobs 1 (●) and kobs 2 (○) on the total SKΔK414 concentration ([SKΔK414]o) are shown for binding to 20 nm [5F]FFR-[Lys]Pg. The inset shows the kobs 2 dependence on an enlarged scale. Solid lines represent the least square fits by Equation 2 with the parameters given in Table 1. Experiments were performed and analyzed as described under “Experimental Procedures.”
FIGURE 6.
FIGURE 6.
Kinetics of SK and SKΔK414 binding to [5F]FFR-[Lys]Pg in 50 mm benzamidine. A, the fractional fluorescence intensity changes (ΔF/Fo) following rapid mixing of [5F]FFR-[Lys]Pg and nSK versus time in 50 mm benzamidine are shown for 10 or 15 nm [5F]FFR-[Lys]Pg and 0.12, 0.29, 0.59, 0.88, 1.17, 1.76, 2.34, 5.86, 8.8, 11.73, and 16.42 μm nSK. B. the fractional fluorescence intensity changes (ΔF/Fo) following rapid mixing of [5F]FFR-[Lys]Pg and SKΔK414 versus time in 50 mm benzamidine are shown for 20 nm [5F]FFR-[Lys]Pg and 0.25, 1, 2, 4, 6.5, 9, and 12 μm SKΔK414. Green solid lines represent the fits from numerical integration as described under “Experimental Procedures.” C, dependences of kobs1 (●) on the total nSK concentration ([SK]o) and kobs 1 and kobs 2 (○ and ▴) on the total SKΔK414 concentration ([SKΔK414]o) are shown for binding to 10–20 nm [5F]FFR-[Lys]Pg. Solid lines represent the least square fits by Equation 2 with the parameters given in Table 1. Experiments were performed and analyzed as described under “Experimental Procedures.”
FIGURE 7.
FIGURE 7.
Kinetics of SK binding in the [5F]FFR-[Glu]Pg complex in the absence of lysine analogs and at saturating 6-AHA. A, the fractional fluorescence intensity changes (ΔF/Fo) following rapid mixing of [5F]FFR-[Glu]Pg and nSK versus time in the absence of lysine analogs are shown for 13 or 20 nm [5F]FFR-[Glu]Pg and 0.12, 0.29, 0.59, 0.88, 1.17, 1.47, 1,76, 2.93, and 5.87 μm nSK. B, the fractional fluorescence intensity changes (ΔF/Fo) following rapid mixing of [5F]FFR-[Glu]Pg and nSK versus time in 50 mm 6-AHA are shown for 13 or 20 nm [5F]FFR-[Glu]Pg and 0.12, 0.29, 0.59, 0.88, 1.17, 2.93, and 5.87 μm nSK. Green solid lines represent the fits from numerical integration as described under “Experimental Procedures.” C, dependences of kobs 1 (● and ○) and kobs 2 (▴ and ▵) on the total nSK concentration ([SK]o) are shown for binding to 10–20 nm [5F]FFR-[Glu]Pg in the absence of lysine analogs (filled symbols) and in 50 mm 6-AHA (open symbols). Solid lines represent the least square fits by Equation 2 with the parameters given in Table 1. Experiments were performed and analyzed as described under “Experimental Procedures.”
FIGURE 8.
FIGURE 8.
Competitive dissociation of [5F]FFR-[Lys]Pg from its complex with nSK by FFR-Pm. A, displacement of [5F]FFR-[Lys]Pg from its stabilized complex with nSK by FFR-Pm in the absence of lysine analogs is shown at dead time mixing concentrations of 20 nm [5F]FFR-[Lys]Pg, 0.06 μm nSK, and 0.1 μm FFR-Pm (top); 0.12 μm nSK and 0.2 μm FFR-Pm (middle); and 0.23 μm nSK and 0.4 μm FFR-Pm (bottom). B, displacement of [5F]FFR-[Lys]Pg from its stabilized complex with nSK by FFR-Pm in 50 mm 6-AHA is shown at dead time mixing concentrations of 20 nm [5F]FFR-[Lys]Pg, 0.1 μm nSK, and 0.2 μm FFR-Pm (top); 0.25 μm nSK and 0.3 μm FFR-Pm (middle); and 0.5 μm nSK and 0.6 μm FFR-Pm (bottom). C, displacement of [5F]FFR-[Lys]Pg from its stabilized complex by FFR-Pm in 50 mm benzamidine is shown at dead time mixing concentrations of 20 nm [5F]FFR-[Lys]Pg, 0.1 μm nSK, and 0.2 μm FFR-Pm (top); 0.25 μm nSK and 0.3 μm FFR-Pm (middle); and 0.5 μm nSK and 0.6 μm FFR-Pm (bottom). Red solid lines represent the fits from numerical integration as described under “Experimental Procedures.”
FIGURE 9.
FIGURE 9.
Competitive dissociation of [5F]FFR-[Lys]Pg from its complex with SKΔK414 by FFR-Pm. A. Displacement of [5F]FFR-[Lys]Pg from its stabilized complex with SKΔK414 by FFR-Pm in the absence of lysine analogs is shown at dead time mixing concentrations of 20 nm [5F]FFR-[Lys]Pg, 0.5 μm SKΔK414, and 0.5 μm FFR-Pm (top) and 1.0 μm SKΔK414 and 1.0 μm FFR-Pm (bottom). B, displacement of [5F]FFR-[Lys]Pg from its stabilized complex with SKΔK414 by FFR-Pm in 50 mm 6-AHA is shown at dead time mixing concentrations of 20 nm [5F]FFR-[Lys]Pg, 0.5 μm SKΔK414, and 0.7 μm FFR-Pm (top) and 1 μm SKΔK414 and 1.4 μm FFR-Pm (bottom). C, displacement of [5F]FFR-[Lys]Pg from its stabilized complex with SKΔK414 by FFR-Pm in 50 mm benzamidine is shown at dead time mixing concentrations of 20 nm [5F]FFR-[Lys]Pg, 0.5 μm SKΔK414, and 0.5 μm FFR-Pm (top); 1 μm SKΔK414 and 1.2 μm FFR-Pm (middle); and 2 μm SKΔK414 and 2 μm FFR-Pm (bottom). Red solid lines represent the fits from numerical integration as described under “Experimental Procedures.”
FIGURE 10.
FIGURE 10.
Equilibrium binding of SK and SKΔK414 to [5F]FFR-[Lys]Pg in the presence of benzamidine. The fractional change in fluorescence (ΔF/Fo) of 20 nm [5F]FFR-[Lys]Pg in buffer containing 50 mm benzamidine is plotted as a function of the total nSK (●) or SKΔK414 (○) concentration ([SK]o or [SKΔK414]o). Solid lines represent least square fits of the quadratic equation for binding of a single ligand with the parameters listed in the text and Table 1. Fluorescence titrations were performed and analyzed as described under “Experimental Procedures.”
FIGURE 11.
FIGURE 11.
The three-step mechanism of SK·[5F]FFR-[Lys]Pg catalytic complex formation. [5F]FFR-[Lys]Pg is shown as blue circles in a hypothetical partially extended β-conformation. The five kringle domains are small circles with the LBSs of K1, K4, and K5 as tiny black dimples. The zymogen catalytic domain is the larger blue circle with the activated catalytic site in white locked into its conformation by the fluorescein probe (ocher triangle) covalently attached to the peptide chloromethyl ketone that has alkylated His57 (black stem). SK is shown by three green ovals representing the three β-grasp domains marked α, β, and γ. The NH2 terminus of SK is indicated by I,1 and the COOH-terminal Lys414 is at the end of a long disordered segment (squiggle) of the γ-domain. During formation of the initial SK·Pg encounter complex (governed by K1), Lys414 engages the LBS of K4, whereas the domains of SK are thought to not be fully engaged, and this does not produce a change in fluorescence. The first, tightening, conformational change governed by k2 and k−2 with the largest decrease in fluorescence (red triangle) is shown hypothetically to involve insertion of SK Ile1 into the NH2-terminal binding cleft forming the Asp194 salt bridge and settling of the SK domains into a more ordered arrangement. The last conformational step controlled by k3 and k−3 completes the arrangement of SK domains accompanied by a smaller fluorescence decrease (maroon triangle).

Similar articles

Cited by

References

    1. Collen D., Lijnen H. R. (1995) Molecular basis of fibrinolysis, as relevant for thrombolytic therapy. Thromb. Haemost. 74, 167–171 - PubMed
    1. Deryugina E. I., Quigley J. P. (2012) Cell surface remodeling by plasmin: a new function for an old enzyme. J. Biomed. Biotechnol. 2012, 564259. - PMC - PubMed
    1. Carapetis J. R., Steer A. C., Mulholland E. K., Weber M. (2005) The global burden of group A streptococcal diseases. Lancet Infect. Dis. 5, 685–694 - PubMed
    1. Preziuso S., Laus F., Tejeda A. R., Valente C., Cuteri V. (2010) Detection of Streptococcus dysgalactiae subsp. equisimilis in equine nasopharyngeal swabs by PCR. J. Vet. Sci. 11, 67–72 - PMC - PubMed
    1. Lopardo H. A., Vidal P., Sparo M., Jeric P., Centron D., Facklam R. R., Paganini H., Pagniez N. G., Lovgren M., Beall B. (2005) Six-month multicenter study on invasive infections due to Streptococcus pyogenes and Streptococcus dysgalactiae subsp. equisimilis in Argentina. J. Clin. Microbiol. 43, 802–807 - PMC - PubMed

Publication types

MeSH terms