Meta-Analysis
. 2014 Aug 19;4(8):e004806.
doi: 10.1136/bmjopen-2014-004806.

Targeting intensive versus conventional glycaemic control for type 1 diabetes mellitus: a systematic review with meta-analyses and trial sequential analyses of randomised clinical trials

Affiliations
Meta-Analysis

Targeting intensive versus conventional glycaemic control for type 1 diabetes mellitus: a systematic review with meta-analyses and trial sequential analyses of randomised clinical trials

Pernille Kähler et al. BMJ Open. .

Erratum in

  • Correction.
    [No authors listed] [No authors listed] BMJ Open. 2015 Jun 1;5(6):e004806corr1. doi: 10.1136/bmjopen-2014-004806corr1. BMJ Open. 2015. PMID: 26033940 Free PMC article. No abstract available.

Abstract

Objective: To assess the benefits and harms of targeting intensive versus conventional glycaemic control in patients with type 1 diabetes mellitus.

Design: A systematic review with meta-analyses and trial sequential analyses of randomised clinical trials.

Data sources: The Cochrane Library, MEDLINE, EMBASE, Science Citation Index Expanded and LILACS to January 2013.

Study selection: Randomised clinical trials that prespecified different targets of glycaemic control in participants at any age with type 1 diabetes mellitus were included.

Data extraction: Two authors independently assessed studies for inclusion and extracted data.

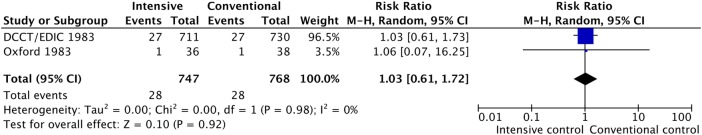
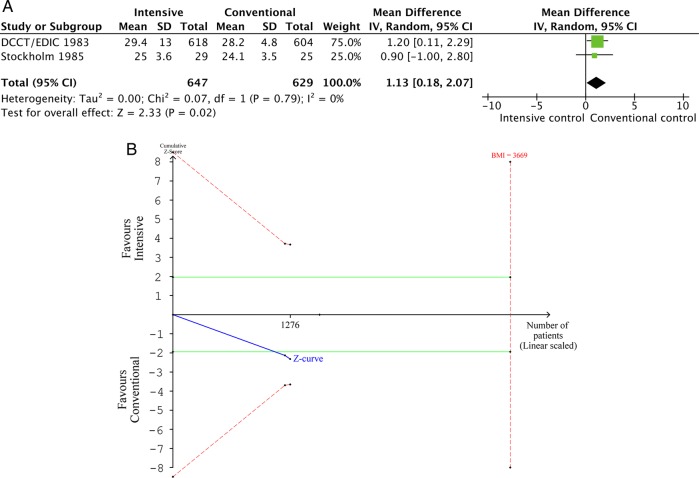
Results: 18 randomised clinical trials included 2254 participants with type 1 diabetes mellitus. All trials had high risk of bias. There was no statistically significant effect of targeting intensive glycaemic control on all-cause mortality (risk ratio 1.16, 95% CI 0.65 to 2.08) or cardiovascular mortality (0.49, 0.19 to 1.24). Targeting intensive glycaemic control reduced the relative risks for the composite macrovascular outcome (0.63, 0.41 to 0.96; p=0.03), and nephropathy (0.37, 0.27 to 0.50; p<0.00001. The effect estimates of retinopathy, ketoacidosis and retinal photocoagulation were not consistently statistically significant between random and fixed effects models. The risk of severe hypoglycaemia was significantly increased with intensive glycaemic targets (1.40, 1.01 to 1.94). Trial sequential analyses showed that the amount of data needed to demonstrate a relative risk reduction of 10% were, in general, inadequate.

Conclusions: There was no significant effect towards improved all-cause mortality when targeting intensive glycaemic control compared with conventional glycaemic control. However, there may be beneficial effects of targeting intensive glycaemic control on the composite macrovascular outcome and on nephropathy, and detrimental effects on severe hypoglycaemia. Notably, the data for retinopathy and ketoacidosis were inconsistent. There was a severe lack of reporting on patient relevant outcomes, and all trials had poor bias control.


Figures

Figure 1
Figure 1
Flow diagram of identification of randomised clinical trials for inclusion.
Figure 2
Figure 2
(A) Forest plot for all-cause mortality, meta-analysis of data to the longest follow-up. (B) Forest plot for all-cause mortality, meta-analysis of data to the end of the intervention period. (C) Trial sequential analysis of all-cause mortality. Trial sequence analysis revealed that only 1.18% (n=1971) of the diversity adjusted required information size of 167 034 participants was accrued so far. The number was calculated based on a proportion of mortality of 1.9% in conventional glucose control group, a relative risk reduction of 10% in the intensive glycaemic group, α=5%, β=20%, and D2=0%. Solid blue line is the cumulative z-score, and it does not cross the horizontal solid green lines, illustrating the conventional level of statistical significance (p=0.05). The cumulative z-score does not cross the trial sequential monitoring boundaries, which cannot be seen on the figure due to lack of data.
Figure 3
Figure 3
(A) Forest plot for cardiovascular mortality, meta-analysis of data to the longest follow-up. (B) Forest plot for cardiovascular mortality, meta-analysis of data to the end of the intervention period.
Figure 4
Figure 4
(A) Forest plot for macrovascular complications, meta-analysis of data to the longest follow-up. (B) Trial sequential analysis of macrovascular complications. Trial sequential analysis revealed that only 3.84% (n=1577) of the diversity adjusted required information size of 41 068 participants was accrued so far. The number was calculated based on a proportion of macrovascular complications of 6.8% in conventional glucose control group, a relative risk reduction of 10% in the intensive glycaemic group, α=5%, β=20%, and D2=0%. Solid blue line is the cumulative z-score, and it crosses the horizontal solid green line, illustrating the conventional level of statistical significance (p=0.05), favouring intensive glycaemic control. The cumulative z-score does not cross the trial sequential monitoring boundaries, which cannot be seen on the figure due to lack of data.
Figure 5
Figure 5
(A) Forest plot for nephropathy, meta-analysis of data to the longest follow-up. (B) Forest plot for nephropathy, meta-analysis of data to the end of the intervention period. (C) Trial sequential analysis of nephropathy. Trial sequential analysis revealed that only 10.4% (n=1635) of the diversity adjusted required information size of 15 721 participants was accrued so far. The number was calculated based on a proportion of nephropathy of 18.8% in conventional glucose control group, a relative risk reduction of 10% in the intensive glycaemic group, α=5%, β=20%, and D2=17%. Solid blue line is the cumulative z-score, and it crosses the horizontal solid green line, illustrating conventional level of statistical significance (p=0.05), favouring intensive glycaemic control. The cumulative z-score does touch the dotted red trial sequential monitoring boundaries after the second trial but returns to a level below the monitoring boundary hereafter.
Figure 6
Figure 6
Forest plot for severe adverse events, meta-analysis of data to the longest follow-up.
Figure 7
Figure 7
(A) Forest plot for severe hypoglycaemia, meta-analysis of data to the longest follow-up. (B) Forest plot for severe hypoglycaemia, meta-analysis of data to the end of the intervention period. (C) Trial sequential analysis of severe hypoglycaemia. Trial sequential analysis revealed that only 2.85% (n=1983) of the diversity adjusted required information size of 69 579 participants was accrued so far. The number was calculated based on a proportion of severe hypoglycaemia of 30.9% in conventional glucose control group, a relative risk reduction of 10% in the intensive glycaemic group, α=5%, β=20%, and D2=5%. Solid blue line is the cumulative z-score, and it crosses the horizontal solid green lines, illustrating the conventional level of statistical significance (p=0.05), favouring conventional glycaemic control. The cumulative z-score touch the traditional line of statistical significance but does not cross the trial sequential monitoring boundaries, which cannot be seen on the figure due to lack of data.
Figure 7
Figure 7
Continued
Figure 8
Figure 8
(A) Forest plot for body mass index, meta-analysis of data to the longest follow-up. (B) Trial sequential analysis of body mass index. Trial sequential analysis revealed that 34.8% (n=1276) of the diversity adjusted required information size of 3667 participants was accrued so far. The number was calculated based on a relative risk reduction of 10% in the intensive glycaemic group, α=5%, β=20%, a mean difference of 1.13 kg/m2 as achieved in the meta-analyses, and D2=0%. Solid blue line is the cumulative z-score, and it crosses the horizontal solid green line, illustrating the conventional level of statistical significance (p=0.05), favouring conventional glycaemic control. The cumulative z-score does not cross the dotted red trial sequential monitoring boundaries.

References

    1. Klein BE, Klein R, McBride PE, et al. Cardiovascular disease, mortality, and retinal microvascular characteristics in type 1 diabetes: Wisconsin epidemiologic study of diabetic retinopathy. JAMA Intern Med 2004;164:1917–24 - PubMed
    1. Lind M, Bounias I, Olsson M, et al. Glycaemic control and incidence of heart failure in 20985 patients with type 1 diabetes: an observational study. Lancet 2011;378:140–6 - PubMed
    1. Danis RP, Davis MD, White N, et al. 10-Year retinopathyoutcomes in the EDIC cohort: effect of the original DCCT treatment group assignment. IOVS 2005
    1. The DCCT Research Group. Adverse events and their association with treatment regimens in the diabetes control and complications trial. Diabetes Care 1995;18:1415–27 - PubMed
    1. Dailey GE, Boden GH, Creech RH, et al. Effects of pulsatile intravenous insulin therapy on the progression of diabetic nephropathy. Metabolism 2000;49:1491–5 - PubMed

Publication types

MeSH terms

LinkOut - more resources