. 2014 Nov;4(11):1299-309.
doi: 10.1158/2159-8290.CD-14-0471. Epub 2014 Aug 19.

Brain tumor cells in circulation are enriched for mesenchymal gene expression

Affiliations

Brain tumor cells in circulation are enriched for mesenchymal gene expression

James P Sullivan et al. Cancer Discov. 2014 Nov.

Abstract

Glioblastoma (GBM) is a highly aggressive brain cancer characterized by local invasion and angiogenic recruitment, yet metastatic dissemination is extremely rare. Here, we adapted a microfluidic device to deplete hematopoietic cells from blood specimens of patients with GBM, uncovering evidence of circulating brain tumor cells (CTC). Staining and scoring criteria for GBM CTCs were first established using orthotopic patient-derived xenografts (PDX), and then applied clinically: CTCs were identified in at least one blood specimen from 13 of 33 patients (39%; 26 of 87 samples). Single GBM CTCs isolated from both patients and mouse PDX models demonstrated enrichment for mesenchymal over neural differentiation markers compared with primary GBMs. Within primary GBMs, RNA in situ hybridization identified a subpopulation of highly migratory mesenchymal tumor cells, and in a rare patient with disseminated GBM, systemic lesions were exclusively mesenchymal. Thus, a mesenchymal subset of GBM cells invades the vasculature and may proliferate outside the brain.

Significance: GBMs are locally invasive within the brain but rarely metastasize to distant organs, exemplifying the debate over "seed" versus "soil." We demonstrate that GBMs shed CTCs with invasive mesenchymal characteristics into the circulation. Rare metastatic GBM lesions are primarily mesenchymal and show additional mutations absent in the primary tumor.


Conflict of interest statement

Disclosure of Conflicts of Interest: The authors declare no potential conflicts of interests.

Figures

Figure 1
Figure 1
Enrichment and detection of CTCs from orthotopic xenograft models of GBM. A, immunohistologic analysis of coronal sections showing mCherry expressing GBM8 and GBM24 tumor xenografts. B, bioluminescence imaging of GBM xenografts (n = 6). C, genome-wide expression of GBM and WBCs identifies tumor specific markers. Left panel: genes plotted by average expression in GBM and WBCs from publically available microarrays (GSE15824: 15 GBM tumors and 5 GBM cell lines; GSE33331: 10 CD14+ monocyte, 5 mature dendrocyte (mDC), 4 eosinophil (Eo), 5 CD19+ B cell (BC), 5 CD4+ and 5 CD8+ T cell (T Cell), 5 CD56+ natural killer T cell (NKC), 3 neutrophil (NE) and 5 plasma dendrocyte (PC) samples). Right panel: an unsupervised hierarchical cluster analysis of the genes expressed two-fold greater in tumor cells versus WBCs. D, expression heatmap of candidate CTC markers in GBM and WBCs. E, bar graph showing the recovery of mCherry+ GBM cells from GBM8 and GBM24 tumor cell spiked blood samples processed through the CTC-iChip (left y-axis) and stained with the STEAM antibody cocktail (right y-axis) (n = 4). F, images of a GBM8 cell and WBC isolated from GBM8 cell line spiked blood processed through the CTC-iChip and stained with DAPI, mCherry and the STEAM cocktail (single color images: x20 magnification, merged image: x40 magnification). Free and WBC bound CD45 antibody-conjugated immunomagnetic beads are shown (black arrows) in the merged immunofluorescence and brightfield images in the bottom panel. G, quantification of mCherry+ cells isolated from sham-operated and GBM8 and GBM24 xenografted mice. The dotted line marks the baseline set for CTC detection based on mCherry, STEAM and CD45 staining of blood analyzed from control mice. H, representative images of a STEAM+/mCherry+ CTC and a CD45-/low WBC isolated from the blood of a mouse bearing a GBM8 xenograft.
Figure 2
Figure 2
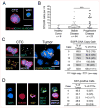
Identification of CTCs in the peripheral blood of GBM patients. A, a representative immunofluorescence image of a STEAM+ CTC alongside a WBC isolated from GBM patient blood. Scale bar = 20 μm. B, quantification of STEAM+ cells in healthy donor samples established a CTC detection threshold of 7 STEAM+ cells per ml. Quantification of STEAM+ cells in 64 blood samples drawn from 21 patients with stable disease and 23 blood samples from 12 patients with progressive disease (***P < 0.001). C, left panels: representative images of a CTC stained with the STEAM antibody cocktail (red) and analyzed by DNA-FISH using probes against centromere 7 (CEP7, green) and EGFR (orange). Center panel: CEP7/EGFR DNA-FISH in matched primary tumor cells from the patient is shown. Right panel: table of the frequency of EGFR-amplified cells in primary tumors (n = 5) and matched STEAM+ CTCs (n = 36). Cells with focal EGFR copy gain (≥ 10 copies) are shaded in grey. Asterisk signifies results from a patient with metastatic GBM, presented in full later in the paper. Scale bar = 20 μm. D, left panels: a STEAM+ CTC (red) expressing nuclear Ki67 (orange). A CD45 stained WBC is shown (green). Right panel: table of the frequency of Ki67+/STEAM+ CTCs (n = 28) and Ki67 positive tumor cells in the matched tumor specimens (n = 5). Scale bar = 20 μm.
Figure 3
Figure 3
Expression analysis of single GBM CTCs and primary tumor cells. A, upper panel: phase contrast/immunofluorescence image a GBM CTC (red), red blood cells and a WBC (green) stained in solution after iChip-enrichment of patient blood (Scale bar = 20 μm). The GBM CTC was picked by microscopy guided single cell isolation. Lower panel: a heatmap of gene expression patterns (normalized to GAPDH) in individual GBM CTCs (n = 15), primary tumor samples (n = 7) and WBCs (n = 3) derived from 7 GBM patients. B, upper panel: an iChip-enriched mCherry+ CTC obtained from mice carrying the GBM8 xenograft (red) prior to isolation for molecular analysis. Lower panel: expression heatmap of single cells isolated from GBM8 and GBM24 neurosphere cultures (n = 8 and 7, respectively), xenografts (n = 8, each) and CTCs (n = 4 and 3, respectively). Scale bar = 20 μm. The genes analyzed by Fluidigm qPCR are shown on the left.
Figure 4
Figure 4
RNA-ISH analysis of GBM xenografts, patient and metastatic primary GBM samples. A, left panel: RNA-ISH of Mesenchymal (M, red) and Neural (N, blue) genes in a coronal section shows the diffuse pattern of the GBM8 xenograft. Center and right panels: H&E and RNA-ISH images of GBM8 tumor cells invading the hippocampal strata. The bar graph on the right shows the percentage of M, N and N/M populations in the total GBM8 xenograft and those invading the hippocampus quantified after RNA-ISH analysis (right panel, n = 3, *P < 0.05). Scale bars = 50 μm. B, left panel: RNA-ISH of a coronal section showing the GBM24 xenograft. Center and right panels: H&E and RNA-ISH images of GBM24 tumor cells invading the hippocampus and residing near necrotic (Ne) foci. Bar graph on the right shows the M, N, and M/N composition of total, hippocampal invading and perinecrotic GBM24 tumor cells (right panel, n = 3, *P < 0.05). Scale bars = 50 μm. C, left panel: H&E of primary tumor sample depicting characteristic tumor necrosis (Ne), adjacent palisading cells (dotted line) and hyper-microvascularization (black arrows). Center panel: RNA-ISH of the same tissue section depicts greater mesenchymal over neural gene expression in perinecrotic tumor cells. Bar graph on the right shows the M, N, and M/N composition of total tumor cells and perinectrotic tumor cells following RNA-ISH analysis of 6 patient biopsies (*P < 0.05). Scale bar = 200 μm. D, left panels: cranial and thoracic MRIs of primary and metastatic tumor (white arrows) from an index patient (Patient 15). Center panels: RNA-ISH images (x10 magnification, x20 magnification inserts) of the primary tumor and metastatic GBM cells surrounding a bronchiole. Bar graph on the right shows quantification of M, N, and M/N tumor cells in the primary tumor, hilar lymph node metastasis (LN met) and lung metastasis. Scale bars = 200 μm. E, upper panel: a diagram of the clonal metastatic spread of GBM derived from the mutational analysis of primary and metastatic sites. Lower panel: depiction of the frequency of specific mutant alleles in each lesion (color coded to diagram in upper panel).

References

    1. Louis DN, Ohgaki H, Wiestler OD, Cavenee WK, Burger PC, Jouvet A, et al. The 2007 WHO classification of tumours of the central nervous system. Acta neuropathologica. 2007;114:97–109. - PMC - PubMed
    1. Omuro A, DeAngelis LM. Glioblastoma and other malignant gliomas: a clinical review. JAMA : the journal of the American Medical Association. 2013;310:1842–50. - PubMed
    1. Smith DR, Hardman JM, Earle KM. Contiguous glioblastoma multiforme and fibrosarcoma with extracranial metastasis. Cancer. 1969;24:270–6. - PubMed
    1. Fidler IJ. The pathogenesis of cancer metastasis: the ‘seed and soil’ hypothesis revisited. Nature reviews Cancer. 2003;3:453–8. - PubMed
    1. Yu M, Stott S, Toner M, Maheswaran S, Haber DA. Circulating tumor cells: approaches to isolation and characterization. The Journal of cell biology. 2011;192:373–82. - PMC - PubMed

Publication types

Substances