. 2014 Oct 30;124(18):2834-46.
doi: 10.1182/blood-2013-07-517219. Epub 2014 Aug 18.

Inhibition of leukemia cell engraftment and disease progression in mice by osteoblasts

Affiliations

Inhibition of leukemia cell engraftment and disease progression in mice by osteoblasts

Maria Krevvata et al. Blood. .

Abstract

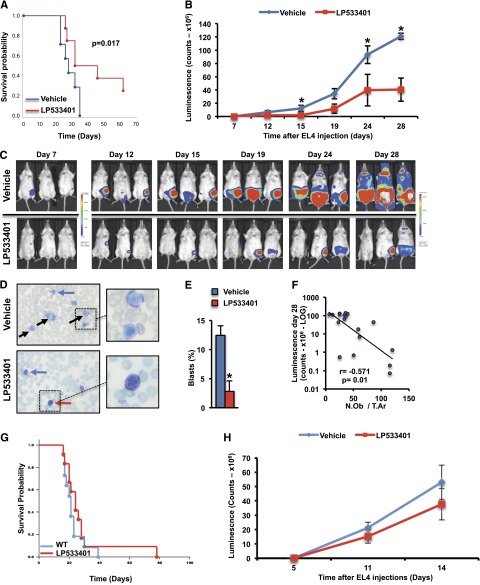
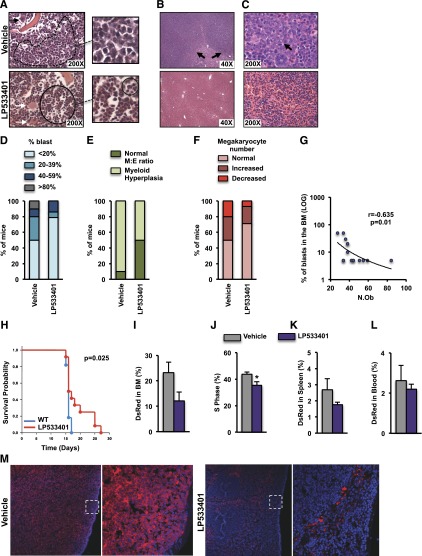
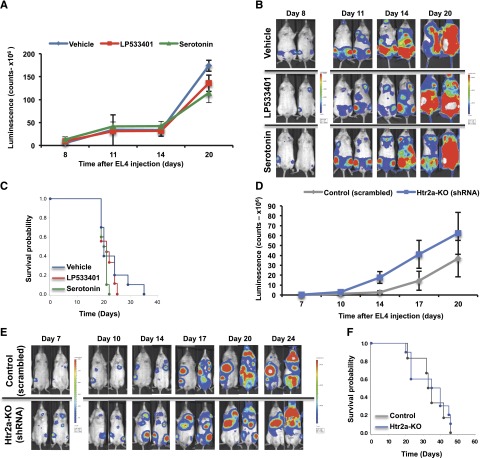
The bone marrow niche is thought to act as a permissive microenvironment required for emergence or progression of hematologic cancers. We hypothesized that osteoblasts, components of the niche involved in hematopoietic stem cell (HSC) function, influence the fate of leukemic blasts. We show that osteoblast numbers decrease by 55% in myelodysplasia and acute myeloid leukemia patients. Further, genetic depletion of osteoblasts in mouse models of acute leukemia increased circulating blasts and tumor engraftment in the marrow and spleen leading to higher tumor burden and shorter survival. Myelopoiesis increased and was coupled with a reduction in B lymphopoiesis and compromised erythropoiesis, suggesting that hematopoietic lineage/progression was altered. Treatment of mice with acute myeloid or lymphoblastic leukemia with a pharmacologic inhibitor of the synthesis of duodenal serotonin, a hormone suppressing osteoblast numbers, inhibited loss of osteoblasts. Maintenance of the osteoblast pool restored normal marrow function, reduced tumor burden, and prolonged survival. Leukemia prevention was attributable to maintenance of osteoblast numbers because inhibition of serotonin receptors alone in leukemic blasts did not affect leukemia progression. These results suggest that osteoblasts play a fundamental role in propagating leukemia in the marrow and may be a therapeutic target to induce hostility of the niche to leukemia blasts.


Figures

Figure 1
Figure 1
Acute leukemia decreases osteoblast numbers and function in humans and in mice. (A) Osteoblast number per trabecular bone area (N.Ob/T.Ar) in bone biopsies of 21 male subjects with AML or MDS, and 21 sex- and age-matched healthy controls. (B) Serum osteocalcin levels in a subset of 9 AML/MDS untreated subjects and 9 matched controls. (C-F) Representative vertebral section images from 2-month-old immunocompetent BALB/c or albino C57BL/6 mice injected with the myeloid-monocytic WEHI-3B (n = 8-10 mice per group) (C) or the lymphoblastic EL4 (n = 5-7 mice per group) (D) leukemia cells, respectively. Mineralized bone matrix is stained in black by Von Kossa reagent. Images at ×50. Serum levels of osteocalcin (E) and cross-linked C-telopeptide (CTX) (F) in WT animals and leukemic mice injected with WEHI-3B cells (n = 8-10 mice per group). *P < .05 vs normal control or WT mice. BFR, bone formation rate; BV/TV, bone volume per trabecular volume; N.Ob/T.Ar, number of osteoblasts per trabecular area; Oc.S./B.S., osteoclast surface per bone surface.
Figure 2
Figure 2
Increased leukemia blast infiltration in DTAosb mice. (A-C, E-I) Syngeneic 2-month-old C57BL/6 WT or DTAosb mice were injected with EL4-GFP-Luc cells and leukemia progression was assessed with an in vivo imaging system. (A, B) Luminescence intensity was quantified in the whole body at different time points (A) and shown here in representative images (B). (C) Overall survival of male WT and DTAosb mice (A-C, n = 9-11 mice per group). (D) Overall survival of female WT and DTAosb mice (D, n = 4 DTAosb and n = 10 WT mice per group) measured in a separate experiment performed as described for panels A-C. (E) Hematoxylin and eosin (H&E) staining of bone marrow sections. The area depicted by solid line represents normal bone marrow, with evidence of trilineage hematopoiesis, whereas areas delineated by dotted lines indicate blast infiltrates. Right panels show inset magnifications of indicated areas. Black arrows indicate isolated blasts. (F) Wright staining of blood smears. Blasts with fine chromatin and prominent nucleoli are seen in DTAosb mice. Blue arrow indicates normal neutrophil, whereas black arrow indicates a blast. (G) H&E staining of liver sections. Arrows indicate blast infiltrates. (H) Representative flow cytometry plots and percentage of MLL-AF9 cells in the bone marrow. (I) Representative flow cytometry plots and percentage of marrow MLL-AF9 cells in G2/M phase. (J) Representative flow cytometry plots and percentage of MLL-AF9 cells in the spleen. (K) Spleen weight over total body weight in leukemic mice. (L) Immunofluorescence staining of spleen sections showing DsRed-MLL-AF9 cells, CD45-expressing (green) cells, and 4,6-diamidino-2-phenylindole nuclei staining (blue). Left panel (×10); right small panels (×63). (M) Survival probability of male and female WT and DTAosb mice injected with MLL-AF9 cells (n = 11 DTAosb and n = 10 WT mice). (D-F, n = 5-6 mice per group; G-L, n = 3 mice in WT group and n = 4 mice in DTAosb group). *P < .05 vs WT mice.
Figure 3
Figure 3
Deregulated hematopoiesis in DTAosb mice. (A) Whole bone marrow mononuclear cells collected by crushing 1 femur and tibia of 2-month-old WT and DTAosb mice. (B-E) Flow cytometry analysis of bone marrow cells showing representative images and percentage of LSK cells (B), myeloid cell population (CD11b+/Gr1+) (C), mature (B220+/IgM+) and immature (B220+/IgM) B-lymphopoietic subsets (D), and erythroid progenitors (Ter119+) in the bone marrow (E). (F-G) Syngeneic 2-month-old C57BL/6 WT or DTAosb mice were injected with MLL-AF9 cells and harvested 14 days after injection. Flow cytometry analysis of bone marrow showing representative plots and percentage of LSK cells in the S-phase (F) and percentage of LT-LSK and ST-LSK cells (G). (A-E = 11-14 mice per group; F-G, n = 3 mice in WT group and n = 4 mice in DTAosb group). *P < .05 vs WT mice. LT-LSK, long-term LSK.
Figure 4
Figure 4
Increased osteoblast numbers suppress acute lymphoblastic leukemia. Syngeneic 2-month-old albino C57BL/6 mice were treated orally with LP533401 (200 mg/kg of body weight per day) or vehicle for 15 days and then injected with EL4-GFP-Luc cells. (A) Overall survival of mice treated with LP533401 or vehicle. (B) Whole body luminescence counts assessing leukemia progression. (C) Representative whole body luminescence images. (D) Wright staining of blood smears. Black arrows indicate blasts, blue arrows indicate normal neutrophils, and red arrow indicates lymphocyte. Right panels show inset magnifications of blasts. (E) Percentage of blasts (mean ± standard error of the mean) counted in a total count of 50 cells in peripheral blood smears. (F) Correlation between osteoblast numbers and leukemia tumor burden assessed by luminescence quantification on day 28 (n = 9 mice per group). Overall survival (G) and whole body luminescence counts (H) in syngeneic 2-month-old albino C57BL/6 mice treated orally with LP533401 (200 mg/kg of body weight per day) 1 day following injection with EL4-GFP-Luc cells (n = 10-11 mice per group). *P < .05 vs vehicle-treated mice.
Figure 5
Figure 5
Increased osteoblast numbers suppress AML. (A-G) BALB/c mice at 2 months of age were treated orally, with either vehicle or LP533401 (25 mg/kg of body weight per day), for 4 weeks. WEHI-3B cells were injected on day 14 following the beginning of the treatment. (A-C) H&E staining of sections showing blast infiltration (dotted line) in the marrow of vehicle-treated but normal myeloid and erythroid maturation (continuous line) in the marrow of LP533401-treated mice (inset magnifications of blasts and normal bone marrow are shown in the right panels, and normal megakaryocytes are indicated by white arrows) (A), extensive blast infiltration (black arrows) in the liver of vehicle-treated mice but normal liver morphology in LP533401-treated mice (B), and diffuse blast infiltration of splenic red pulp in vehicle-treated mice (black arrow) but normal red pulp with normal megakaryocytes (white arrow) and myeloid and erythroid colonies in LP533401-treated mice (C). (D-F) Frequency of blast infiltration (D), myeloid hyperplasia (E), and megakaryocyte numbers (F) in the bone marrow of mice treated with vehicle or LP533401 (A-F, n = 10-14 mice per group). (G) Correlation of osteoblast numbers with marrow leukemic blast percentage (n = 7-8 mice per group). (H-M) Syngeneic 2-month-old albino C57BL/6 mice were treated orally with LP533401 (200 mg/kg of body weight per day) or vehicle for 7 days and then injected with DsRed-MLL-AF9 cells and euthanized 12 days following injection. (H) Overall survival of leukemic mice treated with LP533401 or vehicle (n = 12 mice per group). Percentage of MLL-AF9 cells (I) and percentage of MLL-AF9 cells in the S1 phase (J). Percentage of MLL-AF9 cells in the spleen (K) and blood (L). (M) Immunofluorescence staining of spleen sections showing DsRed-MLL-AF9 cells and 4,6-diamidino-2-phenylindole staining (blue) (I-J, n = 5 mice per group). *P < .05 relative to WT vehicle.
Figure 6
Figure 6
LP533401 hinders leukemia by osteoblast-specific, leukemic blast–independent actions. (A-C) Albino C57BL/6 mice were injected at 2 months of age with EL4-GFP-Luc cells pretreated with serotonin, LP533401, or vehicle for 24 hours. Luminescence intensity at different time points (A), whole body luminescence representative images (B), and overall survival (C) (A-C, n = 9-10 mice per group). (D-F) EL4 cells were infected with either Htr2a shRNA or scrambled shRNA oligos and injected into albino C57BL/6 mice at 3 months of age. Tumor burden and survival were assessed: Luminescence intensity at different time points (D), whole body luminescence images (E), and overall survival (F) (D-F, n = 6-10 mice per group). shRNA, short hairpin RNA.
Figure 7
Figure 7
Osteoclasts do not affect leukemia progression. Albino C57BL/6 mice were treated at 2 months of age subcutaneously with 10 mg/kg of murine RANK-muFc or vehicle 3 times per week. In leukemic animals, the treatment started 2 days prior to EL4 cell injection and continued until the time of death. Healthy mice were treated for 4 weeks. Serum levels of osteocalcin (A) and C-telopeptide (CTX) (B), and bone mineral density (BMD) at the spine (C) and femur (D) in WT and leukemic mice treated with either RANK-Fc or vehicle. (E) TRAP+ osteoclasts (black arrows) in spine sections of WT and leukemic mice treated with RANK-Fc or vehicle. (F) Whole body luminescence counts. (G) Representative in vivo images showing leukemia progression. (H) Survival probability in mice injected with EL4 cells and treated with either RANK-Fc or vehicle (n = 4-7 mice per group). *, #,❖P < .05 (*, relative to WT vehicle; #, relative to WT LP533401; and ❖, relative to leukemia vehicle). ND, not detected.

Comment in

References

    1. Dennis JE, Charbord P. Origin and differentiation of human and murine stroma. Stem Cells. 2002;20(3):205–214. - PubMed
    1. Lévesque JP, Helwani FM, Winkler IG. The endosteal ‘osteoblastic’ niche and its role in hematopoietic stem cell homing and mobilization. Leukemia. 2010;24(12):1979–1992. - PubMed
    1. Oh IH, Kwon KR. Concise review: multiple niches for hematopoietic stem cell regulations. Stem Cells. 2010;28(7):1243–1249. - PubMed
    1. Nilsson SK, Johnston HM, Coverdale JA. Spatial localization of transplanted hemopoietic stem cells: inferences for the localization of stem cell niches. Blood. 2001;97(8):2293–2299. - PubMed
    1. Méndez-Ferrer S, Michurina TV, Ferraro F, et al. Mesenchymal and haematopoietic stem cells form a unique bone marrow niche. Nature. 2010;466(7308):829–834. - PMC - PubMed

Publication types

MeSH terms