. 2015 Nov;220(6):3513-36.
doi: 10.1007/s00429-014-0870-1. Epub 2014 Aug 20.

Cerebellar control of gait and interlimb coordination

Affiliations

Cerebellar control of gait and interlimb coordination

María Fernanda Vinueza Veloz et al. Brain Struct Funct. 2015 Nov.

Abstract

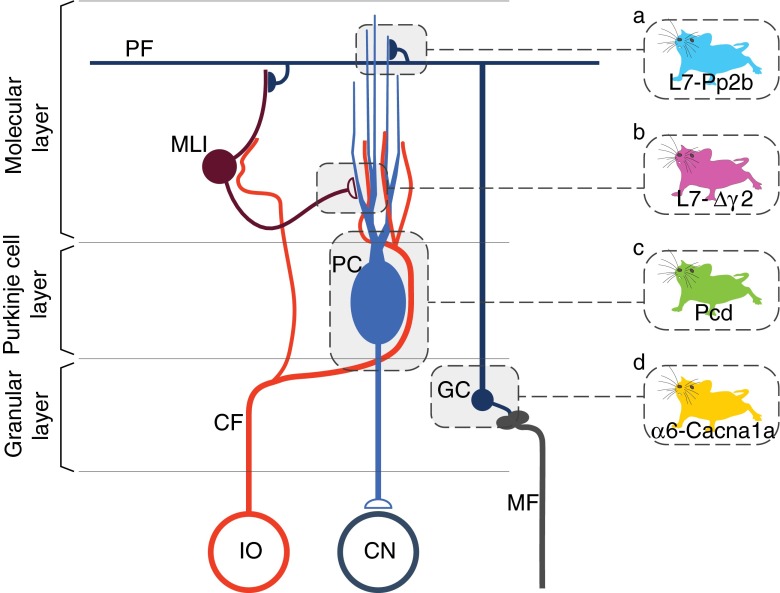
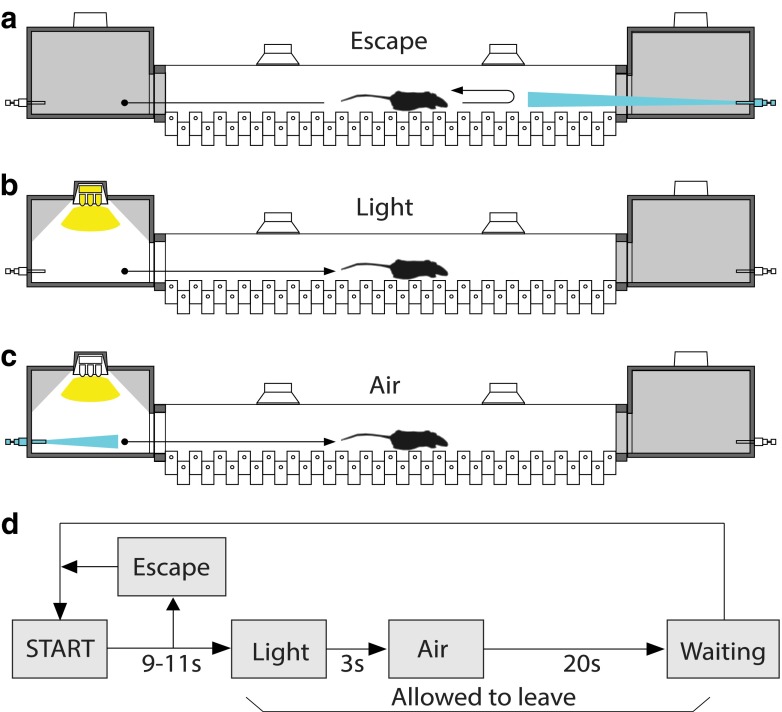
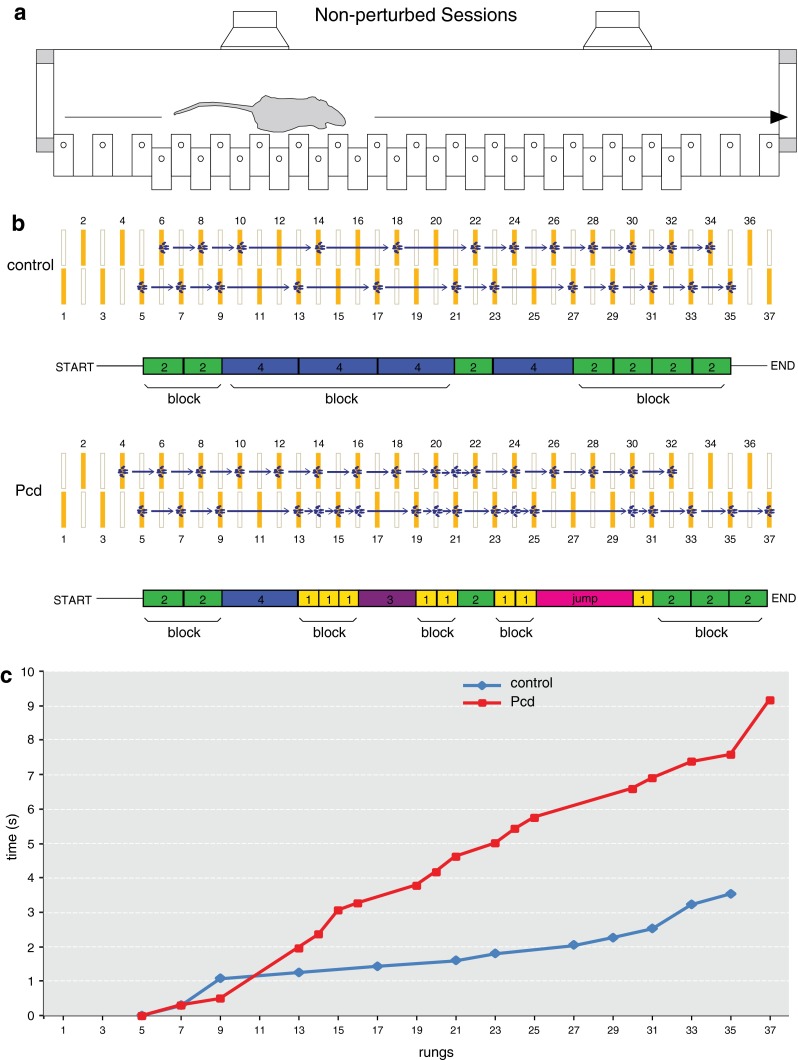
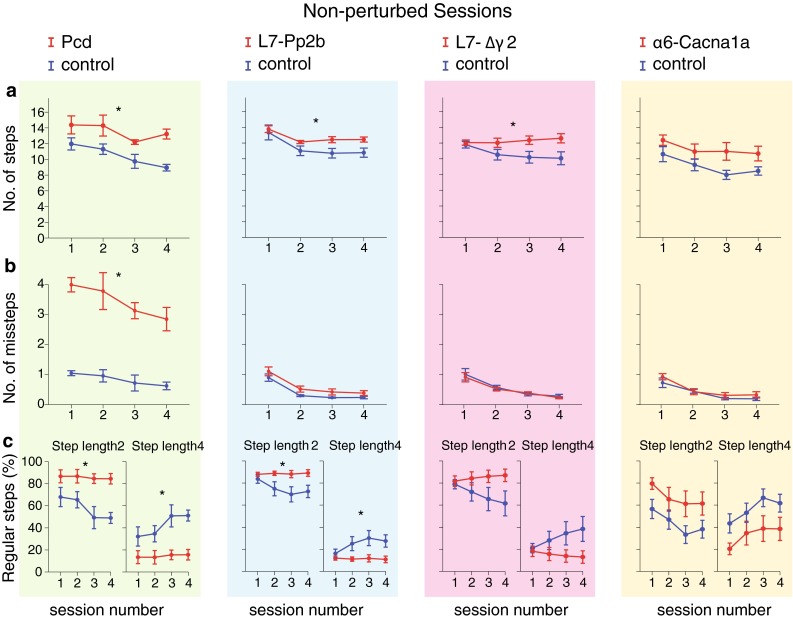
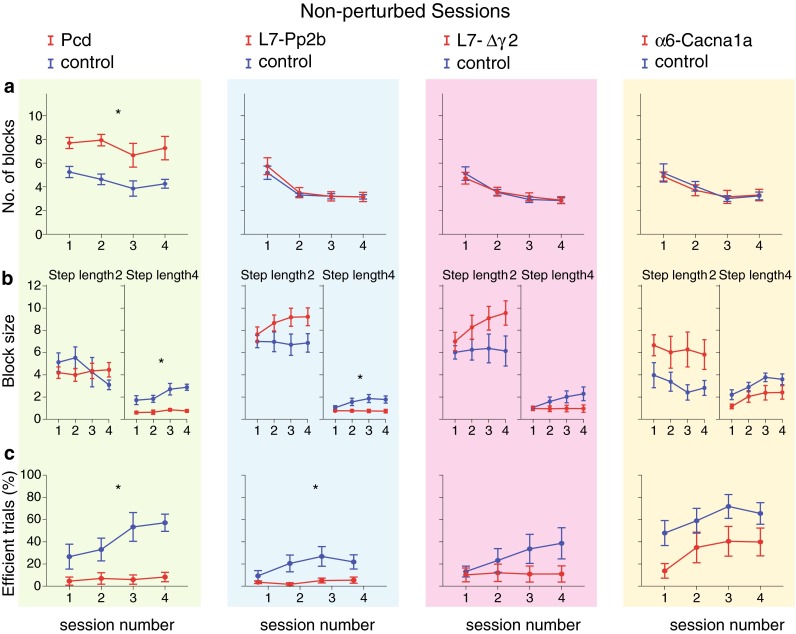
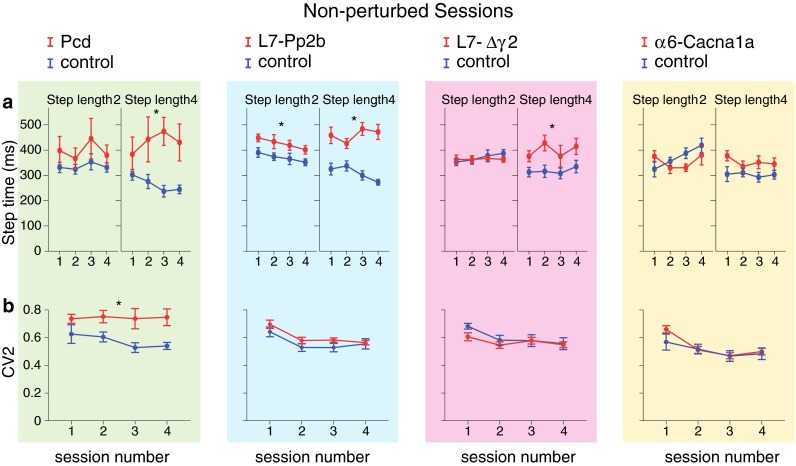
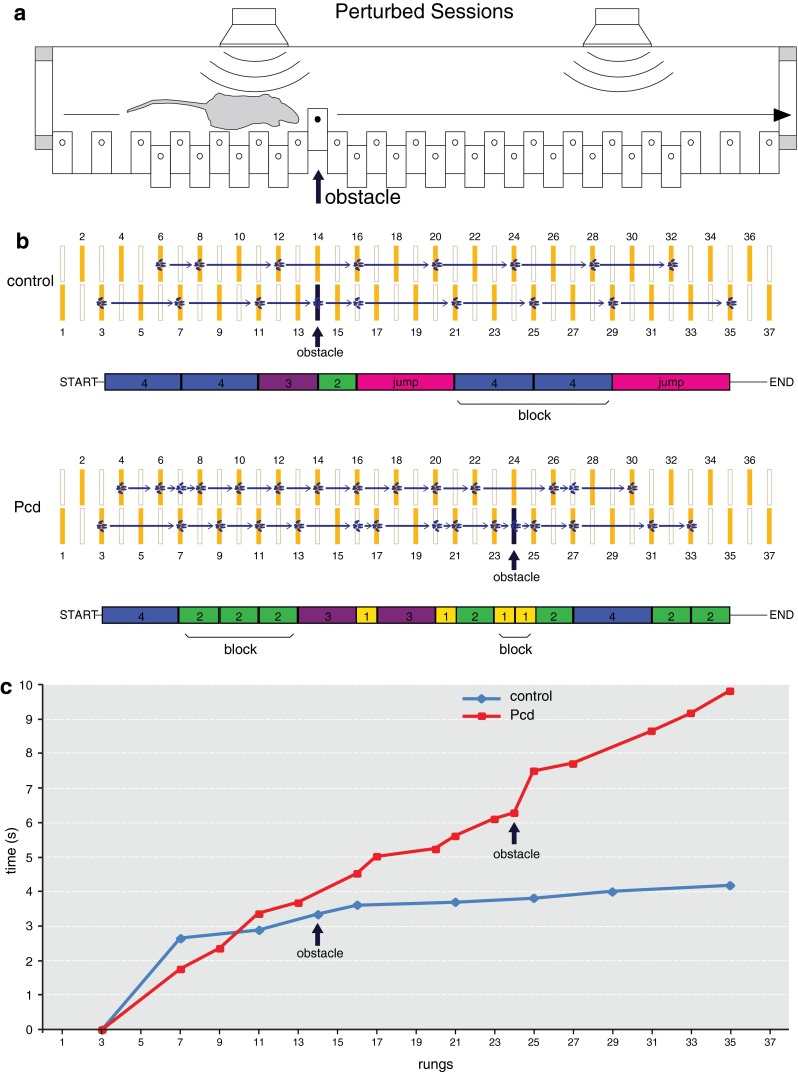
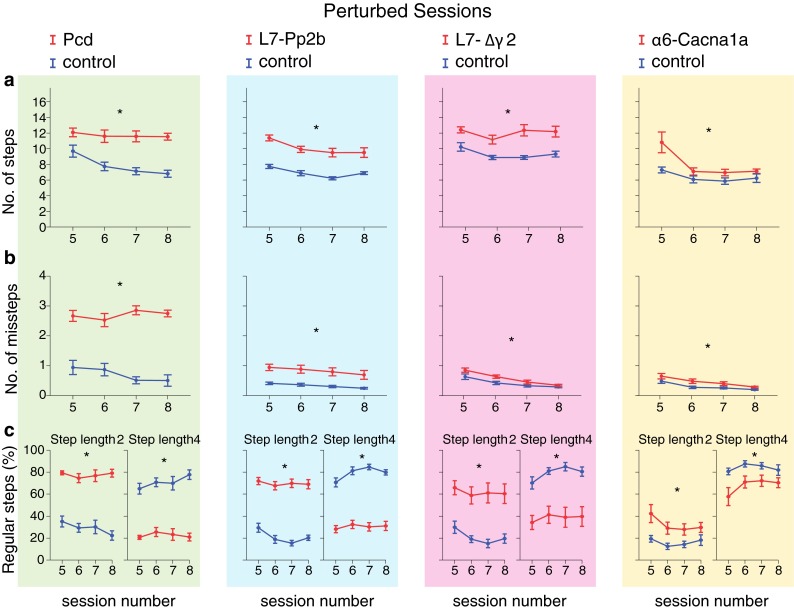
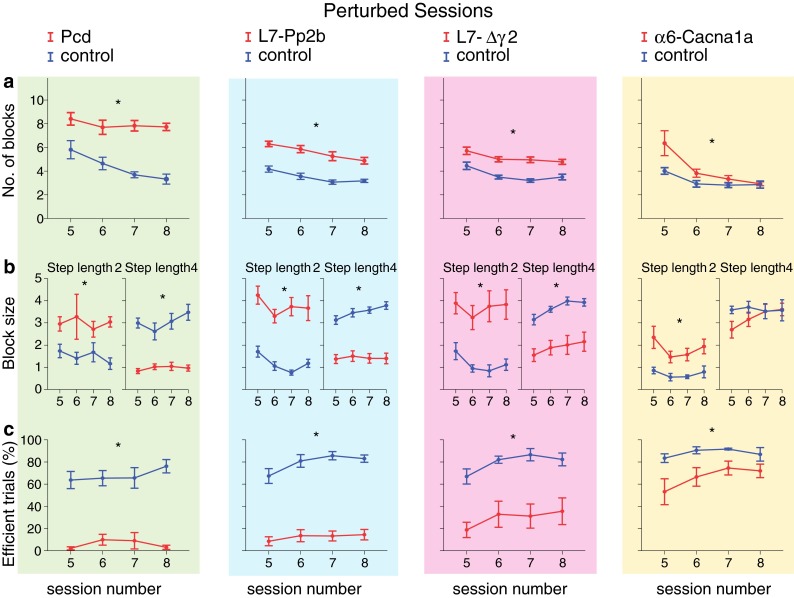
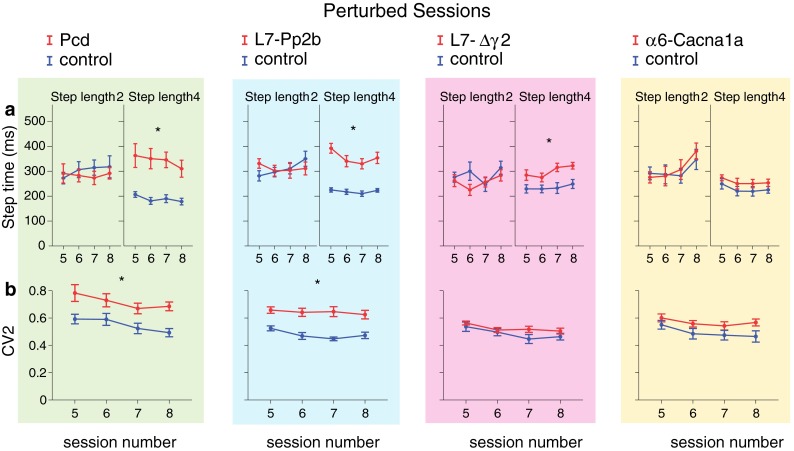
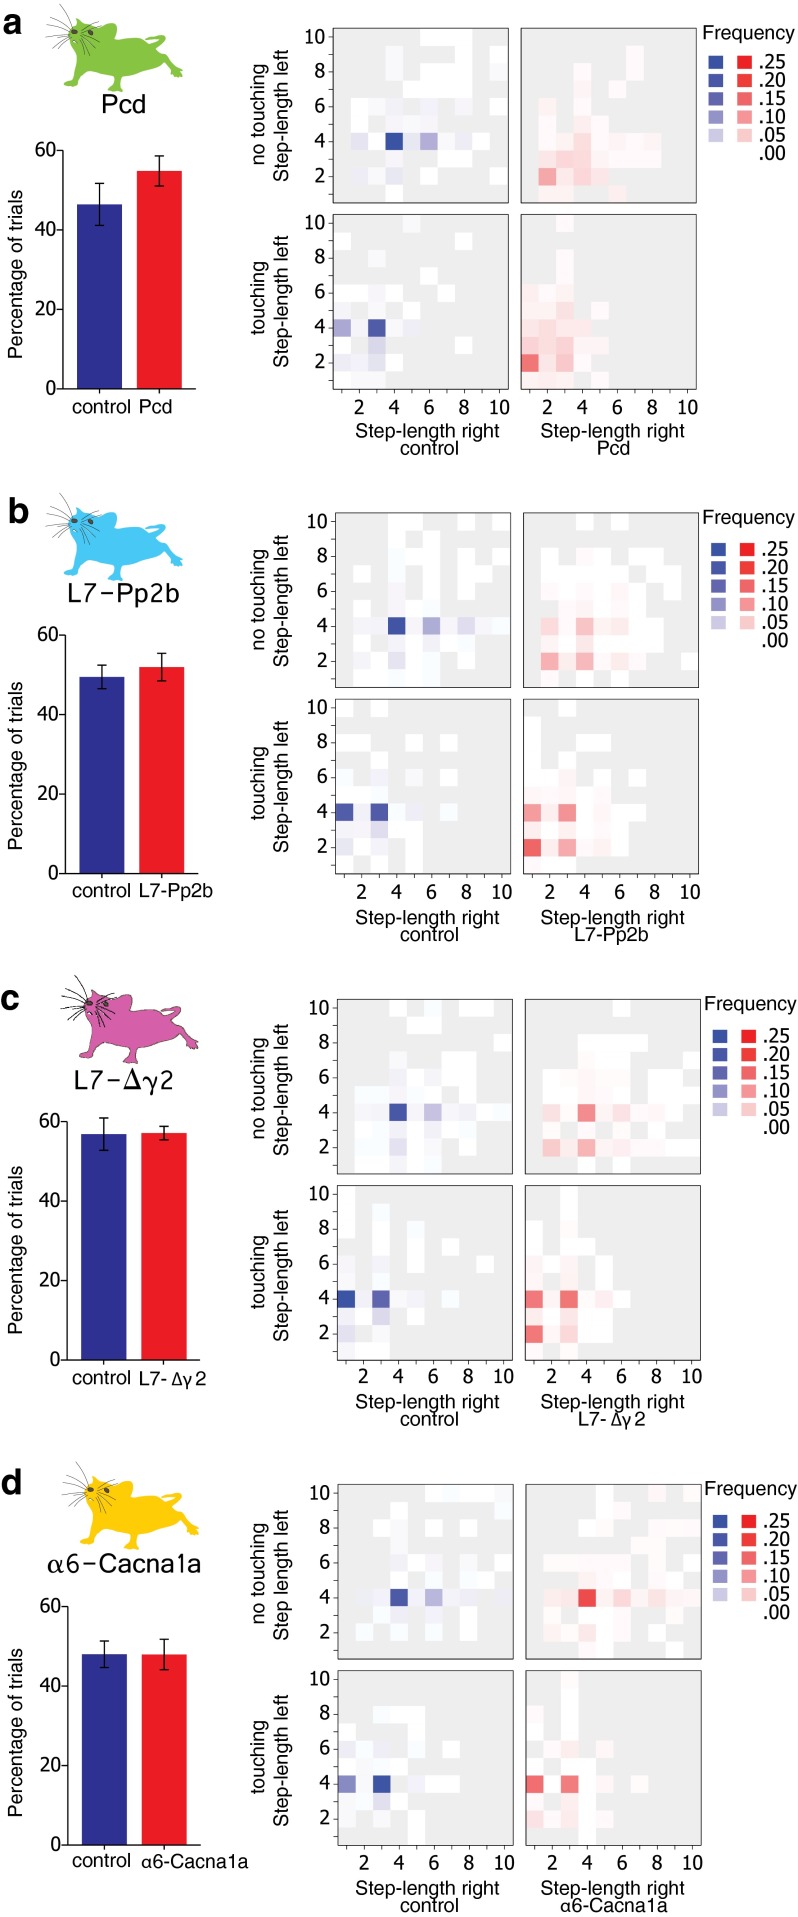
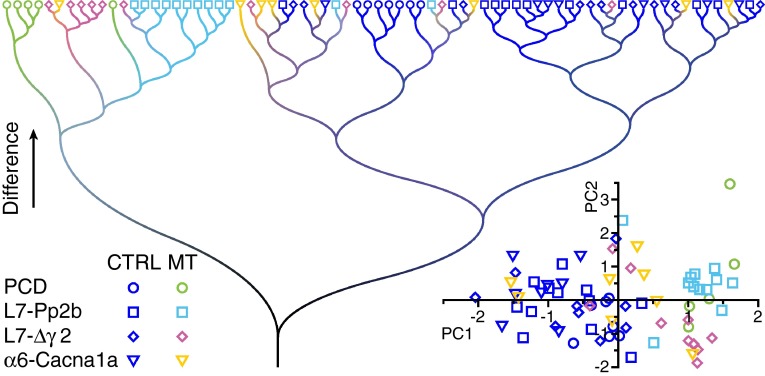
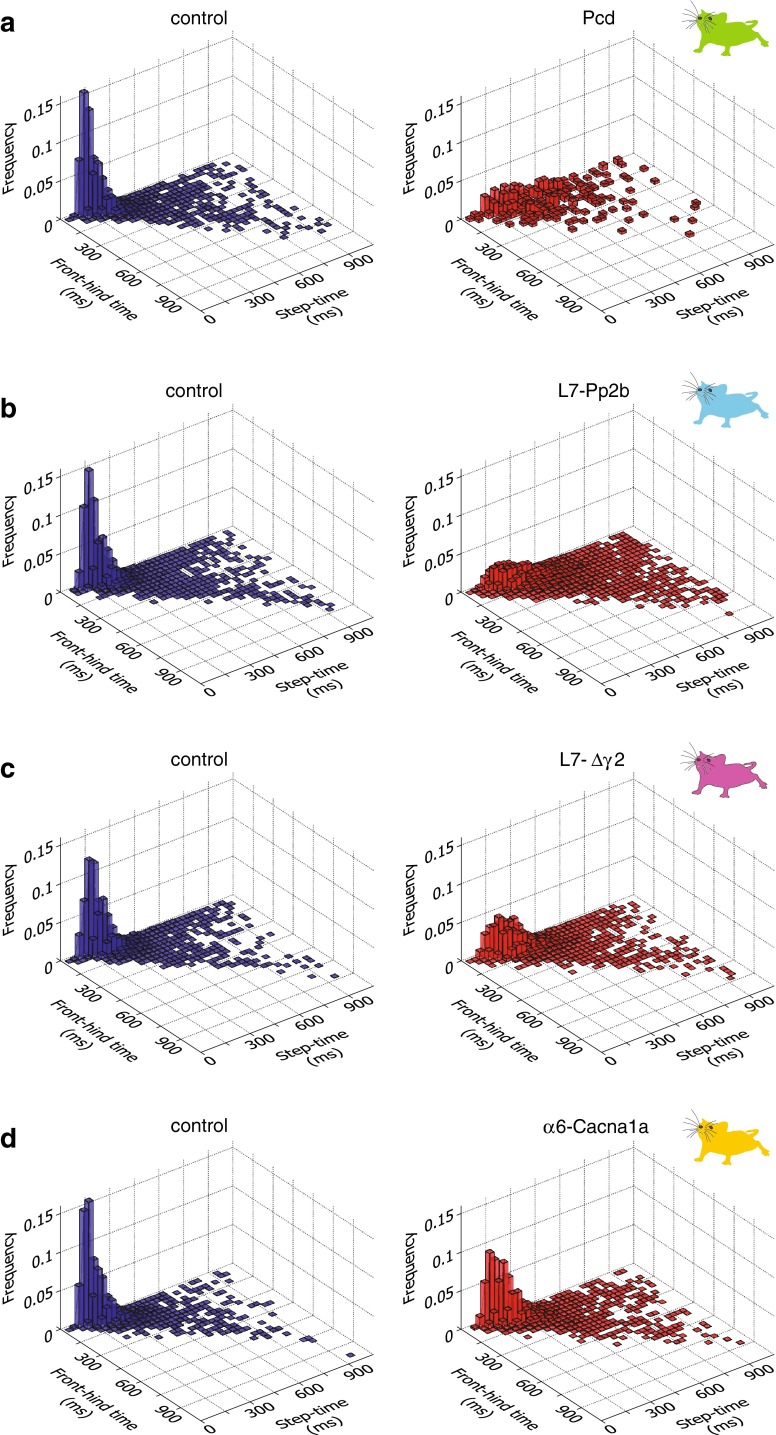
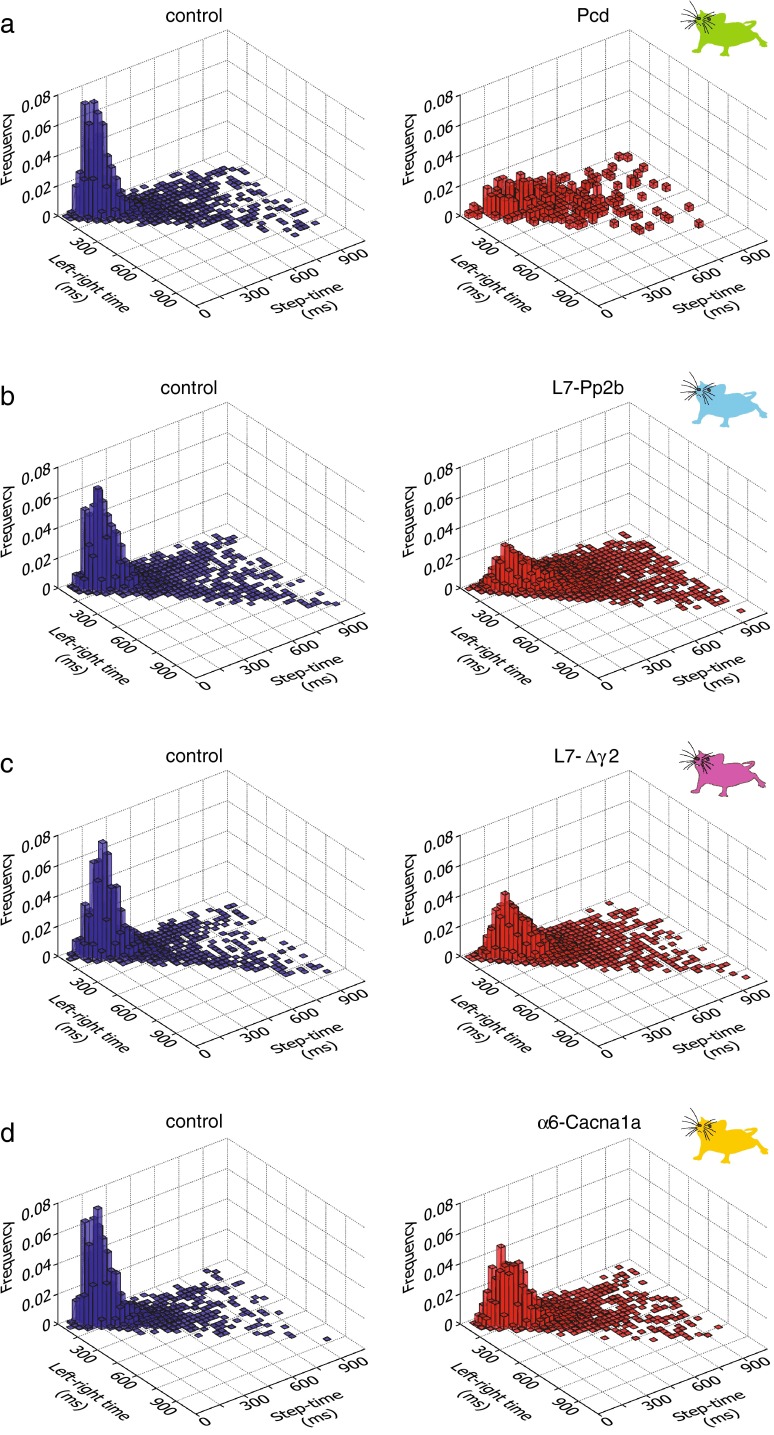
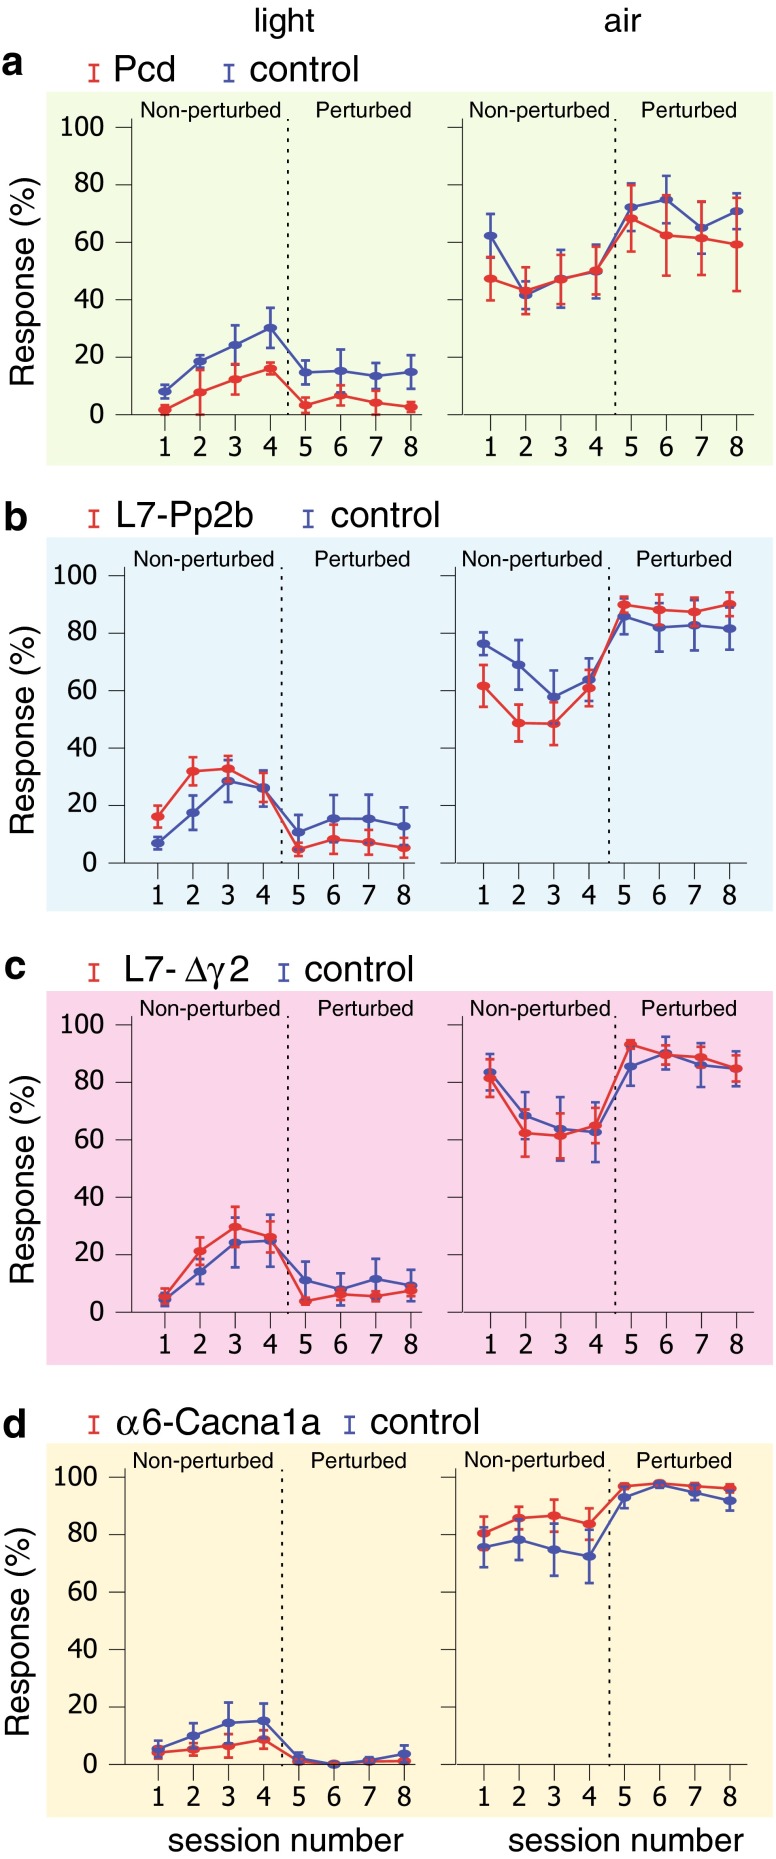
Synaptic and intrinsic processing in Purkinje cells, interneurons and granule cells of the cerebellar cortex have been shown to underlie various relatively simple, single-joint, reflex types of motor learning, including eyeblink conditioning and adaptation of the vestibulo-ocular reflex. However, to what extent these processes contribute to more complex, multi-joint motor behaviors, such as locomotion performance and adaptation during obstacle crossing, is not well understood. Here, we investigated these functions using the Erasmus Ladder in cell-specific mouse mutant lines that suffer from impaired Purkinje cell output (Pcd), Purkinje cell potentiation (L7-Pp2b), molecular layer interneuron output (L7-Δγ2), and granule cell output (α6-Cacna1a). We found that locomotion performance was severely impaired with small steps and long step times in Pcd and L7-Pp2b mice, whereas it was mildly altered in L7-Δγ2 and not significantly affected in α6-Cacna1a mice. Locomotion adaptation triggered by pairing obstacle appearances with preceding tones at fixed time intervals was impaired in all four mouse lines, in that they all showed inaccurate and inconsistent adaptive walking patterns. Furthermore, all mutants exhibited altered front-hind and left-right interlimb coordination during both performance and adaptation, and inconsistent walking stepping patterns while crossing obstacles. Instead, motivation and avoidance behavior were not compromised in any of the mutants during the Erasmus Ladder task. Our findings indicate that cell type-specific abnormalities in cerebellar microcircuitry can translate into pronounced impairments in locomotion performance and adaptation as well as interlimb coordination, highlighting the general role of the cerebellar cortex in spatiotemporal control of complex multi-joint movements.

Keywords: Erasmus Ladder; Granule cells; Interlimb coordination; Interneurons; Locomotion; Purkinje cells.


Figures

Fig. 1
Fig. 1
Microcircuitry of the cerebellar cortex highlighting the main sites affected in the Pcd, L7-Pp2b, L7-∆γ2 and α6-Cacna1a mice. The two main excitatory afferents of the cerebellar cortex are the mossy fibers (MF) and climbing fibers (CF). Whereas the MFs originate from various sources in the brainstem, all CFs are derived from the inferior olive (IO). The CFs directly innervate the Purkinje cells (PCs) and influence via non-synaptic release the activity of molecular layer interneurons (MLI), which inhibit PCs. The MFs directly innervate the granule cells (GCs), which in turn give rise to the parallel fibers (PFs) that innervate both PCs and MLIs. PCs form the sole output of the cerebellar cortex to the cerebellar nuclei (CN). The mutants used in the current study either lack Purkinje cells (Pcd, indicated in green), intrinsic Purkinje cell plasticity and parallel fiber-to-Purkinje cell potentiation (L7-Pp2b, blue), phasic inhibition provided by molecular layer interneurons (L7-∆γ2, purple), or most of their granule cell output (α6-Cacna1a, yellow)
Fig. 2
Fig. 2
The Erasmus Ladder test. The Erasmus Ladder consists of a horizontal ladder situated between two shelter boxes. The sequence of illustrations shows how the paradigm works. a The mouse has to stay inside the dark shelter during a random time interval that varies between 9 and 11 s before it is allowed to walk on the ladder. Whenever the mouse tries to cross the ladder before the time interval has passed, a powerful crosswind coming from the opposite shelter is activated, pushing the mouse back to its starting position; we refer to such a trial as an “escape” trial. b When the time interval has passed, the LED light in the roof turns on (“light”) and the mouse is allowed to leave the shelter box. The light remains on until the mouse reaches the opposite shelter. c If the mouse does not leave the shelter within 3 s after the light goes on, a powerful air puff from the back of the shelter is activated (“air”). Normally, this stimulus is enough to encourage the mouse to start walking on the ladder. d Schematic representation of the temporal order of the events mentioned above
Fig. 3
Fig. 3
Baseline locomotion is tested during non-perturbed sessions. a Each daily session consisted of 72 trials, during which the mice had to walk back and forth from one shelter box to the other. Right from the beginning of the experiment, most of the mice usually stepped only on the upper rungs and only infrequently touched the lower ones, which was considered as a misstep. b The rungs of the ladder have custom-made pressure sensors. The upper rungs, which are indicated by closed yellow symbols, are positioned in a left–right alternating pattern. The blue footprints represent the typical touches of the front paws of a control (top) and Pcd mouse (bottom) during a representative trial on the ladder. A single step (arrow) corresponds to a front paw step. The steps are classified according to their length and direction, and they are represented as colored rectangles located below the ladders. Consecutive single steps of the same length merge to build “blocks”. c Time course of the trials is depicted in b. Symbols represent single touches
Fig. 4
Fig. 4
Non-perturbed locomotion: number of steps, missteps and distribution of step sizes. a Most cerebellar mutant mice (Pcd n = 5; L7-Pp2b n = 12; L7-Δγ2 n = 10; α6-Cacna1a n = 8) used significantly more steps to cross the Erasmus Ladder than controls (Pcd control n = 7; L7-Pp2b control n = 12; L7-Δγ2 control n = 10; α6-Cacna1a control n = 8). b Accuracy was tested by estimating the average number of missteps per trial. Only Pcd mice showed an abnormally high number of missteps in comparison to control mice. c Distribution of step sizes was tested by quantifying the occurrence of small (step length = 2) and large regular steps (step length = 4). Both Pcd and L7-Pp2b mice had a significantly higher rate of small steps and a significantly lower rate of large steps than control littermates. Error bars represent SEM. Significant differences between mutant and control mice are indicated with asterisks
Fig. 5
Fig. 5
Non-perturbed locomotion: walking pattern consistency and efficiency. a To estimate the consistency of the walking pattern, we calculated the mean number of blocks with steps of the same length for each trial (see Fig. 3b). Only Pcd mice changed their step lengths significantly more often than control mice. b Although some non-significant trends emerged, all cerebellar mutant mice showed a similar number of consecutive small steps (i.e., block size for small steps) compared to control mice. In contrast, with respect to large steps Pcd and L7-Pp2b mice made significantly fewer consecutive steps, keeping the average block size small. c To estimate the efficiency of their walking patterns, we calculated the percentage of trials per session, in which the maximum number of large steps or leaps was higher than that of the other steps (efficient trials). Pcd and L7-Pp2b mice showed a significantly lower rate of efficient trials per session, while L7-Δγ2 and α6-Cacna1a mice showed a trend that did not reach significance. Error bars represent SEM. Significant differences between mutant and control mice are indicated with asterisks
Fig. 6
Fig. 6
Non-perturbed locomotion: temporal control. a Step time corresponds to the elapsed time (in ms) between two consecutive touches (see Fig. 3). For small steps only L7-Pp2b mice had significantly longer step times than control mice, whereas for large steps this held true not only for L7-Pp2b, but also for Pcd and L7-Δγ2 mice. b The variability of step times (CV2) was only significantly higher for Pcd mice with respect to that in controls. Error bars represent SEM. Significant differences between mutant and control mice are indicated with asterisks
Fig. 7
Fig. 7
Locomotion adaptation is tested during perturbed sessions. a Throughout the perturbed sessions, the mice learned to adapt their walking patterns in response to a 15 kHz auditory stimulus preceding the appearance of an obstacle in their pathway. The obstacle, which consisted of an upward moving rung, was always located on the right side of the mouse independently of its walking direction. Its specific location depended on the predicted position of the mouse on the ladder, but was otherwise randomized. b The blue footprints represent the front paw touches of the same control and Pcd mice depicted in Fig. 3, but now during a perturbed trial. The position of the obstacle is indicated with black arrows. c Time course of the trials is depicted in b. Symbols represent single touches
Fig. 8
Fig. 8
Locomotion adaptation: number of steps, missteps and distribution of step sizes. Perturbed sessions are more challenging for mice than non-perturbed sessions. Consequently, throughout these sessions all cerebellar mutant mice showed impairments, some of which were not obvious during the non-perturbed sessions. a During perturbed sessions, all cerebellar mutant mice used significantly more steps to cross the ladder than control mice. b Likewise, all cerebellar mutant mice showed significantly more missteps. c Moreover, all cerebellar mutant mice also showed a significantly higher rate of small steps and a significantly lower rate of large steps. Error bars represent SEM. Significant differences between mutant and control mice are demonstrated with an asterisk
Fig. 9
Fig. 9
Locomotion adaptation: walking pattern consistency and efficiency. a All cerebellar mutant mice showed very inconsistent walking patterns in comparison with control mice throughout the perturbed sessions; mutant mice changed their step lengths significantly more often than control mice. b All cerebellar mutant mice showed a significantly higher number of consecutive small steps than control mice. Similarly, except for α6-Cacna1a, cerebellar mutant mice showed a lower number of consecutive large steps, i.e., smaller block sizes. c All cerebellar mutant mice had less efficient trials per session than control littermates. Error bars represent SEM. Significant differences between mutant and control mice are demonstrated with an asterisk
Fig. 10
Fig. 10
Locomotion adaptation: timing and variability. a All cerebellar mutants took a similar amount of time to make a single small step compared to control mice. The opposite occurred with regard to large steps; except for α6-Cacna1a, all cerebellar mutants took more time per step than controls. b Only Pcd and L7-Pp2b mice showed an increased variability of their step times in comparison with controls. Error bars represent SEM. Significant differences between mutant and control mice are demonstrated with an asterisk
Fig. 11
Fig. 11
Stepping strategy during obstacle crossing. The percentage of trials in which the cerebellar mutant mice (indicated in red) touched the obstacle was not significantly different from that of control mice (indicated in blue) (left panels). Panels on the right show frequency distributions in which a specific step length on the side of the obstacle (right; x axis) occurred concomitantly with a specific step length on the left side (y axis) in two situations: with (bottom) and without (top) touching the obstacle. When the obstacle was not touched, control mice made large steps (step length = 4) or leaps (step length >4) on both sides. In contrast, when touching the obstacle, they combined large steps with irregular steps (either step length = 1 or 3). a Pcd mice did not show a stereotypic combination of step lengths in either situation, with or without touching the obstacle. b Similarly to Pcd mice, L7-Pp2b combined small steps and irregular steps on both sides, and they did not show clear combinations of step lengths. c L7-Δγ2 mice were able to combine large steps and leaps; however, they did this less often than control mice. d The α6-Cacna1a mice were almost indistinguishable from control mice
Fig. 12
Fig. 12
Cluster analysis reveals unique locomotor phenotypes for cerebellar mutants. In a cluster analysis on the locomotion parameters at session 5 (see “Materials and methods”) the Pcd, L7-Pp2b and L7-Δγ2 mutants form clear clusters indicating that each of them has a unique phenotype on the Erasmus Ladder. The α6-Cacna1a mice were largely interspersed between the control groups, in line with our findings that they only showed deficits at specific parameters, mostly correlated to obstacle crossing and interlimb coordination. The individual control groups were largely intermingled, indicating the absence of a systematic bias between the control groups. Inset Principal component analysis of the same dataset (see “Materials and methods”). The axes show the first two principal components (in eigenvalues). The mutant and control mice segregate largely on the first (and thus most significant) principal component (PC1, x axis), whereas the different mutant groups cluster apart when also the second principal component (PC2, y axis) is taken into account. Also in this analysis, the α6-Cacna1a mice are less different from the control groups than the other three mutant mouse lines
Fig. 13
Fig. 13
Front–hind interlimb coordination during perturbation sessions. Coordination between front and hind limbs was estimated by correlating the times between steps of front limbs and hind limbs with their respective individual step times. ad All cerebellar mutant mice showed a much broader distribution of their front–hind times in comparison with control mice (Pcd: p < 0.001; L7-Pp2b: p < 0.001; L7-Δγ2: p < 0.001; α6-Cacna1a: p < 0.001; 2-D Kolmogorov–Smirnov test)
Fig. 14
Fig. 14
Left–right interlimb coordination during perturbation sessions. Coordination between left and right limbs was estimated by correlating the times between steps of the left and right forelimb with their respective individual step times. ad All cerebellar mutant mice showed a much broader distribution of their left–right times in comparison with control mice (Pcd: p < 0.001; L7-Pp2b: p < 0.001; L7-Δγ2: p < 0.001; α6-Cacna1a p < 0.001; 2-D Kolmogorov–Smirnov test)
Fig. 15
Fig. 15
Motivation and avoidance behavior. Motivation was tested in non-perturbed sessions by calculating the percentage of trials per session in which the mice properly used the light stimulus to leave the shelter box and started to walk on the ladder. The same responses measured during unpleasant circumstances (perturbed sessions) were used to test avoidance behavior. a–d (light) The occurrence of responses to light during non-perturbed sessions was not significantly different for any of the cerebellar mutant mice from that in control mice. Moreover, the occurrence of mutant responses to light was also not significantly different from that of control mice during perturbed sessions. ad (air) Similarly, the occurrence of responses to air stimuli in cerebellar mutant mice during non-perturbed sessions was not significantly different from that in control mice. The occurrence of responses to air was also not significantly different from that in control mice during perturbed sessions. Error bars represent SEM

Similar articles

Cited by

References

    1. Aller MI, Jones A, Merlo D, Paterlini M, Meyer AH, Amtmann U, Brickley S, Jolin HE, McKenzie AN, Monyer H, Farrant M, Wisden W. Cerebellar granule cell Cre recombinase expression. Genesis. 2003;36(2):97–103. doi: 10.1002/gene.10204. - DOI - PubMed
    1. Angeby-Moller K, Berge OG, Hamers FP. Using the CatWalk method to assess weight-bearing and pain behaviour in walking rats with ankle joint monoarthritis induced by carrageenan: effects of morphine and rofecoxib. J Neurosci Methods. 2008;174(1):1–9. doi: 10.1016/j.jneumeth.2008.06.017. - DOI - PubMed
    1. Anheim M, Tranchant C, Koenig M. The autosomal recessive cerebellar ataxias. N Engl J Med. 2012;366(7):636–646. doi: 10.1056/NEJMra1006610. - DOI - PubMed
    1. Armstrong DM. Supraspinal contributions to the initiation and control of locomotion in the cat. Prog Neurobiol. 1986;26(4):273–361. doi: 10.1016/0301-0082(86)90021-3. - DOI - PubMed
    1. Badura A, Schonewille M, Voges K, Galliano E, Renier N, Gao Z, Witter L, Hoebeek FE, Chedotal A, De Zeeuw CI. Climbing fiber input shapes reciprocity of Purkinje cell firing. Neuron. 2013;78(4):700–713. doi: 10.1016/j.neuron.2013.03.018. - DOI - PubMed

Publication types

LinkOut - more resources