. 2014 Sep 2;111(35):12793-8.
doi: 10.1073/pnas.1407214111. Epub 2014 Aug 19.

Assembly and dynamics of the autophagy-initiating Atg1 complex

Affiliations

Assembly and dynamics of the autophagy-initiating Atg1 complex

Goran Stjepanovic et al. Proc Natl Acad Sci U S A. .

Abstract

The autophagy-related 1 (Atg1) complex of Saccharomyces cerevisiae has a central role in the initiation of autophagy following starvation and TORC1 inactivation. The complex consists of the protein kinase Atg1, the TORC1 substrate Atg13, and the trimeric Atg17-Atg31-Atg29 scaffolding subcomplex. Autophagy is triggered when Atg1 and Atg13 assemble with the trimeric scaffold. Here we show by hydrogen-deuterium exchange coupled to mass spectrometry that the mutually interacting Atg1 early autophagy targeting/tethering domain and the Atg13 central domain are highly dynamic in isolation but together form a stable complex with ∼ 100-nM affinity. The Atg1-Atg13 complex in turn binds as a unit to the Atg17-Atg31-Atg29 scaffold with ∼ 10-μM affinity via Atg13. The resulting complex consists primarily of a dimer of pentamers in solution. These results lead to a model for autophagy initiation in which Atg1 and Atg13 are tightly associated with one another and assemble transiently into the pentameric Atg1 complex during starvation.

Keywords: analytical ultracentrifugation; intrinsically disordered proteins; isothermal titration calorimetry; membrane tethering; protein structure.


Conflict of interest statement

The authors declare no conflict of interest.

Figures

Fig. 1.
Fig. 1.
Atg1 binding site of Atg13. (A and B) Atg1EAT (A) and Atg17–Atg31–Atg29 (B) were immobilized on Talon resin and the indicated Atg13 fragments were pulled down. (C) Schematic of the Atg1 and Atg17–Atg31–Atg29 binding sites of Atg13. (D) HDX-MS mapping of the Atg1 binding site on Atg13. Atg1EAT-induced changes are localized within two regions between residues 410 and 460 of Atg13, and therefore only these regions are shown. Relative deuteration is indicated by a color gradient. Peptide coverage is shown above the deuteration map. (E) HDX-MS heat map at 10 s onto the crystal structure of Km Atg13 as bound to Atg1EAT. (F) ITC titration of Atg1EAT into a solution of MBP-tagged Atg13350–525. The thermogram was fit to a single-site binding model. Error bars are shown for each individual injection according to the fitting of the baseline (42). DP, differential power.
Fig. 2.
Fig. 2.
Dynamics of Atg1EAT. (A) HDX-MS heat map (10 s) for the R state onto the crystal structure of Km Atg1EAT. Atg13 is omitted from the structure for clarity. (B) Localization of fast- and slow-exchanging regions of Atg1EAT. Bar graphs showing the changes in % deuteron (D) for the relaxed (R) and tense (T) conformation state of Atg1EAT α-helices after 10 s in D2O. The numbers of the corresponding Atg1 peptides are given at the bottom of the graph. (Upper) Secondary structure representation of Atg1EAT with α-helical segments colored according to the relative deuteron incorporation after 10 s in D2O as indicated. The peptic fragments used to assign the exchange percentage to the various segments are indicated by helix labels preceding the peptide numbers.
Fig. 3.
Fig. 3.
Dynamics of the Atg1EAT–Atg13 subcomplex. (A) Structure of the Atg1EAT–Atg13 complex colored according to the percentage of deuterons incorporated in the presence of Atg13 minus deuterons incorporated in the absence of Atg13 into Atg1EAT residues after 10 s in D2O. Atg13 is in white and regions of Atg1 lacking peptide coverage are in gray. (B) Difference plot of % D incorporated into Atg1EAT α-helices in the presence of Atg13 minus deuterons incorporated in the absence of Atg13 into Atg1EAT segments after 10 s in D2O. The numbers of the corresponding Atg1EAT peptides are given at the bottom of the graph. The Atg1EAT secondary structure drawing (Upper) illustrates the two states that were compared in the HDX-MS analysis. Six predicted α-helices (α1–α6) are colored according to % D exchange. (C) Representative mass spectra (m/z scale) of two selected peptides of Atg1EAT before incubation in D2O (Bottom; monoisotopic mass-to-charge ratio and charge state are given), after 10 s in D2O in the absence (Atg1EAT) and presence of Atg13 (Atg1EAT–Atg13350–525), or after Atg1EAT unfolding with 6 M guanidinium hydrochloride followed by complete deuteration. Arrows above the spectra indicate the bimodal isotope distribution after a 10-s incubation in D2O. The bimodal isotope distribution was attributed to the relaxed and tense states of Atg1EAT. The numbers above the spectra refer to the corresponding backbone amides. (D) Relative amount of R state versus incubation time in D2O. T-to-R transition kinetics for selected peptides of Atg1EAT in isolation or in the context of Atg1EAT–Atg13350–525 and the Atg1EAT–Atg13350–525–Atg17–Atg31–Atg29 complex. A first-order rate equation was fitted to the data (solid lines) to give the T-to-R conversion rate constants of 0.05 s−1 and 0.001 s−1 for Atg1EAT and Atg1EAT–Atg13350–525, respectively. Data are averages of three experiments and error bars represent the SEM.
Fig. 4.
Fig. 4.
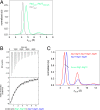
Assembly of the Atg1EAT–Atg13–Atg17–Atg31–Atg29 complex. (A) Overlay of the c(s) plots of Atg1EAT and Atg1EAT–Atg13350–525. Both Atg1EAT and Atg1EAT–Atg13350–525 primarily exist as dimeric species at an s20,w of 4.2 S and 4.7 S, respectively. The concentration of protein used for both Atg1EAT and Atg1EAT–Atg13350–525 was 20 µM. The c(s) distributions were normalized to the peak area of Atg1EAT. (B) Representative ITC thermogram of Atg1EAT–Atg13350–525 binding to Atg17–Atg31–Atg29, yielding a Kd of 11 ± 2 μM. Atg17–Atg31–Atg29 complex (15 µM) was loaded into the ITC cell and EAT-13 (450 µM) was loaded into the syringe. The thermogram was fit to a single-site binding model. Error bars are shown for each individual injection according to the fitting of the baseline (42). (C) Overlay of the c(s) plots of Atg17–Atg31–Atg29 and the pentamer. Atg17–Atg31–Atg29 exists primarily as an elongated, dimeric species at an s20,w value of 5.5 S with some formation of a tetramer at 8.1 S. To assess the oligomeric state of the pentamer, an 8-M excess of Atg1EAT–Atg13350–525 was mixed with Atg17–Atg31–Atg29 (2 µM). The c(s) distributions show that the pentamer exists primarily as a dimer at an s20,w value of 7.9 S. The excess, unbound EAT-13 sediments at 4.9 S. The c(s) distributions were normalized to the peak area of the Atg17–Atg31–Atg29 dimer.
Fig. 5.
Fig. 5.
Model for Atg1 complex assembly. Atg1EAT–Atg13 is deliberately shown as a monomer to emphasize interactions with a single copy of Atg17. The binding site for Atg13 is positioned near the tip of the scaffold (28).

References

    1. Rubinsztein DC, Shpilka T, Elazar Z. Mechanisms of autophagosome biogenesis. Curr Biol. 2012;22(1):R29–R34. - PubMed
    1. Reggiori F, Klionsky DJ. Autophagic processes in yeast: Mechanism, machinery and regulation. Genetics. 2013;194(2):341–361. - PMC - PubMed
    1. Mizushima N, Levine B, Cuervo AM, Klionsky DJ. Autophagy fights disease through cellular self-digestion. Nature. 2008;451(7182):1069–1075. - PMC - PubMed
    1. Hurley JH, Schulman BA. Atomistic autophagy: The structures of cellular self-digestion. Cell. 2014;157(2):300–311. - PMC - PubMed
    1. Mari M, et al. An Atg9-containing compartment that functions in the early steps of autophagosome biogenesis. J Cell Biol. 2010;190(6):1005–1022. - PMC - PubMed

Publication types

MeSH terms

Substances