. 2014:2014:285752.
doi: 10.1155/2014/285752. Epub 2014 Jul 22.

δ-Tocotrienol oxazine derivative antagonizes mammary tumor cell compensatory response to CoCl2-induced hypoxia

Affiliations

δ-Tocotrienol oxazine derivative antagonizes mammary tumor cell compensatory response to CoCl2-induced hypoxia

Suryatheja Ananthula et al. Biomed Res Int. 2014.

Abstract

In response to low oxygen supply, cancer cells elevate production of HIF-1α, a hypoxia-inducible transcription factor that subsequently acts to stimulate blood vessel formation and promote survival. Studies were conducted to determine the role of δ-tocotrienol and a semisynthetic δ-tocotrienol oxazine derivative, compound 44, on +SA mammary tumor cell hypoxic response. Treatment with 150 µM CoCl2 induced a hypoxic response in +SA mammary tumor cells as evidenced by a large increase in HIF-1α levels, and combined treatment with compound 44 attenuated this response. CoCl2-induced hypoxia was also associated with a large increase in Akt/mTOR signaling, activation of downstream targets p70S6K and eIF-4E1, and a significant increase in VEGF production, and combined treatment with compound 44 blocked this response. Additional in vivo studies showed that intralesional treatment with compound 44 in BALB/c mice bearing +SA mammary tumors significantly decreased the levels of HIF-1α, and this effect was associated with a corresponding decrease in Akt/mTOR signaling and activation of downstream targets p70S6 kinase and eIF-4E1. These findings demonstrate that treatment with the δ-tocotrienol oxazine derivative, compound 44, significantly attenuates +SA mammary tumor cell compensatory responses to hypoxia and suggests that this compound may provide benefit in the treatment of rapidly growing solid breast tumors.


Figures
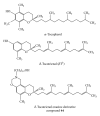
Figure 1
Figure 1
Chemical structures of α-tocopherol, δ-tocotrienol, and the δ-tocotrienol oxazine derivative, 12-((R)-6,8-dimethyl-8-((3E,7E)-4,8,12-trimethyltrideca-3,7,11-trienyl)-9,10-dihydrochromeno[5, 6-e] [1, 3]oxazin-2(1H, 3H, 8H)-yl)dodecan-1-ol) (compound 44).
Figure 2
Figure 2
(a) Dose-response effects of CoCl2 on mouse +SA mammary tumor cell viability. +SA cells were initially plated at a density of 5 × 10³ cells/well in 96-well culture plates (8 replicates/group) and exposed to 0–300 µM CoCl2 for a 24 hr incubation period. Afterwards, viable cell number was determined using the MTT assay. (b) Effects of 150 µM CoCl2 (noncytotoxic dose) alone and in combination with subeffective antiproliferative doses (2 µM) of δ-tocotrienol or the δ-tocotrienol oxazine derivative, compound 44, on +SA mammary tumor cell viability. +SA cells were initially plated at a density of 5 × 10³ cells/well in 96-well culture plates (8 replicates/group) and their respective treatments for a 24 hr incubation period. Afterwards, viable cell number was determined using the MTT assay. Vertical bars indicate mean viable cell number ± SEM. *P < 0.05 compared to the vehicle-treated control group.
Figure 3
Figure 3
(a) Dose-response and (b) time-response effect of CoCl2 on HIF-1α levels in +SA mammary cancer cells grown in culture. +SA cells were seeded at concentration of 1.5 × 10⁶ in 100 mm culture dishes and allowed to attach overnight. The following day, cells were divided into treatment groups and exposed to various concentrations of CoCl2 for 0–24 hr incubation period. Afterwards, cells were isolated with trypsin, and whole cell lysates were prepared for Western blot analysis. Scanning densitometric analysis was performed on all blots done in triplicate and the integrated optical density of each band was normalized with corresponding α-tubulin, as shown in the bar graphs below their respective Western blot image. Vertical bars indicate the normalized integrated optical density of bands visualized in each lane ± SEM. *P < 0.05 as compared to the vehicle-treated controls.
Figure 4
Figure 4
(a) Effects of 150 µM CoCl2 (hypoxic, but not cytotoxic dose) alone and in combination with subeffective doses (2 µM) of δ-tocotrienol or the δ-tocotrienol oxazine derivative, compound 44, on HIF-1α levels in +SA mammary tumor cells. +SA cells were seeded at concentration of 1.5 × 10⁶ in 100 mm culture dishes and allowed to attach overnight. The following day, cells were divided into groups and exposed to their respective treatments for a 24 hr incubation period. Afterwards, whole cell lysates were prepared for Western blot analysis. (b) Scanning densitometric analysis was performed on all blots done in triplicate and the integrated optical density of each band was normalized with corresponding α-tubulin, as shown in the bar graphs below their respective Western blot image. Vertical bars indicate the normalized integrated optical density of bands visualized in each lane ± SEM. # P < 0.05 compared to the vehicle-treated control group. *P < 0.05 as compared to the hypoxic group treated with CoCl2 alone.
Figure 5
Figure 5
Effects of 150 µM CoCl2 (hypoxic, but not cytotoxic dose) alone and in combination with compound 44 (44), on mitogenic/survival signaling and hypoxic response marker protein levels in +SA mammary tumor cells. +SA cells were seeded at concentration of 1.5 × 10⁶ in 100 mm culture dishes and allowed to attach overnight. The following day, cells were divided into groups and exposed to their respective treatments for a 24 hr incubation period. Afterwards, whole cell lysates were prepared for Western blot analysis for Akt, PI3K, phospho-Akt (p-Akt, Ser473), mTOR, phospho-mTOR (p-mTOR, Ser2448), HIF-1α, phospho-p70S6K (p-p70S6K, Ser424), phospho-eIF-4E1 (p-eIF-4E1, Ser209), and phospho-4E-BP1 (p-4E-BP1, Thr37). Scanning densitometric analysis was performed on all blots done in triplicate and the integrated optical density of each band was normalized with corresponding α-tubulin, as shown in the bar graphs below their respective Western blot image. Vertical bars indicate the normalized integrated optical density of bands visualized in each lane ± SEM. *P < 0.05 as compared to the hypoxic CoCl2-treated controls.
Figure 6
Figure 6
Effects of 150 µM CoCl2 (hypoxic, but not cytotoxic dose) alone and in combination with compound 44 (44), on MAPK cascade signaling proteins in +SA mammary tumor cells. +SA cells were seeded at concentration of 1.5 × 10⁶ in 100 mm culture dishes and allowed to attach overnight. The following day, cells were divided into groups and exposed to their respective treatments for a 24 hr incubation period. Afterwards, whole cell lysates were prepared for Western blot analysis or MEK, phospho-MEK 1/2 (p-MEK 1/2, Ser221/217), ERK1, ERK2, and phospho-ERK 1/2 (p-ERK 1/2, Thr202/Tyr204). Scanning densitometric analysis was performed on all blots done in triplicate and the integrated optical density of each band was normalized with corresponding α-tubulin, as shown in the bar graphs below their respective Western blot image. Vertical bars indicate the normalized integrated optical density of bands visualized in each lane ± SEM. *P < 0.05 as compared to the hypoxic CoCl2-treated control group.
Figure 7
Figure 7
ELISA quantification of VEGF protein levels in the culture media following +SA mammary tumor cells exposed to 150 µM CoCl2 alone and in combination with compound 44. +SA cells were plated at a density of 5 × 10³ cells/well in 96-well culture plates (6 replicates/group) in 96-well tissue culture plates and allowed to attach overnight. The next day, cells were divided into different groups and exposed to their respective treatments for a 24 hr incubation period. Afterward, cell media from wells in each treatment group and added to VEGF antibody coated 96-well plates for ELISA analysis. Vertical bars indicate mean VEGF levels (pg/mL) ± SEM. # P < 0.05 compared to the vehicle-treated control group. *P < 0.05 as compared to the hypoxic group treated with CoCl2 alone.
Figure 8
Figure 8
(a) Average +SA tumor volume in the treatment groups at the start (Day 0) and end (Day 11) of the treatment period. +SA mammary cells (1 × 10⁶) suspended in 100 μL of 0.05 M PBS were injected into the number 4 abdominal mammary fat pad of syngeneic female BALB/c mice. Once tumors reached 4-5 mm in diameter, mice were divided into different treatment groups (8 mice/group) and treated with intralesional injections of lipid nanoemulsion formulations of α-tocopherol (αT), δ-tocotrienol (δT3), or δ-tocotrienol oxazine derivative, compound 44 (44), at a dose of 0–120 μg/20 μL every other day throughout the experimental period. The untreated control group (C) was added to ensure that intralesional injection of the α-tocopherol nanoemulsion did not influence tumor growth in a nonspecific manner. Data points indicate the average tumor volume (cm3± SEM) for 8 mice/group ± SEM in each treatment group. *P < 0.05, as compared with the α-tocopherol-treated negative control group. (b) Western blot analysis of HIF-1α, phospho-Akt (p-Akt, Ser473), phospho-mTOR (p-mTOR, Ser2448), phospho-p70S6K (p-p70S6K, Ser424), phospho-eIF-4E1 (p-eIF-4E1, Ser209), phosphor-4E-BP1 (p-4E-BP1, Thr37), and phospho-ERK1/2 (p-ERK1/2, Thr202/Tyr204) in +SA mammary tumors grown in syngeneic BALB/c mice exposed to the various treatments. Lysates prepared from each tumor were separated by polyacrylamide gel electrophoresis (40 μg/lane) followed by Western blot analysis. α-Tubulin was visualized to ensure equal sample loading in each lane. Each Western blot is a representative image of data obtained for experiments that were repeated at least three times. Scanning densitometric analysis was performed on all blots in triplicate and the optical density of each band was normalized with that of the corresponding α-tubulin, as shown in bar graphs. Vertical bars indicate the normalized integrated optical density of bands visualized in each lane ± SEM. *P < 0.05, as compared with the α-tocopherol-treated negative control group. C: Untreated control; α-T: α-tocopherol-treated negative control; δT3: δ-tocotrienol; 44: δ-tocotrienol oxazine derivative, compound 44.

References

    1. Holmgren L. Antiangiogenesis restricted tumor dormancy. Cancer and Metastasis Reviews. 1996;15(2):241–245. - PubMed
    1. Ke Q, Costa M. Hypoxia-inducible factor-1 (HIF-1) Molecular Pharmacology. 2006;70(5):1469–1480. - PubMed
    1. Wang GL, Jiang BH, Rue EA, Semenza GL. Hypoxia-inducible factor 1 is a basic-helix-loop-helix-PAS heterodimer regulated by cellular O2 tension. Proceedings of the National Academy of Sciences of the United States of America. 1995;92(12):5510–5514. - PMC - PubMed
    1. Semenza GL. Regulation of mammalian O2 homeostasis by hypoxia-inducible factor 1. Annual Review of Cell and Developmental Biology. 1999;15:551–578. - PubMed
    1. Semenza GL. HIF-1: using two hands to flip the angiogenic switch. Cancer and Metastasis Reviews. 2000;19(1-2):59–65. - PubMed

Publication types

MeSH terms

LinkOut - more resources