

The parametric g-formula for time-to-event data: intuition and a worked example
- PMID: 25140837
- PMCID: PMC4310506
- DOI: 10.1097/EDE.0000000000000160
The parametric g-formula for time-to-event data: intuition and a worked example
Abstract
Background: The parametric g-formula can be used to estimate the effect of a policy, intervention, or treatment. Unlike standard regression approaches, the parametric g-formula can be used to adjust for time-varying confounders that are affected by prior exposures. To date, there are few published examples in which the method has been applied.
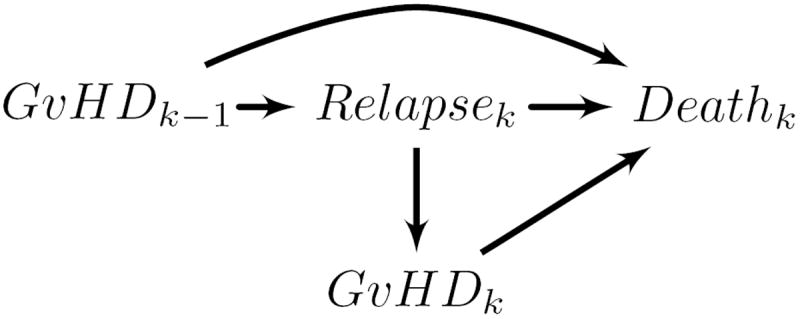
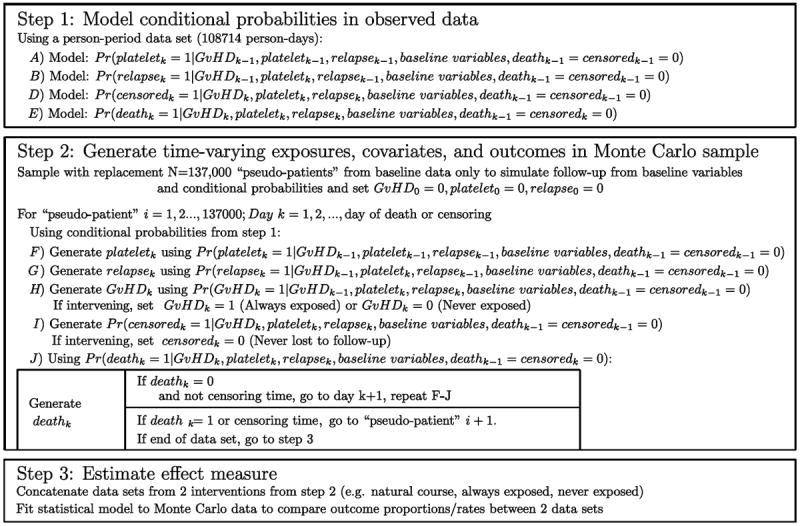
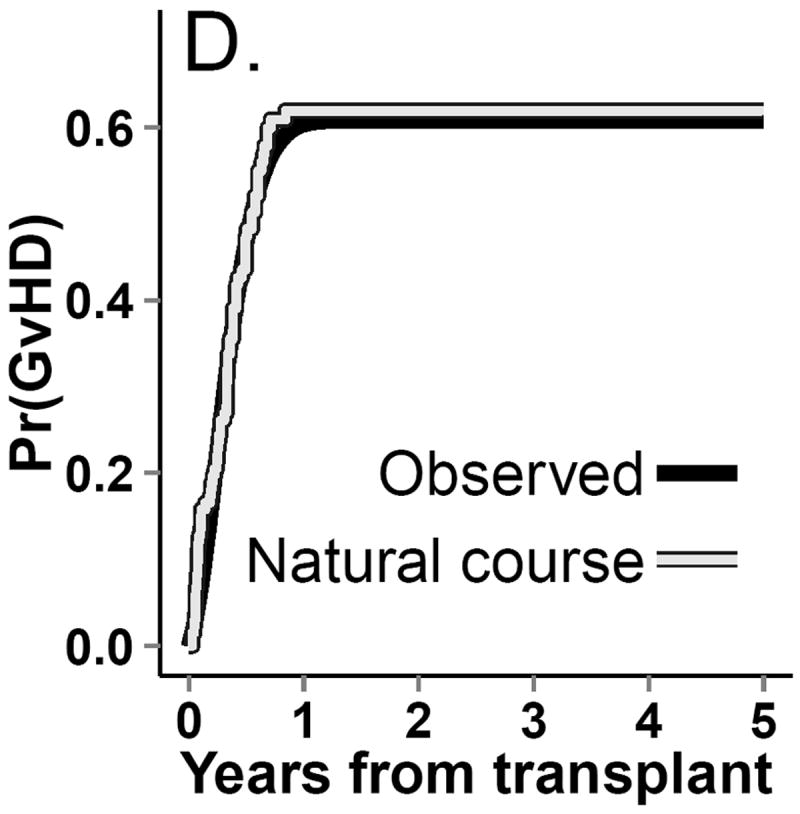
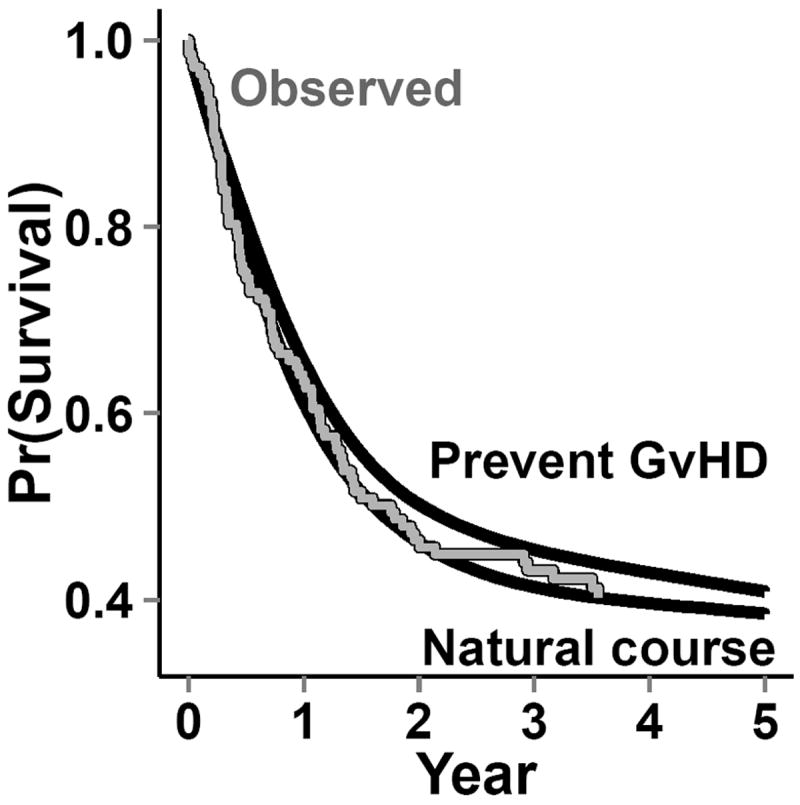
Methods: We provide a simple introduction to the parametric g-formula and illustrate its application in an analysis of a small cohort study of bone marrow transplant patients in which the effect of treatment on mortality is subject to time-varying confounding.
Results: Standard regression adjustment yields a biased estimate of the effect of treatment on mortality relative to the estimate obtained by the g-formula.
Conclusions: The g-formula allows estimation of a relevant parameter for public health officials: the change in the hazard of mortality under a hypothetical intervention, such as reduction of exposure to a harmful agent or introduction of a beneficial new treatment. We present a simple approach to implement the parametric g-formula that is sufficiently general to allow easy adaptation to many settings of public health relevance.
Figures

Comment in
-
Commentary: Applying a causal road map in settings with time-dependent confounding.Epidemiology. 2014 Nov;25(6):898-901. doi: 10.1097/EDE.0000000000000178. Epidemiology. 2014. PMID: 25265135 Free PMC article. No abstract available.
References
-
- Sullivan K, Weiden P, Storb R, Witherspoon R, Fefer A, Fisher L, Buckner C, Anasetti C, Appelbaum F, Badger C. Influence of acute and chronic graft-versus-host disease on relapse and survival after bone marrow transplantation from HLA-identical siblings as treatment of acute and chronic leukemia. Blood. 1989;73:1720–1728. published erratum appears in Blood 1989 Aug 15; 74 (3): 1180. - PubMed
-
- Horowitz MM, Gale RP, Sondel PM, Goldman JM, Kersey J, Kolb HJ, Rimm AA, Ringdén O, Rozman C, Speck B. Graft-versus-leukemia reactions after bone marrow transplantation. Blood. 1990;75:555–562. - PubMed
-
- Robins JM, Wasserman L. Estimation of effects of sequential treatments by reparameterizing directed acyclic graphs. Proceedings of the Thirteenth Conference on Uncertainty in Artificial Intelligence; 1997. pp. 409–420.
-
- Keiding N, Filiberti M, Esbjerg S, Robins JM, Jacobsen N. The graft versus leukemia effect after bone marrow transplantation: A case study using structural nested failure time models. Biometrics. 1999;55:23–28. - PubMed
-
- Hernán MA, Robins JM. Causal Inference. Boca Raton, FL: Chapman & Hall/CRC; 2013.
Publication types
MeSH terms
Grants and funding
LinkOut - more resources
Full Text Sources
Other Literature Sources
Medical
