. 2014 Oct 23;514(7523):503-7.
doi: 10.1038/nature13633. Epub 2014 Aug 20.

Diabetes recovery by age-dependent conversion of pancreatic δ-cells into insulin producers

Affiliations

Diabetes recovery by age-dependent conversion of pancreatic δ-cells into insulin producers

Simona Chera et al. Nature. .

Abstract

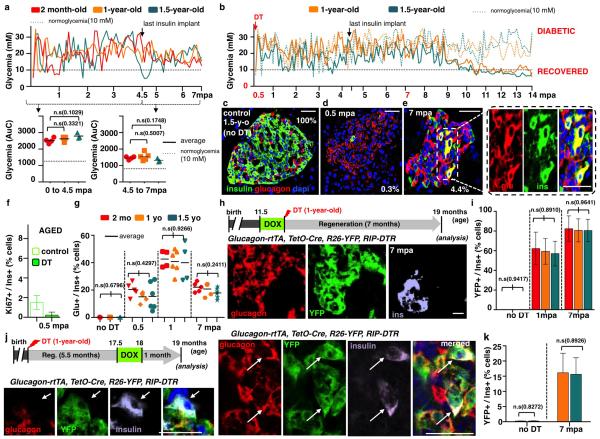
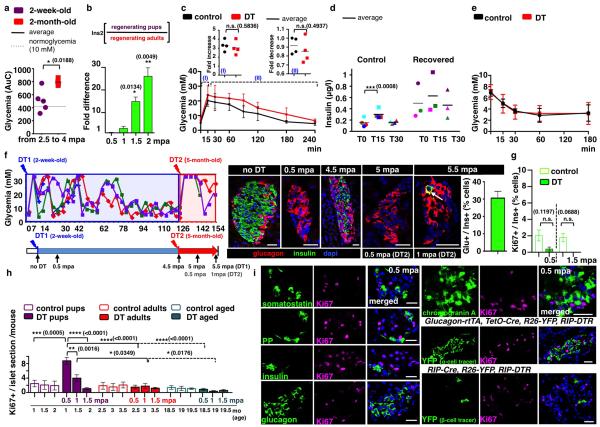
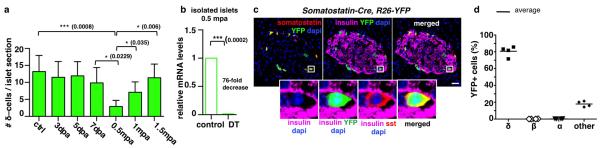
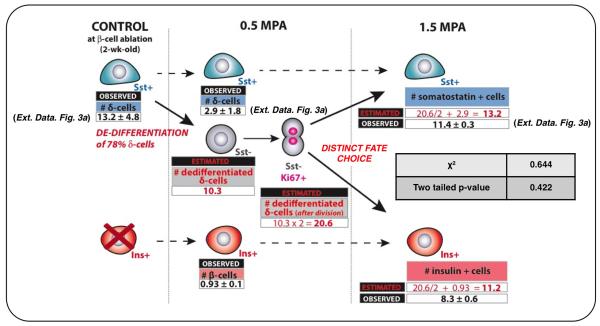
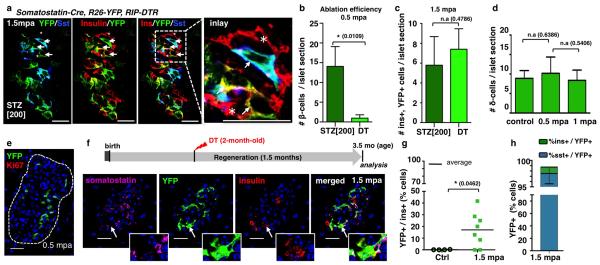
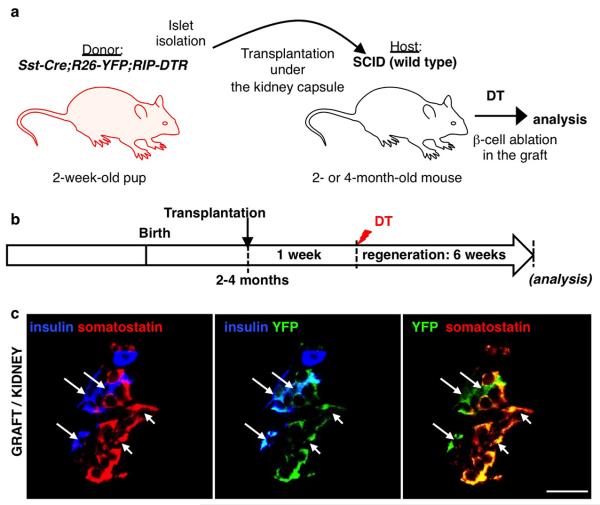
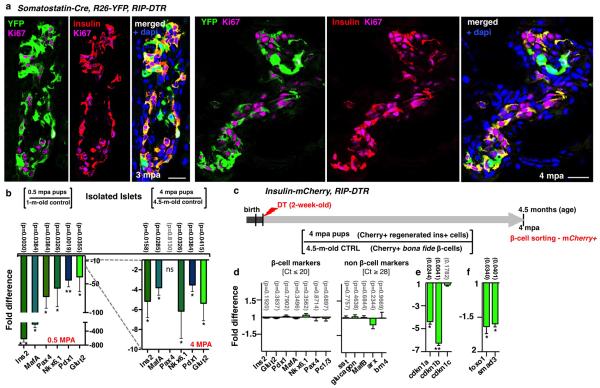
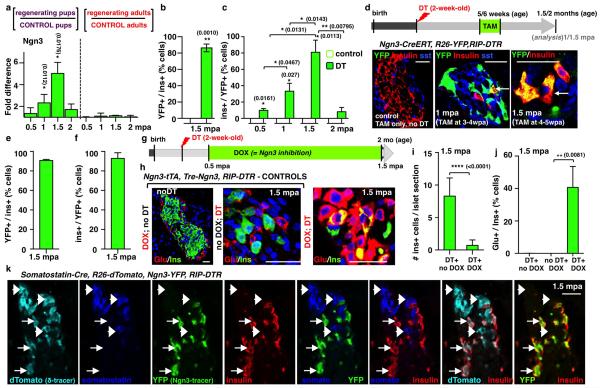
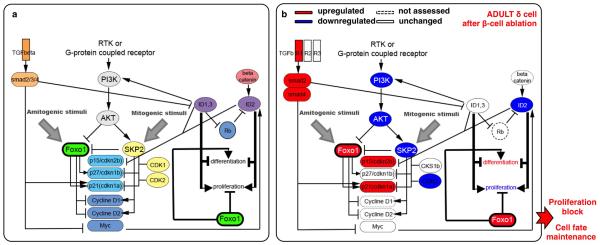
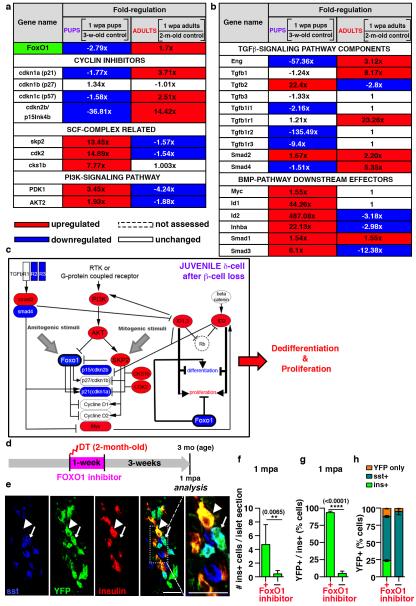
Total or near-total loss of insulin-producing β-cells occurs in type 1 diabetes. Restoration of insulin production in type 1 diabetes is thus a major medical challenge. We previously observed in mice in which β-cells are completely ablated that the pancreas reconstitutes new insulin-producing cells in the absence of autoimmunity. The process involves the contribution of islet non-β-cells; specifically, glucagon-producing α-cells begin producing insulin by a process of reprogramming (transdifferentiation) without proliferation. Here we show the influence of age on β-cell reconstitution from heterologous islet cells after near-total β-cell loss in mice. We found that senescence does not alter α-cell plasticity: α-cells can reprogram to produce insulin from puberty through to adulthood, and also in aged individuals, even a long time after β-cell loss. In contrast, before puberty there is no detectable α-cell conversion, although β-cell reconstitution after injury is more efficient, always leading to diabetes recovery. This process occurs through a newly discovered mechanism: the spontaneous en masse reprogramming of somatostatin-producing δ-cells. The juveniles display 'somatostatin-to-insulin' δ-cell conversion, involving dedifferentiation, proliferation and re-expression of islet developmental regulators. This juvenile adaptability relies, at least in part, upon the combined action of FoxO1 and downstream effectors. Restoration of insulin producing-cells from non-β-cell origins is thus enabled throughout life via δ- or α-cell spontaneous reprogramming. A landscape with multiple intra-islet cell interconversion events is emerging, offering new perspectives for therapy.


Figures

Extended Data Figure 1
Extended Data Figure 1. Maintenance of α-cell plasticity in diabetic aged mice
a) Evolution of glycemia in β-cell-ablated adults (middle-aged) and aged mice. The “area under the curve” (AuC) in middle-aged (2-month-old, n=4) and aged (1- and 1.5-year-old, n=5 and n=3) mice before and after stopping insulin administration revealed no statistical difference between groups (Welch’s test [p[0-45mpa]=0.1029, 0.3321; p[4.5-7mpa]=0.1748, 0.5007], one-way Anova [p=0.1161; p=0.2681], and Mann Whitney [p=0.1640, 0.4519]). b) Evolution of glycemia in 14 aged mice during 14 months post-ablation (“mpa”). Mice were treated with insulin for 4.5 months; most of them (5/7 in each group) subsequently recovered from diabetes. c-e) Pancreatic islets before (c) and after (d, e) β-cell ablation in 1.5-year-old mice; β-cell mass increases 3.5-fold between 0.5 and 1 mpa, 12-fold at 7 mpa and 32-fold at 14 mpa, in all age groups. 0.3% and 4.4% indicate β-cell mass relative to unablated controls (Supp. Table S1, 2-month-old: n(0.5mpa)=4, n(1mpa)=4, n(7mpa)=4; 1-year-old: n(0.5mpa)=5, n(1mpa)=5, n(7mpa)=5, n(14mpa)=8; 1.5-year-old: n(0.5mpa)=3, n(1mpa)=3, n(7mpa)=3 , n(14mpa)=8). f) β-cell proliferation is very low in aged mice, whether control (1.5%, n=8, 39,790 insulin+-cells scored) or ablated (0.2%, n=6, 938 790 insulin+-cells scored) (Supp. Table S2). g) Proportion of insulin+ cells also containing glucagon after DT is not different between groups (Supp. Table S3; control: n[2-month-old]=3, n[1-year-old]=3, n[1.5-year-old]=3; 0.5mpa: n[2-month-old]=5, n[1-year-old]=5, n[1.5-year-old]=6; 1mpa: n[2-month-old]=4, n[1-year-old]=6, n[1.5-year-old]=4; 7mpa: n[2-month-old]=5, n[1-year-old]=5, n[1.5-year-old]=6; one-way Anova [p=0.6796, 0.4297, 0.9266, 0.2411]); note that 40% of the cells containing insulin at 1 mpa also contained glucagon. The proportion of glucagon+/insulin+ cells remains constant between 0.5 and 7 mpa, while the number of insulin+ cells increases with time (e, Supp. Table S1), suggesting that there is acumulative recruitment of α-cells into insulin production. h) Islet with YFP+/glucagon+/insulin+ cells in 1-year-old Glucagon-rtTA; TetO-Cre; R26-YFP; RIP-DTR mice, 7 mpa; rtTA expression allows the selective irreversible YFP-labeling of adult α-cells upon administration of doxycycline (DOX) before β-cell ablation. i) Proportion of YFP-labeled insulin-expressing cells in DOX-treated mice. 80% of insulin+ cells are YFP+ after 7 mpa, in all age groups (Supp. Table S4; control: n[2-month-old]=3, n[1-year-old]=3, n[1.5-year-old]=3; 1mpa: n[2-month-old]=5, n[1-year-old]=3, n[1.5-year-old]=3; 7mpa: n[2-month-old]=5, n[1-year-old]=5, n[1.5-year-old]=5; one-way Anova [p=0.9417, 0.8910, 0.9641]). j,k) YFP+/glucagon+/insulin+ cells at 7 mpa, following a DOX pulse-labeling at 5.5 months after β-cell loss (Supp. Table S5, control: n[1-year-old]=5, n[1.5-year-old]=5; 7mpa: n[1-year-old]=5, n[1.5-year-old]=5; Welch’s correction [p=0.8272,0.8926], Mann-Whitney [p=0.9444]. On average, 15% of the insulin+ cells found were YFP-labeled, some of which no longer contained glucagon as in (j), lower row. Note the decreased proportion of YFP-labeled insulin+ cells when α-cells are tagged late after ablation (from 80% to 15%; compare (i) and (k)), and the presence of YFP-labeled insulin+/glucagon-negative cells in the latter situation (j), suggesting that bihormonal α-cells slowly but gradually lose glucagon gene activity. Scale bars are 20 μm. Error bars: standard deviation (s.d.).
Extended Data Figure 2
Extended Data Figure 2. Diabetes recovery in pre-pubertal mice
a) Evolution of glycemia (“AuC”) between 2.5 and 4 mpa, in pups and adults (see Fig 1b, Welch’s test [p=0.0188]). b) qPCR of insulin2 mRNA after β-cell ablation; insulin2 transcripts are 25-fold more abundant in pups than in adults at 2 mpa (n=3 mice/group, each individual sample was run in triplicate in each reaction, for a total of 3 independent reactions); built-in Welch’s test [p=0.0134, 0.0049], error bars: s.d.). c) Glucose tolerance tests (IPGTT) for DT-treated (4.5 mpa, n=4) and age-matched controls (n=4); note the fold-increase between glucose injection and the glycemic peak during IPGTT for each animal, and fold-decrease between glycemic peak and T120 (two-tailed unpaired t-test, [p(I)=0.5836, p(II)=0.4937]). d) Plasma insulin at T0, T15 and T30 during the IPGTT (control: n=4; DT: n=4; two-tailed paired t-test [p=0.0008]). e) Insulin tolerance tests (ITT) performed 1,5 year after β-cell ablation at 2 weeks of age (controls: n=7; DT: n=10). f) 4.5 months after β-cell ablation (at 2 weeks), 3 mice became normoglycemic and received a second treatment with DT. Ablation of regenerated insulin+-cells in recovered mice leads to the appearance of glucagon+/insulin+ cells, corresponding to the type of “α-cell-dependent” regeneration observed in adults (31% of insulin+ cells also contained glucagon, Supp. Table S8). Arrow: glucagon+/insulin+ bihormonal cell; error bars: s.e.m. g) β-cell proliferation is very low in regenerating pups (Supp. Table S9, control: n[1-mo-old]=3, 6,006 insulin+-cells scored, n[2-mo-old]=3, 6,358 insulin+-cells scored; DT: n[0.5mpa]=5, 412 insulin+-cells scored; n[1.5mpa]=3, 675 insulin+-cells scored; Welch’s test [p=0.1197, p=0.0688], error bars: s.e.m.). h) Islet cell proliferation is increased (3.5-fold; Ki67+ cells) in islets of DT-treated pups at 0.5 mpa (control: n(1-month-old)=3, 95 islets scored; n(1.5-month-old)=3, 94 islets scored; n(2-month-old)=3, 90 islets scored; n(2.5-month-old)=3, 89 islets scored; n(3-month-old ctrl)=3, 91 islets scored; n(3.5-month-old)=3, 93islets scored; n(18.5-month-old)=3, 83 islets scored; 19(19-month-old ctrl)=3, 83 islets scored; n(19.5-month-old)=3, 88 islets scored; DT(2-week-old): n(0.5mpa)=6, 333 islets scored; n(1mpa)=3, 91 islets scored; n(1.5mpa)=3, 90 islets scored; DT(2-month-old): n(0.5mpa)=3, 76 islets scored; n(1mpa)=3, 77 islets scored; n(1.5mpa)=3, 81 islets scored; DT(1.5-year-old): n(0.5mpa)=3, 74 islets scored; n(1mpa)=3, 81 islets scored; n(1.5mpa)=3, 77 islets scored; error bars: s.d. Welch’s test, one-way Anova [p<0.001] Mann-Whitney [p=0.0238]). i) Ki67+ cells are hormone, chromogranin A-negative; lineage-traced α- and DT-spared β-cells are Ki67-negative. Scale bars: 20 μm.
Extended Data Figure 3
Extended Data Figure 3. δ-cell labeling and tracing in transgenic mice
a) The number of somatostatin+ cells transiently decreases by 80% during the 2nd week after ablation (n[control]=255 islets, 7 mice; n[3dpa]=240 islets, 5 mice; n[5dpa]=228 islets, 5 mice; n[7dpa]=251 islets, 5 mice; n[0.5mpa]=267 islets, 6 mice; n[1mpa]=266 islets, 5 mice; n[1.5mpa]=206 islets, 5 mice; error bars: s.d.; Welch’s test [p=0.0008, 0.0229, 0.006, 0.035], one-way Anova [p<0.0001], Mann-Whitney [p=0.0043]). b) Relative somatostatin gene expression sharply decreases 2 weeks after β-cell ablation in 2-week-old mice (n=3 mice/group, each individual sample of each experimental group was run in triplicate, in 3 independent reactions); built-in Welch’s test [p=0.0002], error bars: s.d.). c) Somatostatin-Cre; R26-YFP mice. Cre activity efficiently and specifically occurs in δ-cells (box: enlarged cell). Scale bar: 20 μm. d) Quantitative values of reporter gene expression in islet cells (n=4, 1,263 YFP+-cells scored).
Extended Data Figure 4
Extended Data Figure 4. δ-cells dedifferentiate, proliferate and reprogram into insulin production after extreme β-cell loss in juvenile mice
Observed and expected numbers of somatostatin+ and insulin+ cells per islet section, before and after β-cell ablation. Cells scored after 6 weeks (Extended Data Fig. 3a) correspond (χ2 test) with estimates made assuming that dedifferentiated proliferating δ-cells yield 2 types of progeny (as deduced from Fig. 2c,e). Dashed arrows, phenotypic stability; plain arrows, dynamic behavior (dedifferentiation and replication).
Extended Data Figure 5
Extended Data Figure 5. Regeneration in streptozotocin-treated pups and DT-treated adults
a) Immunofluorescence showing YFP-labeled insulin+ cells at 1.5 month following streptozotocin (STZ)-induced ablation of β-cells in 2-week-old mice. Arrows: YFP+/insulin+ cells; arrowhead: YFP+/somatostatin+ cell; asterisks: escaping β-cells. b) Number of remaining β-cells per islet section at 2 weeks after streptozotocin or DT treatment in pups, reflecting difference in ablation efficiency of the 2 methods (Supp. Table S18)(n[STZ]=87 islets, 3 mice; n[DT]= 361 islets, 4 mice; Welch’s test [inter-islet p<0.0001; inter-individual p=0.0109], Mann-Whitney [p<0.001]). c) The number of YFP+/insulin+ cells per islet section at 1.5 mpa is not significantly different between the two β-cell ablation methods (Supp. Table S19)(n[STZ]=88 islets, 3 mice; n[DT]=193 islets, 7 mice; Welch’s test [p=0.4786]). d) δ-cell numbers per islet section in controls (n=3, 174 islets scored), 0.5 mpa (n=4, 140 islets scored) and 1 mpa (n=3, 86 islets scored) (unpaired t-test, two-tailed, [p=0.6386; p=0.5406]). e) Immunofluorescence for YFP and Ki67 2 weeks (0.5 mpa) after DT, in Somatostatin-Cre; R26-YFP; RIP-DTR mice. f) Experimental design for δ-cell tracing in β-cell-ablated Somatostatin-Cre; R26-YFP; RIP-DTR mice at 2 months of age, and immunofluorescence for somatostatin, YFP and insulin at 1.5 mpa. Arrow: YFP+/insulin+/somatostatin cell. g) At 1.5 mpa, 17% of insulin+ cells coexpress YFP vs. almost 100% in ablated prepubescent mice (control: n=4; DT: n=8; unpaired t-test, two-tailed [p=0.0462]). h) At 1.5 mpa, 98% of the YFP+ cells are somatostatin+, and 1% are insulin+ cells (vs. 44% in mice ablated before puberty; n=8, unpaired t-test, two-tailed). Scale bars: 20 μm. Error bars: s.d.
Extended Data Figure 6
Extended Data Figure 6. δ-to-β cell conversion after β-cell ablation is maintained in young islets ablated underneath the kidney capsule of adult hosts
a) Islet transplantation design: 400-600 islets isolated from 2-week-old Somatostatin-Cre; R26-YFP; RIP-DTR transgenics were transferred under the kidney capsule of 2-month-old immunodeficient (SCID) mice (n=3). b) Experimental design: after one week of engraftment, adult host mice were DT-treated and left to regenerate for 6 weeks. c) δ- to-β conversion was observed in β-cell-ablated engrafted islets, like in the pancreas of juvenile mice. Scale bars: 20 μm
Extended Data Figure 7
Extended Data Figure 7. Characterization of δ-cell-derived regenerated insulin+ cells
Once differentiated from δ-cells (YFP+), the newly formed β-cells re-enter the cell cycle (Ki67+ cells). Two waves of massive replication occur, at 3 and 4 months after injury, respectively (Supp. Table S23). b) qPCR for β-cell-specific genes using RNA extracted from islets isolated from control and DT-treated mice, either 2 weeks or 4 months following DT administration (“0.5 mpa” and “4 mpa”). Note that after an initial extreme downregulation of all the β-cell-specific markers explored, their levels significantly recover after 4 months, which correlates with the observed robust regeneration and diabetes recovery. Values represent the ratio between each regeneration time-point and its age-matched control. c) Experimental design. d) qPCR comparison between regenerated cherry+/insulin+ cells isolated from mice 4 months after β-cell ablation, and cherry+ β-cells obtained from age-matched controls (4.5-month-old). All markers tested are expressed at identical levels in both groups; non-β-cell markers are expressed at extremely reduced levels (CT ranging from 28 to 31), showing the same degree of purity in both types of cell preparations. e, f) Interestingly, in contrast to bona fide β-cells isolated from 4.5-month-old controls, regenerated insulin+ cells have lower levels of cyclin-dependent kinase inhibitors, FoxO1 and Smad3. This correlates with their increased proliferative capacity at this specific time-point. Scale bars: 20 μm; qPCRs: n=3 mice/group, each individual sample of each experimental group was run in triplicate, in 3 independent reactions); built-in Welch’s test; error bars: s.d.
Extended Data Figure 8
Extended Data Figure 8. Ngn3 activation is required for insulin expression in dedifferentiated δ-cells
a) qPCR for Ngn3 mRNA after β-cell ablation reveals a transitory 5-fold upregulation of Ngn3 transcripts 6 weeks after β-cell ablation when β-cell ablation is performed before puberty, but not in adult mice. (controls: n[1-month-old]=3, n[1.5-month-old]=3, n[2-month-old]=6, n[2.5-month-old]=3, n[2.5-month-old]=3, n[3-month-old]=3, n[3.5-month-old]=3, n[4-month-old]=3; DT(2-week-old): n[0.5mpa]=3, n[1mpa]=3, n[1.5mpa]=6, n[2mpa]=3; DT(2-month-old): n[0.5mpa]=3, n[1mpa]=3, n[1.5mpa]=3, n[2mpa]=3; each individual sample (mouse) was run in triplicate, in each one of 3 independent reactions; built-in Welch’s test [p=0.0112, 0.0178]). b) Ngn3 transcriptional activity can be monitored in Ngn3-YFP knock-add-on mice because Ngn3 promoter activity results in YFP expression. In non-ablated age-matched control pups, or in ablated adults, no islet YFP+ cells were found (not shown), yet when β-cells are ablated at 2 weeks of age, 86% of insulin+ cells also express YFP+ at 1.5 mpa (control: n=3, 6,358 insulin+-cells scored DT: n=3, 675 insulin+-cells scored; Welch’s test [p=0.0010]); c) At 1.5 mpa, 81% of YFP+ cells co-express insulin, but no glucagon, somatostatin or PP (not shown). Two weeks later, YFP+ cells are almost absent, reflecting the downregulation of Ngn3 expression reported in a), and suggesting that insulin+ cells originate from cells transiently activating Ngn3 expression after ablation (control: n[1-month-old]=3; n[1.5-month-old]=3; n[2-month-old]=3; n[2.5-month-old]=3; absent YFP+-cells in all control conditions; DT: n[0.5mpa]=3, 31 YFP+-cells; n[1mpa]=3, 123 YFP+-cells; n[1.5mpa]=3, 729 YFP+-cells; n[2mpa]=3; 47 YFP+-cells; Welch’s test and Anova [p<0.0001]). d) Irreversible lineage-tracing of Ngn3-expressing cells at 1 and 1.5 mpa upon tamoxifen (TAM) administration in Ngn3-CreERT; R26-YFP; RIP-DTR mice; immunofluorescence analyses reveal that in absence of β-cell ablation, there is no YFP induction (controls). In ablated mice, nearly all insulin+ cells are YFP+ with time (arrows). At early time-points (1 mpa), YFP+/hormone-negative cells are found: these are likely differentiating cells before insulin expression. e, f) In β-cell-ablated Ngn3-CreERT; R26-YFP; RIP-DTR pups, 91% of insulin+ cells coexpress YFP+ (control: n=3, 3,472 insulin+-cells scored, DT: n=3, 489 insulin+-cells scored) (e) and inversely, 93% of the YFP+ cells are insulin+ (f) (control: n=3; absent YFP+-cells in all control conditions, DT: n=3, 478 YFP+-cells scored). g) Experimental design to block Ngn3 upregulation in β-cell-ablated prepubescent mice, by administrating DOX to mice bearing 5 mutant alleles: Ngn3-tTA+/+; TRE-Ngn3+/+; RIP-DTR. In these mice the Ngn3 coding region is replaced by a DOX-sensitive transactivator gene (tTA); the endocrine pancreas develops normally because Ngn3 expression is allowed in absence of DOX by the binding of tTA to the promoter of TRE-Ngn3 transgene. Pups were given DT at 2 weeks of age and then DOX 2 weeks later, to block Ngn3 upregulation. They were euthanized when Ngn3 peaks after ablation (2-month-old).h) Islets from non-ablated (“no DT”) and ablated (“DT”) mice, exposed (Ngn3 inhibition) or not (normal Ngn3 expression) to DOX treatment from 4 weeks of age. β-cell regeneration is efficient in absence of DOX (as previously shown), but decreases after Ngn3 blockade, resulting in the appearance of glucagon/insulin bihormonal cells. i) Sharply decreased regeneration by blocking Ngn3 expression in DOX-treated mice reveals the requirement of Ngn3 for efficient β-cell regeneration in pups (DT: n=266 islets scored, 3 mice; DT+DOX: n=167, 4 mice; Welch’s test [inter-islet p<0.0001; inter-animal p=0.0352], Mann-Whitney [p<0.0001]). j) glucagon+/insulin+ bihormonal cells appear in DOX-treated β-cell-ablated pups (Ngn3 inhibition), suggesting a switch to an “adult-like”, less efficient, mechanism of regeneration (control+DOX: n=3, 9233 insulin+-cells scored; DT: n=3 1385 insulin+-cells scored; DT+DOX: n=4, 141 insulin+-cells scored; Welch’s test [p=0.0081], Anova [p<0.0001]). k) Combined double lineage tracing of δ-cells (Tomato+) and Ngn3-expressing cells (YFP+) show by immunofluorescence that nearly all insulin+ cells express both reporters, but no somatostatin (arrows). Somatostatin+ cells (arrowheads) are YFP- and insulin-negative. Scale bars: 20 μm. Error bars: s.d.
Extended Data Figure 9
Extended Data Figure 9. FoxO1 regulatory network
a) Cartoon depicting the FoxO1 network involved in the regulation of cell cycle progression and cellular senescence: FoxO1 arrests the cell cycle by repressing activators (cyclinD1, cyclinD2) and inducing inhibitors (cdkn1a/p21, cdkn1b/p27, cdkn2b/p15Ink4b, cdkn1c/p57) [PMID: 10102273; PMID: 17873901]. cdkn1a/p21 and cdkn2b/p15Ink4b activation, a sign of cellular senescence [PMID: 17667954], is regulated by FoxO1 through direct interaction with Skp2 protein. In turn, Skp2 blocks FoxO1 and, together with CKS1b, CDK1 and CDK2, triggers the direct degradation of cdkn1a/p21 and cdkn1b/p27, thus promoting proliferation [PMID: 15668399]. FoxO proteins are inhibited mainly through PI3K/AKT-mediated phosphorylation [PMID: 10102273, PMID: 12621150, PMID: 21708191, PMID: 10217147, PMID: 17604717]: PDK1, the master kinase of the pathway, stimulates cell proliferation and survival by directly activating AKT, which phosphorylates (inhibits) the FoxOs [PMID: 10698680, PMID: 19635472]. PI3K/AKT/FoxO1 circuit requires active TGFβ/SMAD signaling [PMID: 24238962, PMID: 15084259] in order to co-regulate cdkn1a/p21-dependent cell senescence. Active TGFβ signaling downregulates the BMP pathway downstream effectors ID1 and ID2, known to promote dedifferentiation and proliferation during embryogenesis and cancer progression, probably through cdkn2b/p15Ink4b regulation [PMID: 11840321, PMID: 16034366]. b) β-cell ablation in adults triggers FoxO1 upregulation and the subsequent cell cycle arrest in δ-cells.
Extended Data Figure 10
Extended Data Figure 10. δ-cell dedifferentiation in adult mice upon transient FoxO1 inhibition
a-d) The 1 week FoxO1 inhibition with the compound AS1842856 in control unablated adult mice (a) results in dedifferentiation of one-fourth of the δ-cell population (b; Supp. Table S30, treated: n=3, 1,347 YFP+-cells scored; untreated: n=4, 1,224, YFP+-cells scored; error bars: s.d.), without leading to insulin (c; Supp. Table S31, treated: n=3, 3,249 insulin+-cells scored; untreated: n=4, 9,562 insulin+-cells scored; error bars: s.d.; Welch’s test [p=0.1590]) or glucagon (d; Supp. Table S32, treated: n=2, 728 YFP+-cells scored; error bars: s.e.m.) expression. e) One month following FoxO1 transient inhibition in β-cell-ablated adults, dedifferentiated δ-cells do not express glucagon (Supp. Table S36, treated: n=2, 986 YFP+-cells scored; error bars: s.e.m.). f) Transient FoxO1 inhibition long-time (1 month) after β-cell ablation also leads to the appearance of lineage-traced dedifferentiated δ-cells that express insulin (Supp. Table S37-39, treated: n=3, 71 islets scored; 300 insulin+-cells scored; 1216 YFP+-cells scored; error bars: s.d.). Scale bars: 20 μm.
Figure 1
Figure 1. β-cell ablation before puberty and diabetes recovery
a) Experimental designs depicting the ages at DT-administration and the various analyses (“mpa”, months post-ablation). b) Comparative evolution of glycemia in β-cell-ablated younglings (n=5) and middle-aged adults (n=4); 2.5 months after β-cell ablation, insulin administration was stopped (Mann-Whitney [p=0.0014]). c) Islets from 2-week-old (“control”), 0.5 mpa and 4 mpa (Supp. Table S6). d) α-cell tracing in pups. Scale bars: 20μm.
Figure 2
Figure 2. δ-cells dedifferentiate, proliferate and reprogram into insulin production after extreme β-cell loss in Somatostatin-Cre; R26-YFP; RIP-DTR juvenile mice
a) Immunofluorescence for YFP and Ki67 at 0.5 mpa. b) 80% of somatostatin-traced YFP+ cells are Ki67+ after β-cell-ablation (controls: n=6, 2,754 YFP+-cells scored; DT: n=6; 3,146 YFP+-cells scored; Welch’s test [p<0.0001], Mann-Whitney [p=0.0022]). c, d) At 1.5 mpa 90% of insulin+ cells coexpress YFP (controls: n=3, 6,480 insulin+-cells scored;DT: n=7, 1,592 insulin+-cells scored; Welch’s test [p<0.0001], Mann-Whitney [p=0.0167]). Arrow: YFP+/somatostatin+ cells; arrowhead: YFP+/insulin+ cells;. e) In controls, 99.9% of the YFP+ cells are somatostatin+ (n=3, 1,673 YFP+-cells scored). In contrast, at 1.5 mpa only 55% of the YFP+ cells are somatostatin+, while 45% of the YFP+ cells are insulin+ (n=5, 2,295 YFP+-cells scored; Welch’s test [p<0.0001], Mann-Whitney [p=0.0357]). f) Comparative evolution of glycemia after β-cell (n=5), δ-cell (n=4) and β- & δ-cell co-ablation (n=5) in younglings. g) δ-cell conversion sequence. Scale bars: 20 μm. Error bars: s.d.
Figure 3
Figure 3. Age-dependent effect of β-cell loss on δ-cells
a, b) Transcriptional variation of cell cycle regulators, PI3K/AKT/FoxO1 network genes (a), and TGFβ and BMP components and effectors (b) in juvenile and adult δ cells 1 week after ablation, as compared with age-matched controls. c) β-cell loss before puberty triggers FoxO1 downregulation in δ-cells, while the opposite occurs in adults (see Extended Data Fig.9b). d) Experimental design to transiently inhibit FoxO1 in β-cell-ablated adult mice. e) Induction of δ-to-insulin cell conversion in diabetic adult mice. Scale bars: 20 μm. f,g) Insulin+ cells are 11-fold more abundant in FoxO1 inhibitor-treated mice (treated: n=190 islets, 4 mice; untreated: n=95 islets, 3 mice (Welch’s test [inter-islet p<0.0001, inter-individual p=0.0065], Mann-Whitney [p<0.0001]) (f), and they are YFP+ (93%) (treated: n=4, 894 insulin+-cells scored; untreated: n=6, 370 insulin+-cells scored, Welch’s test [p<0.0001], Mann-Whitney [p=0.0095]) (g). h) One fourth of δ-(YFP+) cells in adult β-cell-ablated FoxO1-inhibited mice dedifferentiate and become insulin expressers (treated: n=4, 3,358 YFP+-cells scored; untreated: n=6, 2,559 YFP+-cells scored). Error bars: s.d.

Comment in

References

    1. Matveyenko AV, Butler PC. Relationship between beta-cell mass and diabetes onset. Diabetes, obesity & metabolism. 2008;10(Suppl 4):23–31. - PMC - PubMed
    1. Atkinson MA. The pathogenesis and natural history of type 1 diabetes. Cold Spring Harbor perspectives in medicine. 2012;2 doi:10.1101/cshperspect.a007641. - PMC - PubMed
    1. Thorel F, et al. Conversion of adult pancreatic alpha-cells to beta-cells after extreme beta-cell loss. Nature. 2010;464:1149–1154. - PMC - PubMed
    1. Desgraz R, Herrera PL. Pancreatic neurogenin 3-expressing cells are unipotent islet precursors. Development. 2009;136:3567–3574. doi:10.1242/dev.039214. - PMC - PubMed
    1. Al-Masri M, et al. Effect of forkhead box O1 (FOXO1) on beta cell development in the human fetal pancreas. Diabetologia. 2010;53:699–711. doi:10.1007/s00125-009-1632-0. - PubMed

Publication types

MeSH terms