. 2014 Aug 20;9(8):e105542.
doi: 10.1371/journal.pone.0105542. eCollection 2014.

Predicting progression of Alzheimer's disease using ordinal regression

Affiliations

Predicting progression of Alzheimer's disease using ordinal regression

Orla M Doyle et al. PLoS One. .

Abstract

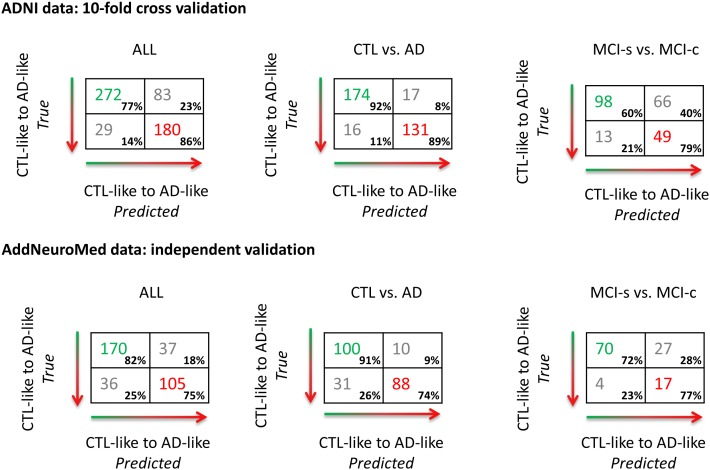
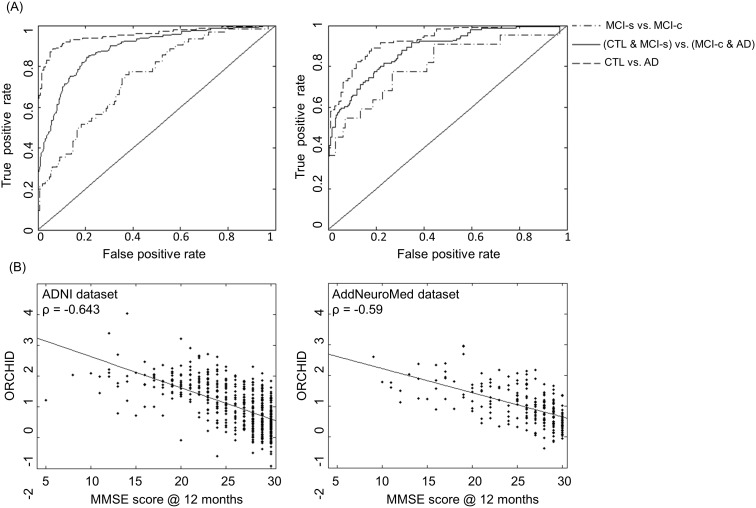
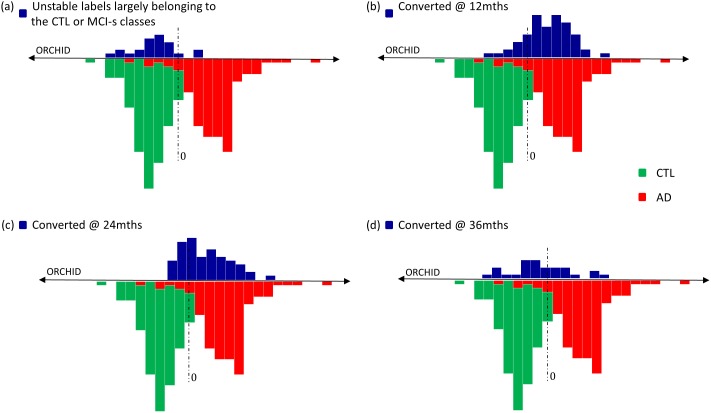
We propose a novel approach to predicting disease progression in Alzheimer's disease (AD)--multivariate ordinal regression--which inherently models the ordered nature of brain atrophy spanning normal aging (CTL) to mild cognitive impairment (MCI) to AD. Ordinal regression provides probabilistic class predictions as well as a continuous index of disease progression--the ORCHID (Ordinal Regression Characteristic Index of Dementia) score. We applied ordinal regression to 1023 baseline structural MRI scans from two studies: the US-based Alzheimer's Disease Neuroimaging Initiative (ADNI) and the European based AddNeuroMed program. Here, the acquired AddNeuroMed dataset was used as a completely independent test set for the ordinal regression model trained on the ADNI cohort providing an optimal assessment of model generalizability. Distinguishing CTL-like (CTL and stable MCI) from AD-like (MCI converters and AD) resulted in balanced accuracies of 82% (cross-validation) for ADNI and 79% (independent test set) for AddNeuroMed. For prediction of conversion from MCI to AD, balanced accuracies of 70% (AUC of 0.75) and 75% (AUC of 0.81) were achieved. The ORCHID score was computed for all subjects. We showed that this measure significantly correlated with MMSE at 12 months (ρ = -0.64, ADNI and ρ = -0.59, AddNeuroMed). Additionally, the ORCHID score can help fractionate subjects with unstable diagnoses (e.g. reverters and healthy controls who later progressed to MCI), moderately late converters (12-24 months) and late converters (24-36 months). A comparison with results in the literature and direct comparison with a binary classifier suggests that the performance of this framework is highly competitive.


Conflict of interest statement

Competing Interests: The authors have declared that no competing interests exist.

Figures

Figure 1
Figure 1. Confusion matrices for ordinal regression applied to two AD-related cohorts.
The confusion matrix for the binarised CTL-like vs. AD-like (CTL and MCI-s vs. MCI-c and AD) is displayed on the left. For illustration purposes, on the right confusion matrices for two contrasts of interest: CTL vs. AD and MCI-s vs. MCI-c (note: training scheme is unchanged). The top panel displays the results achieved using 10-fold cross-validation on the ADNI dataset. The bottom panel displays the results achieved by applying the ordinal regression model trained on the ADNI dataset to the AddNeuroMed data set whereby the AddNeuroMed dataset represents an independent unseen validation of the performance of the method.
Figure 2
Figure 2. Performance curves and correlation plots for ordinal regression.
(A): ROC curves for ordinal regression applied to the ADNI data set using 10-fold cross-validation (first panel) and using the AddNeuroMed data set as an independent test set. In both cases the ROC curves are shown from three contrasts. (B): Correlation plots of the MMSE score assessed at the 12 month follow-up against the Ordinal Regression Characteristic Index of Dementia (ORCHID) score for both the ADNI dataset and the AddNeuroMed dataset.
Figure 3
Figure 3. Multivariate discriminative weights computed using ordinal regression.
For ordinal regression the weights can be interpreted as the projection of the data along the function space weight vector spanning CTL to MCI-s to MCI-s to AD. Note that the weights are symmetric across hemispheres. These weights are sensitive the spatial correlations in the data and therefore should not be interpreted in a univariate manner.
Figure 4
Figure 4. Distribution of the ORCHID (Ordinal Regression Characteristic Index of Dementia) score extracted from for the ADNI dataset representing the disease progressive continuum spanning CTL to MCI-s to MCI-c to AD.
The lower portion of each plot represents the distributions for the CTL class (green) and the AD class (red). (a) represents the distribution of subjects with unstable labels across follow-ups, most of which appear to belong to either the CTL or MCI-s classes (N = 24). (b) represents the distribution of those who convert to AD by 12 month follow-up (N = 62) (i.e. MCI-c: the sample used for training and testing the ADNI-based ORGP model). (c) represents the distribution of those who convert to AD between the 12 and 24 month follow-up (N = 58). (d) represents the distribution of those who convert to AD between the 24 and 36 month follow-up (N = 29).

References

    1. Cuingnet R, Gerardin E, Tessieras J, Auzias G, Lehericy S, et al. (2011) Automatic classification of patients with Alzheimer’s disease from structural MRI: a comparison of ten methods using the ADNI database. Neuroimage 56: 766–781. - PubMed
    1. Davatzikos C, Bhatt P, Shaw LM, Batmanghelich KN, Trojanowski JQ (2011) Prediction of MCI to AD conversion, via MRI, CSF biomarkers, and pattern classification. Neurobiol Aging 32. - PMC - PubMed
    1. Eskildsen SF, Coupe P, Garcia-Lorenzo D, Fonov V, Pruessner JC, et al. (2013) Prediction of Alzheimer’s disease in subjects with mild cognitive impairment from the ADNI cohort using patterns of cortical thinning. Neuroimage 65: 511–521. - PMC - PubMed
    1. Fan Y, ADNI (2011) Ordinal ranking for detecting mild cognitive impairment and Alzheimer’s disease based on multimodal neuroimages and CSF biomarkers. Proceedings of the First international conference on multimodal brain image analysis. Toronto, Canada: Springer-Verlag. 44–51.
    1. Gray KR, Aljabar P, Heckemann RA, Hammers A, Rueckert D (2013) Random forest-based similarity measures for multi-modal classification of Alzheimer’s disease. Neuroimage 65: 167–175. - PMC - PubMed

Publication types