. 2015 Jan;36(1):120-36.
doi: 10.1002/hbm.22617. Epub 2014 Aug 21.

Overlapping patterns of brain activation to food and cocaine cues in cocaine abusers: association to striatal D2/D3 receptors

Affiliations

Overlapping patterns of brain activation to food and cocaine cues in cocaine abusers: association to striatal D2/D3 receptors

Dardo Tomasi et al. Hum Brain Mapp. 2015 Jan.

Abstract

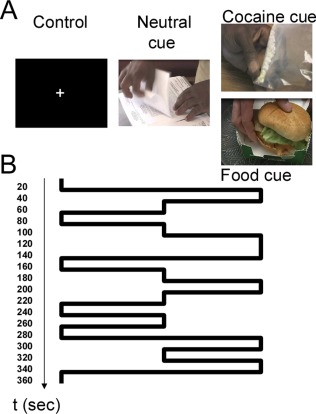
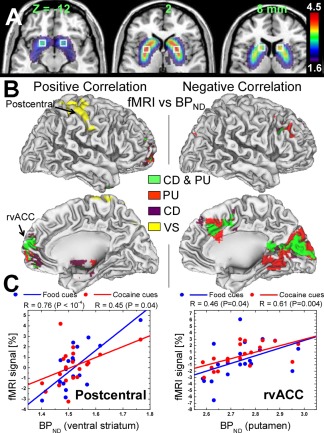
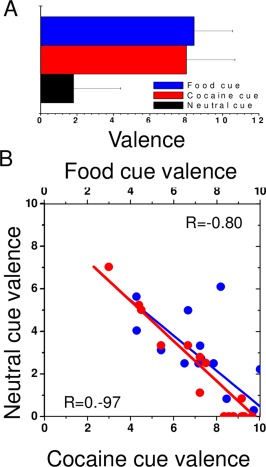
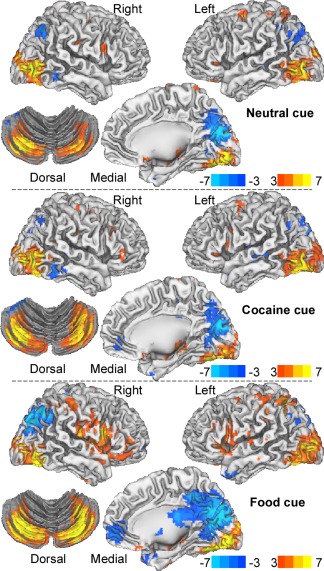
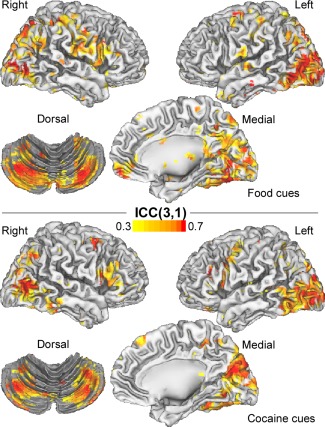
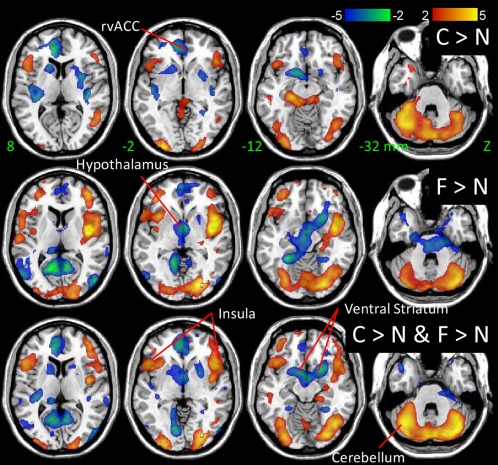
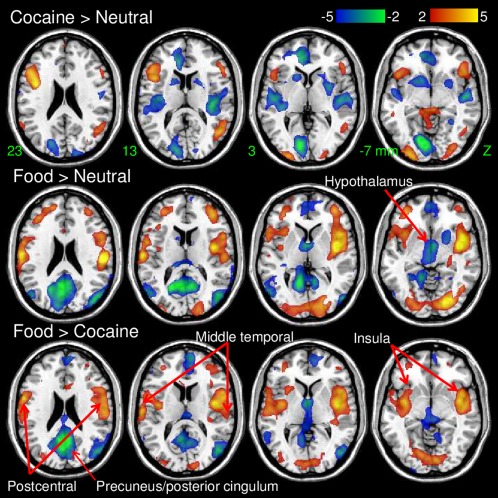
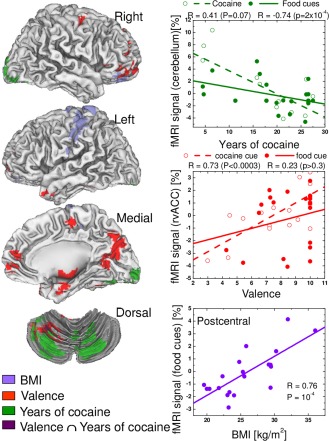
Cocaine, through its activation of dopamine (DA) signaling, usurps pathways that process natural rewards. However, the extent to which there is overlap between the networks that process natural and drug rewards and whether DA signaling associated with cocaine abuse influences these networks have not been investigated in humans. We measured brain activation responses to food and cocaine cues with fMRI, and D2/D3 receptors in the striatum with [11C]raclopride and Positron emission tomography in 20 active cocaine abusers. Compared to neutral cues, food and cocaine cues increasingly engaged cerebellum, orbitofrontal, inferior frontal, and premotor cortices and insula and disengaged cuneus and default mode network (DMN). These fMRI signals were proportional to striatal D2/D3 receptors. Surprisingly cocaine and food cues also deactivated ventral striatum and hypothalamus. Compared to food cues, cocaine cues produced lower activation in insula and postcentral gyrus, and less deactivation in hypothalamus and DMN regions. Activation in cortical regions and cerebellum increased in proportion to the valence of the cues, and activation to food cues in somatosensory and orbitofrontal cortices also increased in proportion to body mass. Longer exposure to cocaine was associated with lower activation to both cues in occipital cortex and cerebellum, which could reflect the decreases in D2/D3 receptors associated with chronicity. These findings show that cocaine cues activate similar, though not identical, pathways to those activated by food cues and that striatal D2/D3 receptors modulate these responses, suggesting that chronic cocaine exposure might influence brain sensitivity not just to drugs but also to food cues.

Keywords: PET; addiction; fMRI; obesity; reward.


Figures

Figure 1
Figure 1
(A) The cue video stimulation tasks features control (black screen with and a fixation center cross), neutral and either cocaine or food video epochs (20 s long) portraying scenes that simulated purchase, preparation, and smoking of cocaine (cocaine cue video), or serving and consumption of the restaurant foods (food cue video). (B) Time course of the 6‐min long stimulation paradigm showing that each video epoch lasted 20 s and occurred in pseudo random order. [Color figure can be viewed in the online issue, which is available at http://wileyonlinelibrary.com.]
Figure 2
Figure 2
(A) Binding potential superimposed on axial MRI views of the human brain showing the availability of DA D2/D3 receptors in the striatum. PET with [11C]raclopride was used to compute DVs relative to values in the cerebellum, which correspond to the nondisplaceable binding potential in each voxel (BPND). White squares highlight the regions‐of‐interest in ventral striatum (Z = −12 mm), putamen (Z = +2 mm) and caudate (Z = +8 mm). (B) Brain regions showing significant positive (left panel) and negative (right panel) correlations between brain activation and the availability of DA D2/D3 receptors in ventral striatum (VS), putamen (PU) and caudate (CD) and their overlapping correlation patterns (CD & PU). (C) Scatter plots showing the association between the availability of DA D2/D3 receptors in the striatum and fMRI responses in postcentral gyrus and rostal ventral PFC across subjects. [Color figure can be viewed in the online issue, which is available at http://wileyonlinelibrary.com.]
Figure 3
Figure 3
Behavioral responses during cue video stimulation. (A) The subjects were instructed to press a response button whenever they liked features of the scene. The number of button presses was used to determine how much the subjects liked the cocaine, food, and neutral scenes in the videos in a scale from 0 to 10. (B) Scatter plots showing the strong negative correlation between cocaine liking scores and neutral liking scores (red) and the weak negative correlation between food liking scores and neutral liking scores (blue) across subjects. [Color figure can be viewed in the online issue, which is available at http://wileyonlinelibrary.com.]
Figure 4
Figure 4
Statistical significance of brain activation (red‐yellow)/deactivation (blue‐cyan) responses to the cue videos relative to the fixation baseline epochs, rendered on lateral and ventral views of the cerebrum and a dorsal view of the cerebellum. [Color figure can be viewed in the online issue, which is available at http://wileyonlinelibrary.com.]
Figure 5
Figure 5
Intraclass correlation (ICC) maps, rendered on lateral and ventral views of the cerebrum and a dorsal view of the cerebellum, depicting the reliability of the fMRI signals. The ICC(3,1) voxel values were computed from BOLD‐fMRI responses to food and cocaine cues recorded on two study days under identical conditions using the same MRI acquisition parameters. [Color figure can be viewed in the online issue, which is available at http://wileyonlinelibrary.com.]
Figure 6
Figure 6
Statistical significance of brain coactivation responses to the cocaine and food cues relative to that of the neutral cues rendered on axial views of the human brain. SPM8 model: ANCOVA. Color bars are t‐scores. [Color figure can be viewed in the online issue, which is available at http://wileyonlinelibrary.com.]
Figure 7
Figure 7
Statistical significance of differential activation responses to the cues rendered on axial views of the human brain. SPM8 model: ANCOVA. Color bars are t‐scores. [Color figure can be viewed in the online issue, which is available at http://wileyonlinelibrary.com.]
Figure 8
Figure 8
Correlation patterns between the average activation to cocaine and food cues and BMI, cue valence and years of cocaine use and their overlap (Valence ∩ Years of cocaine use), superimposed on lateral and ventral views of the cerebrum and a dorsal view of the cerebellum (left), as well as the corresponding linear regression plots showing the significant correlation of these variables (right). [Color figure can be viewed in the online issue, which is available at http://wileyonlinelibrary.com.]

References

    1. Bennett C, Miller M (2013): fMRI reliability: Influences of task and experimental design. Cogn Affect Behav Neurosci 13:690–702. Doi:10.3758/s13415-013-0195-1. - DOI - PubMed
    1. Bernier B, Whitaker L, Morikawa H (2011): Previous ethanol experience enhances synaptic plasticity of NMDA receptors in the ventral tegmental area. J Neurosci 31:5205–5212. - PMC - PubMed
    1. Berridge K, Robinson T (2003): Parsing reward. Trends Neurosci 26:507–513. - PubMed
    1. Boileau I, Dagher A, Leyton M, Welfeld K, Booij L, Diksic M, Benkelfat C (2007): Conditioned dopamine release in humans: A positron emission tomography [11C]raclopride study with amphetamine. J Neurosci 27:3998–4003. - PMC - PubMed
    1. Bolla K, Ernst M, Kiehl K, Mouratidis M, Eldreth D, Contoreggi C, Matochik J, Kurian V, Cadet J, Kimes A, Funderburk F, London E (2004): Prefrontal cortical dysfunction in abstinent cocaine abusers. J Neuropsychiatry Clin Neurosci 16:456–464. - PMC - PubMed

Publication types

MeSH terms