. 2014 Aug 21;512(7514):333-7.
doi: 10.1038/nature13669.

X-ray structures of GluCl in apo states reveal a gating mechanism of Cys-loop receptors

Affiliations

X-ray structures of GluCl in apo states reveal a gating mechanism of Cys-loop receptors

Thorsten Althoff et al. Nature. .

Abstract

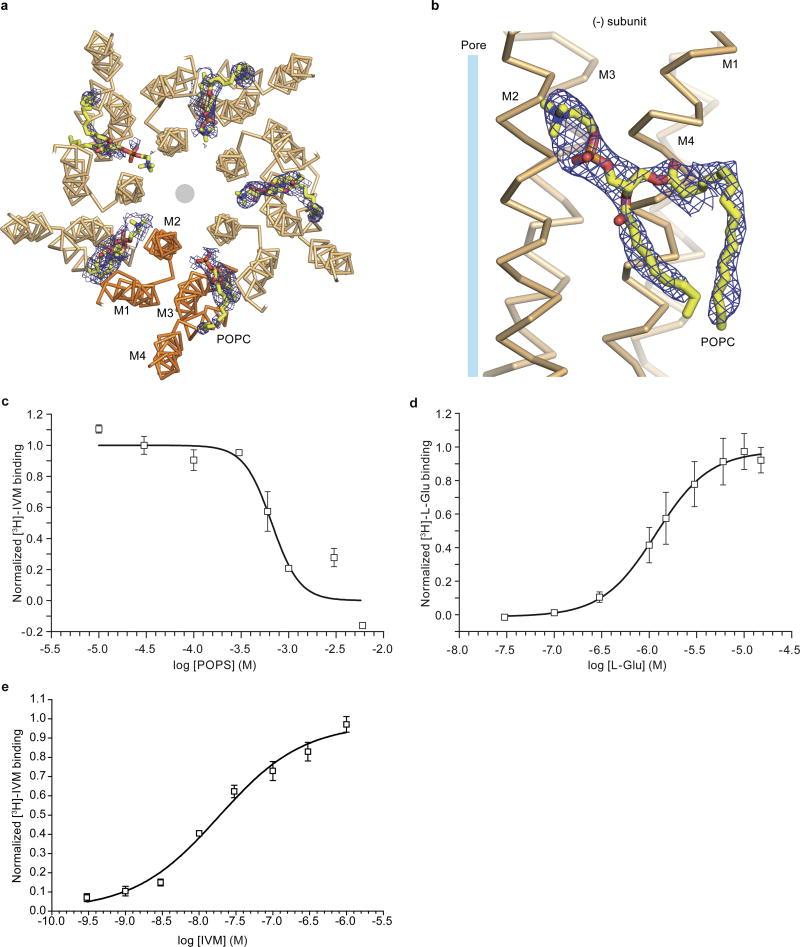
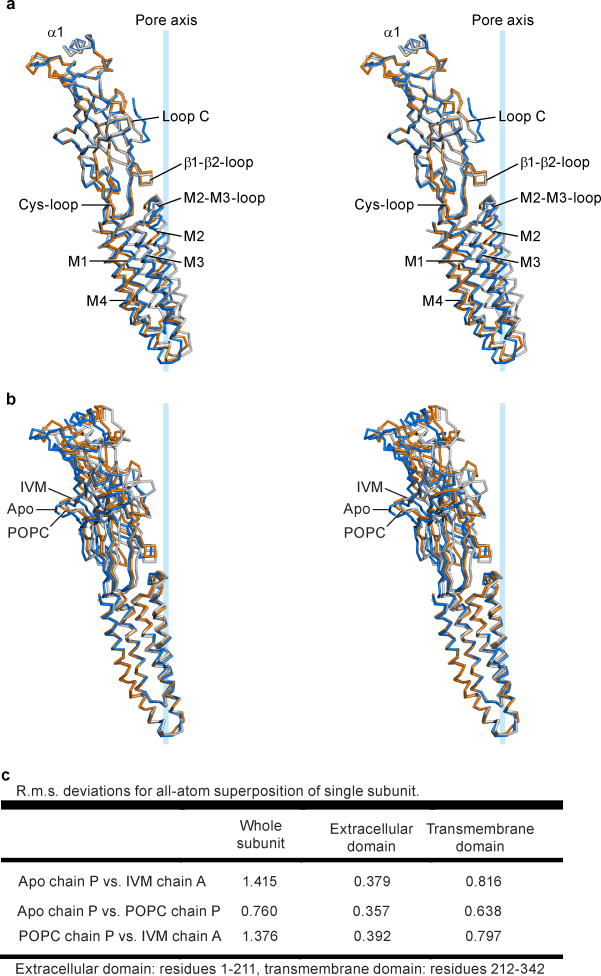
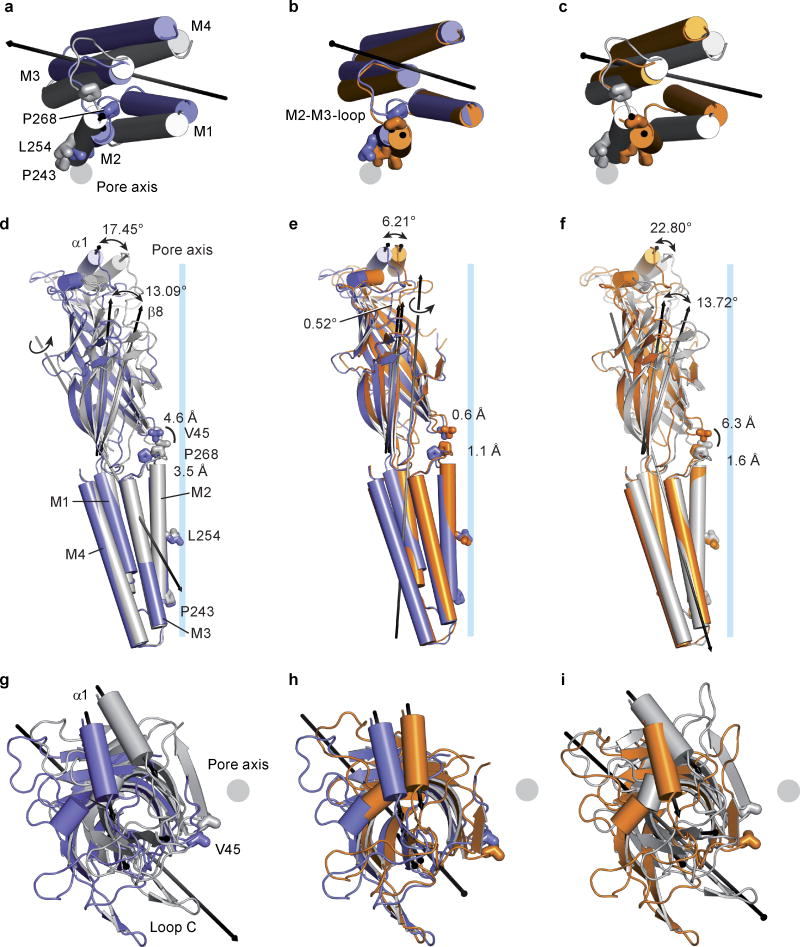
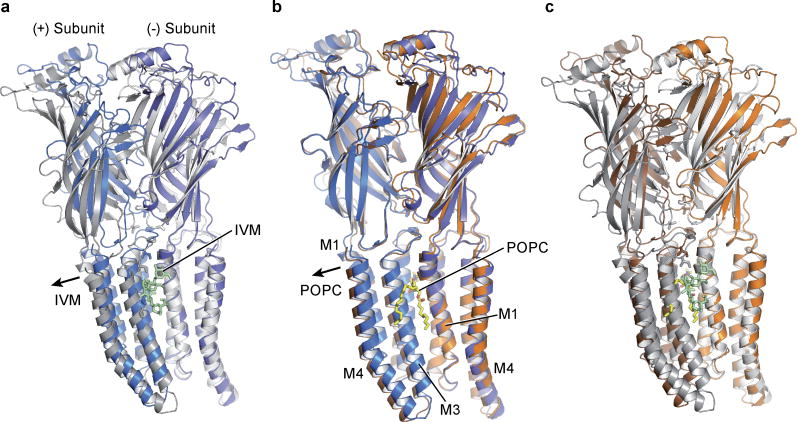
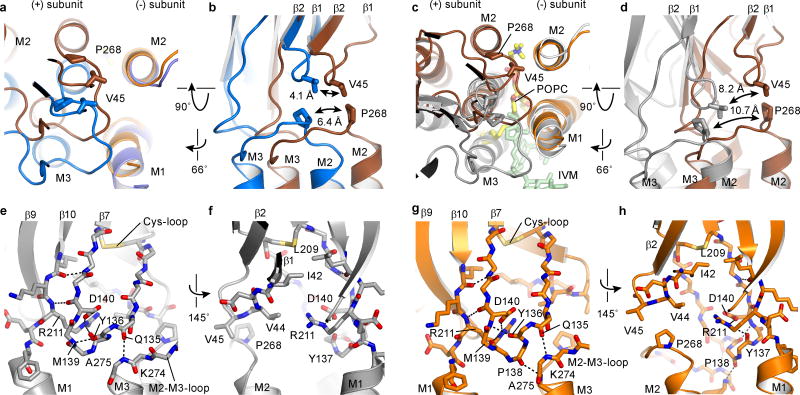
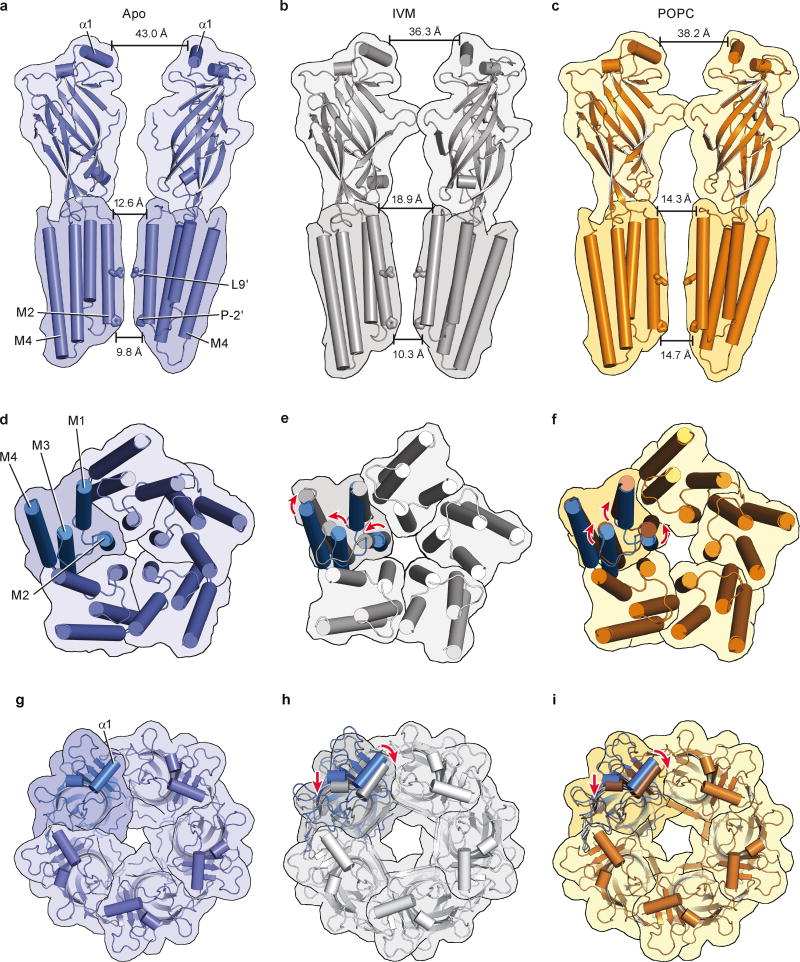
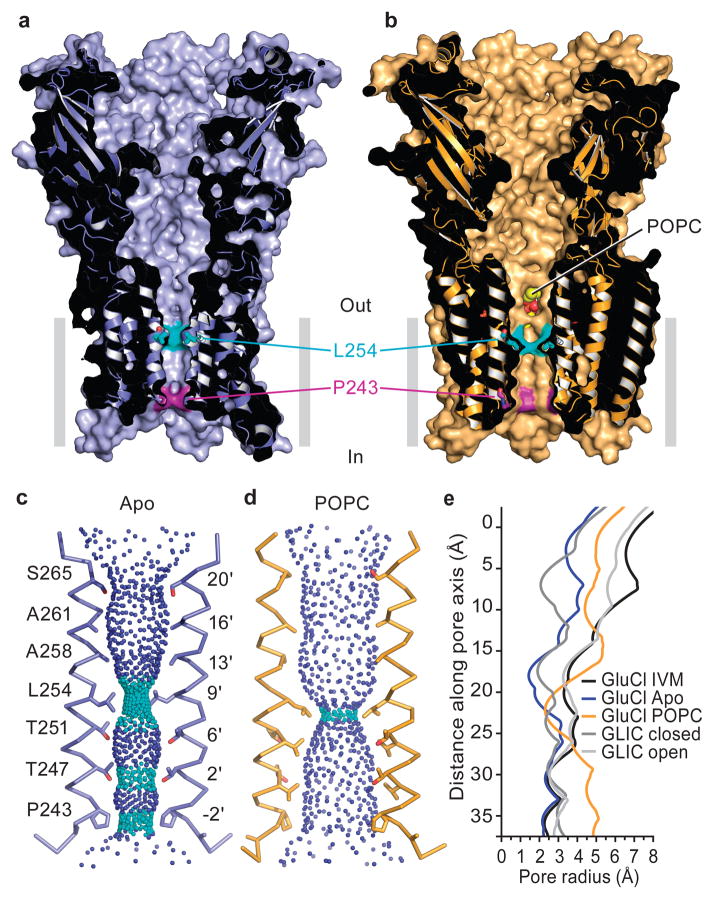
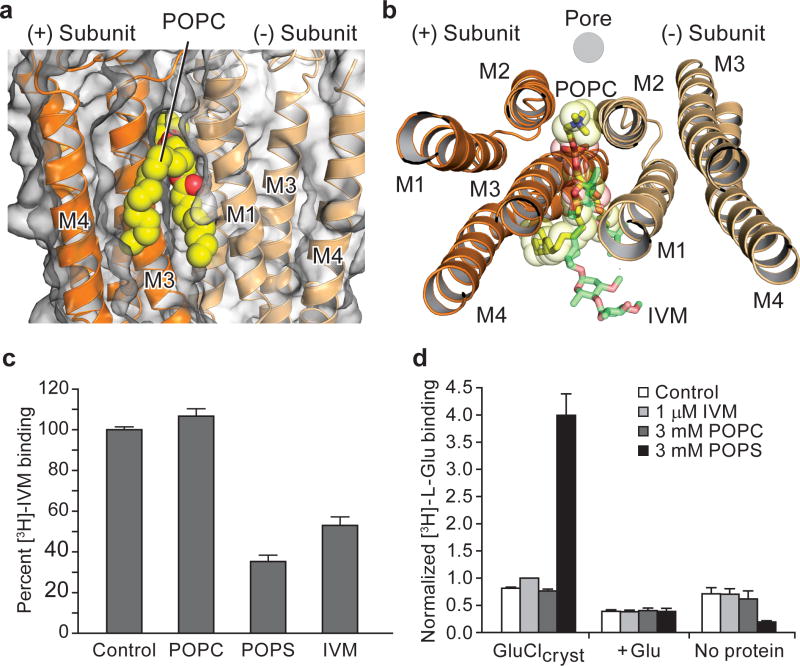
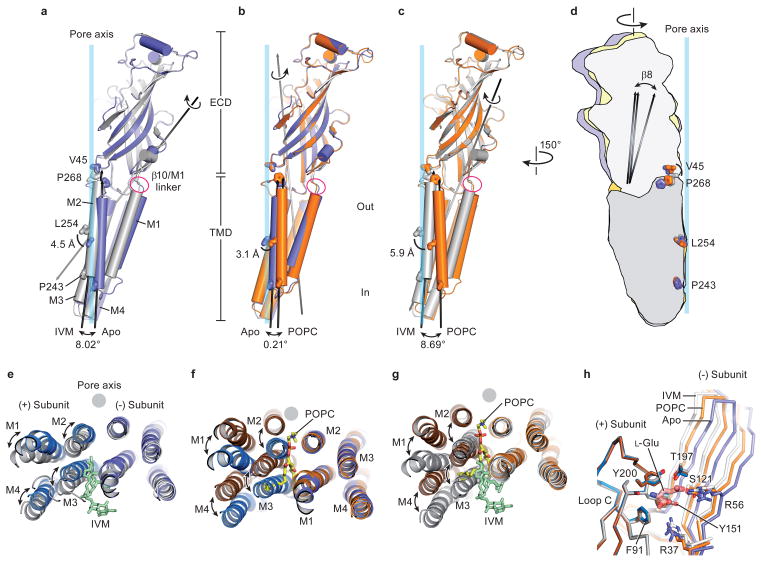
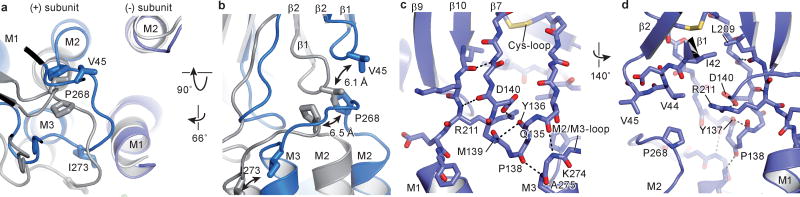
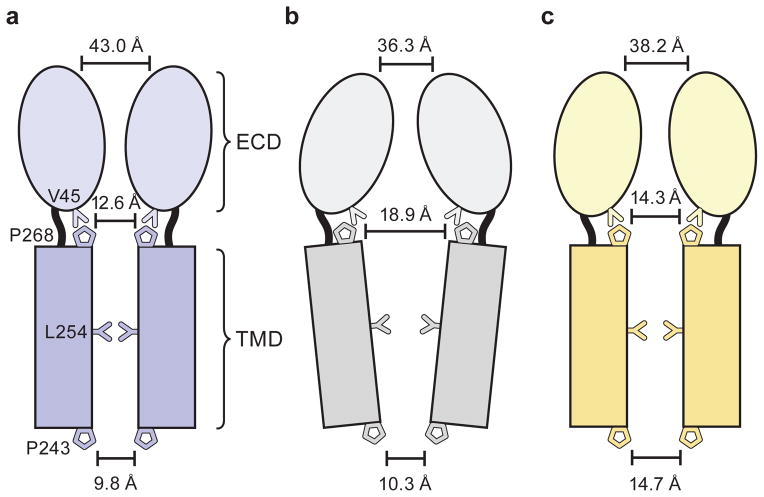
Cys-loop receptors are neurotransmitter-gated ion channels that are essential mediators of fast chemical neurotransmission and are associated with a large number of neurological diseases and disorders, as well as parasitic infections. Members of this ion channel superfamily mediate excitatory or inhibitory neurotransmission depending on their ligand and ion selectivity. Structural information for Cys-loop receptors comes from several sources including electron microscopic studies of the nicotinic acetylcholine receptor, high-resolution X-ray structures of extracellular domains and X-ray structures of bacterial orthologues. In 2011 our group published structures of the Caenorhabditis elegans glutamate-gated chloride channel (GluCl) in complex with the allosteric partial agonist ivermectin, which provided insights into the structure of a possibly open state of a eukaryotic Cys-loop receptor, the basis for anion selectivity and channel block, and the mechanism by which ivermectin and related molecules stabilize the open state and potentiate neurotransmitter binding. However, there remain unanswered questions about the mechanism of channel opening and closing, the location and nature of the shut ion channel gate, the transitions between the closed/resting, open/activated and closed/desensitized states, and the mechanism by which conformational changes are coupled between the extracellular, orthosteric agonist binding domain and the transmembrane, ion channel domain. Here we present two conformationally distinct structures of C. elegans GluCl in the absence of ivermectin. Structural comparisons reveal a quaternary activation mechanism arising from rigid-body movements between the extracellular and transmembrane domains and a mechanism for modulation of the receptor by phospholipids.


Conflict of interest statement

The authors declare no competing financial interests.

Figures

Extended Data Figure 1
Extended Data Figure 1. Packing of two pentameric GluCl-Fab complexes in the asymmetric unit of the C2 unit cell
a, Asymmetric unit of apo GluClcryst-Fab complex seen in the plane of the membrane. The receptor is colored by subunit and the Fab is displayed in gray. b, Complex from (a) rotated by 90°. c, d, The two GluClcryst-Fab complexes with POPC (shown as yellow spheres ) seen parallel (c) and perpendicular (d) to the putative membrane plane.
Extended Data Figure 2
Extended Data Figure 2. Electron density maps for the apo GluCl structure
Shown are electron density maps calculated using 2Fobs - Fcalc coefficients and contoured at 1.5 σ with the α-carbon trace for approximately opposing subunits P and R seen in the plane of the membrane (a), the pore with the gating Leu 254 seen from the extracellular side (b), and the interface between the β1/β2 loop from the extracellular domain and the M2/M3 loop from the transmembrane domain with Val 45 and Pro 268 shown as sticks (c).
Extended Data Figure 3
Extended Data Figure 3. Comparison of apo structures for GluCl, ELIC and GLIC
a, Two approximately opposing subunits (P and R or A and D) are shown for the apo state of GluCl (blue) and ELIC (PDB 2VL0; yellow) and in (d) for the apo state of GluCl (blue) and apo state of GLIC (PDB 4NPQ; green) after superimposing all α-carbon atoms of one subunit. Indicated are distances between α-carbon atoms of Ser 265, Leu 254 and Pro 243 for GluCl, Asn 250, Leu 239 and Pro 228 for ELIC and Thr 244, Ile 233 and Glu 222 for GLIC (from top). b, e, Interactions of the β1/β2 loop and the M2/M3 loop in apo GluCl (blue) and ELIC (yellow) and GLIC (green), respectively. Key residues are shown as sticks with the distances between them indicated. For comparison the ivermectin-bound structure is shown in gray. Panels c and f show the ion channel pore with the proposed gate as seen from the extracellular side with the same color coding for the proteins as before.
Extended Data Figure 4
Extended Data Figure 4. Lipid binding to GluCl
a, View of one GluCl pentamer from the extracellular side together with contours from an ‘omit’ style electron density map computed using Fobs - Fcalc coefficients and phases from coordinates where atoms associated with POPC molecules were omitted from the structure factor computation. The electron density map is shown as blue mesh and is contoured at 1.5 σ. Prominent electron density features are visible between transmembrane domains of adjacent subunits although the strength and continuity of the density varies from subunit to subunit. b, Close up view of one putative electron density feature with POPC drawn as sticks and viewed in the plane of the membrane. c, Radioligand competition binding experiment using GluClcryst, [3H]-ivermectin and cold POPS yields a Ki for POPS of 167 μM (95% confidence interval: 129-216 μM). Shown is a representative binding curve. d, Saturation binding experiment with [3H]-L-glutamate GluClcryst-Nano15 yields a Kd of ~1.12 μM (95% confidence interval: 0.75-1.67 μM) in the presence of 3 mM POPS. e. Radioligand saturation binding using [3H]-ivermectin and the GluClcryst construct. Fitting the data to the Hill equation yields an EC50 of 18.5 nM (95% confidence interval of 11.1-30.7 nM) and an n=0.76 +/- 0.16. For panels c-f, experiments were carried out 3 separate times, with experiments done in triplicate.
Extended Data Figure 5
Extended Data Figure 5. Superpositions of a single subunit
a, Stereo image of the α-carbon trace of the superpositions of the extracellular domain (residues 1-211) of a single subunit for apo (blue), ivermectin- (gray) and POPC-bound (orange) conformations. View parallel to the plane of the membrane with key features indicated. b, Same view of a GluCl subunit in the three different conformations colored as in (a) after superposition of the transmembrane domain (residues 212-342) to display differences in the extracellular domain. c, R.m.s. deviations for the superpositions shown in panels a and b and whole subunits.
Extended Data Figure 6
Extended Data Figure 6. Conformational changes within a subunit
a-c, Views of the transmembrane domain seen from the extracellular side after superposition of the extracellular domain (residues 1-211) (a) for the apo (blue) and the ivermectin-bound (gray) complex, (b) for the apo (blue) and POPC-bound (orange) complexes and (c) for the POPC- (orange) and ivermectin-bound (grey) structures. Panels d-f illustrate relative conformational changes within a subunit when the transmembrane domains are superimposed, using residues 212-342 and the same color coding as in panels a-c. g-i, Views from the extracellular side onto the extracellular domain after superimposing the transmembrane domain (g) of the apo and ivermectin-bound conformation, (h) the apo and POPC-bound structures and (i) the POPC- and ivermectin-bound complexes. The tilt and twist axes between transmembrane domain and extracellular domain are indicated by arrows as marked in the figure panels.
Extended Data Figure 7
Extended Data Figure 7. Ivermectin and POPC alter subunit-subunit contacts in the transmembrane and extracellular domains
Views of two neighboring subunits of GluCl seen parallel to the plane of the membrane after superposition of the transmembrane domain of the (-) subunit. a, Superposition of apo (blue) and ivermectin-bound (gray/white) structures. Ivermectin is shown in pale green as sticks. b, Superposition of the apo (blue) and POPC-bound (brown/orange) complexes with POPC shown as yellow sticks. c, Superposition of POPC- (brown/orange) and ivermectin-bound (gray/white) conformations with POPC and ivermectin as yellow and pale green sticks, respectively.
Extended Data Figure 8
Extended Data Figure 8. Coupling between extracellular and transmembrane domain
a, Superposition of the transmembrane domain of the (-) subunits for the apo (blue) and POPC-bound (brown) states shows the relative movement of the transmembrane domains and the M2/M3 loop of the (+) subunit. b, Same superposition as panel (a), viewed approximately parallel to the membrane, showing the coupled movement of the β1/β2 loop and the M2/M3 loop, with displacement of key residues Val 45, Pro 268 and Ile 273 indicated. Panels c and d show the same views for superposition of the POPC- (brown) and ivermectin-bound (gray) states. e-h, Illustration of key residues forming hydrogen bonds and a salt bridge that connects the transmembrane domains M3 and M1 with the Cys-loop in the extracellular domain in the ivermectin-bound state (gray) (e+f) and POPC-bound state (orange) (g+h). Shown are two views approximately in the plane of the membrane.
Extended Data Figure 9
Extended Data Figure 9. Conformational changes in the GluCl pentamer
a-c, Views of two opposing subunits as seen in the plane of the membrane for apo-closed (a), ivermectin-open (b) and apo-POPC (c) states. Leu 254 and Pro 243 are highlighted as sticks. Indicated are distances between α-carbon atoms of Thr 11, Ser 265 and Pro 243 (from top). d-f, Views of the transmembrane domains of the pentamer seen from the extracellular side along the pore axis for apo-closed (d), ivermectin- (e) and POPC-bound (f) conformations. For comparison the apo-closed state is shown for one subunit with the ivermectin (e) and POPC-bound (f) states. g-i, Top views of the extracellular domains of the GluCl pentamer of the (g) apo, (h) ivermectin- and (i) POPC-bound states. In panels h+i, the apo pentamer was superimposed on the ivermectin- and POPC-bound states using all atoms of the pentamer and one subunit of the apo state (blue) is shown for comparison. We note that despite the α1-helices moving towards the pore axis, the pore diameter in the extracellular domain increases in the ivermectin- and POPC-bound conformations as the lower parts of the extracellular domain move away from the pore center.
Figure 1
Figure 1. Apo and POPC-bound GluCl
a, Sagittal slice along the pore axis of the apo GluCl structure showing the solvent accessible surface and underlying secondary structure. b, Sagittal slice through the pore of GluCl in complex with POPC, similar to panel (a). Atoms of the POPC head group are visible through a fenestration between adjacent subunits. c, Solvent contours of the transmembrane pore of the apo GluCl pore showing the M2 helices of subunits P and R and the side chains of pore-lining residues, numbered according to protein sequence and position in the M2 helix. Small blue spheres define a radius > 2.8 Å and cyan spheres represent a radius of 1.4 – 2.8 Å. d, Contours of the POPC-bound pore, similar to panel (c). e, Illustration of the pore radii as a function of distance along the pore axis for apo, POPC- and ivermectin-bound GluCl, along with the open and closed states of GLIC (PDB codes 3EAM and 4NPQ). Pore radii in panels c–e were calculated using the computer program “HOLE”. IVM, ivermectin.
Figure 2
Figure 2. Phospholipids occupy intersubunit site, compete with ivermectin and potentiate glutamate binding
a, POPC binding site, lodged between M1 and M3 helices of adjacent subunits viewed parallel (a) and perpendicular (b) to the membrane. In (b) we show the location of the pore by a gray circle and the overlap between POPC and ivermectin (shown in ‘sticks’ representation). c, Radioligand competition experiment using GluCl and [3H]-ivermectin (control) and cold POPC, POPS or ivermectin (IVM). d, POPS potentiates glutamate binding as demonstrated by a [3H]-L-glutamate binding experiment in the presence of POPC, POPS or ivermectin. Bars are normalized to the extent of binding in the presence of ivermectin. For panels c–d, experiments were carried out 3 separate times, with experiments done in triplicate. Points are mean values and error bars represent s.e.m.
Figure 3
Figure 3. Conformational changes of extracellular and transmembrane domains
a–c Superpositions of residues 1–211 of the extracellular domains illustrate a screw-axis like conformational change within GluCl subunits. a, Superposition of apo (blue) and IVM (gray) subunits, (b) apo and POPC (orange) subunits and (c) POPC and IVM subunits. Panel (d) illustrates relative conformational changes within subunits when the transmembrane domains are superposed, using residues 212–342, and the same color coding as in panels a–c. e, Superposition of transmembrane domains of the (−) subunits for the apo and ivermectin structures, illustrating relative movements of (+) transmembrane domain. View is from the extracellular side. f, Similar superposition as in panel (e) for the apo and POPC structures and (g) for the POPC and ivermectin structures. h, Neurotransmitter binding site is more open in the apo state in comparison to the POPC and ivermectin states. Superposition of residues in the extracellular domain of the (+) subunit illustrates the relative displacement of residues contributing to the neurotransmitter binding site on the (−) subunit, including Arg 37 and Arg56, in the apo (blue), POPC (orange) and ivermectin (gray) states. The POPC-bound state represents an intermediate position between the apo and ivermectin-bound states.
Figure 4
Figure 4. The M2/M3 loop couples conformational changes between the transmembrane and extracellular domains
a, Superposition of the transmembrane region of the (−) subunits for the apo (blue) and ivermectin (gray) states illustrates the relative movement of the transmembrane domains and the M2/M3 loop of the neighboring (+) subunit. b, Same superposition as in panel (a), viewed approximately parallel to the membrane, showing the coupled movement of the β1/β2 loop and the M2/M3 loop, emphasizing key residues Val 45, Pro 268 and Ile 273. c, d, Illustration of key residues forming hydrogen bonds and a salt bridge that connects the transmembrane and extracellular domains in the apo structure seen from two directions approximately parallel to the membrane. No salt bridge is formed between the pre-M1 linker and the β1/β2 loop (d).
Figure 5
Figure 5. Conformational changes in the pentamer
ac, Schematic illustration of the conformations of the apo-closed (a), ivermectin (b) and POPC-bound (c) states as seen in the plane of the membrane.

References

    1. Thompson AJ, Lester HA, Lummis SC. The structural basis of function in Cys-loop receptors. Q Rev Biophys. 2010;43:449–499. - PubMed
    1. Sine SM. End-plate acetylcholine receptor: structure, mechanism, pharmacology, and disease. Physiol Rev. 2012;92:1189–1234. - PMC - PubMed
    1. Corringer PJ, et al. Structure and pharmacology of pentameric receptor channels: from bacteria to brain. Structure. 2012;20:941–956. - PubMed
    1. Boatin BA, Richards FOJ. Control of onchocerciasis. Adv Parasitol. 2006;61:349–394. - PubMed
    1. Unwin N. Refined structure of the nicotinic acetylcholine receptor. J Mol Biol. 2005;346:967–989. - PubMed

Publication types

MeSH terms