. 2014 Aug 20;6(250):250ra115.
doi: 10.1126/scitranslmed.3009569.

Denervation suppresses gastric tumorigenesis

Affiliations

Denervation suppresses gastric tumorigenesis

Chun-Mei Zhao et al. Sci Transl Med. .

Abstract

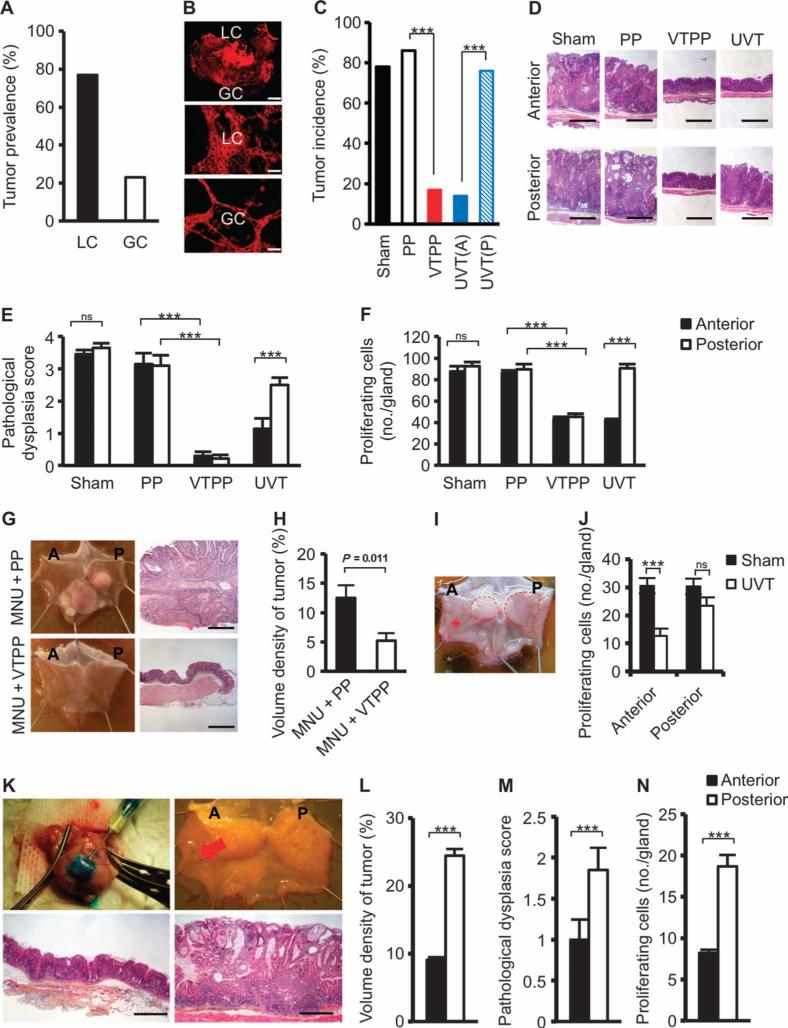
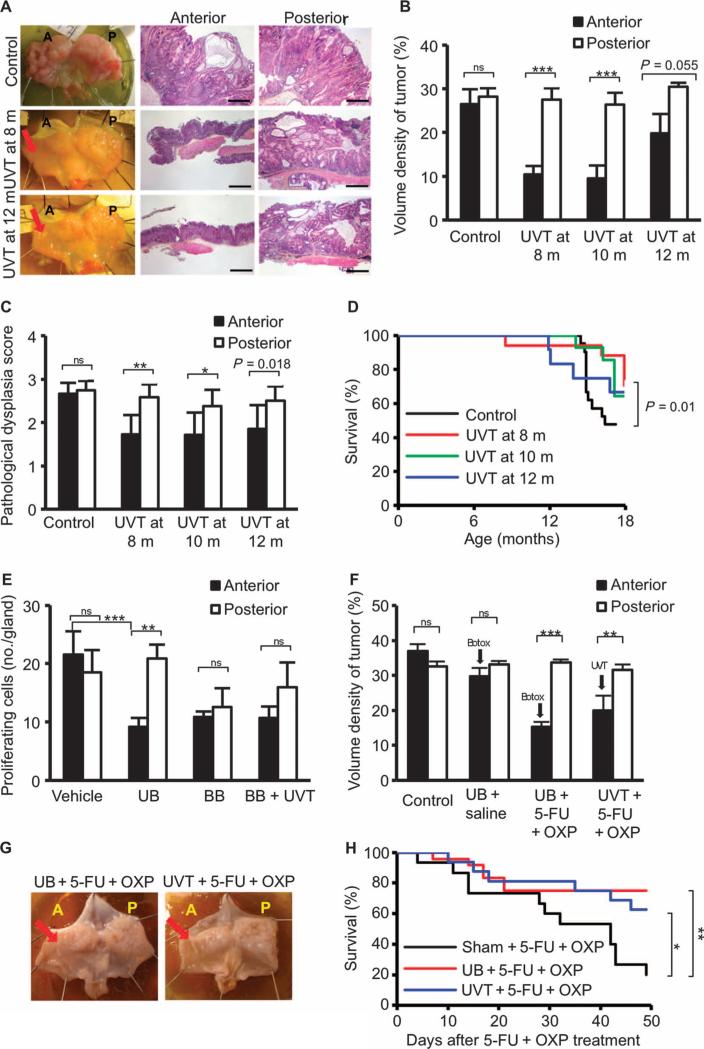
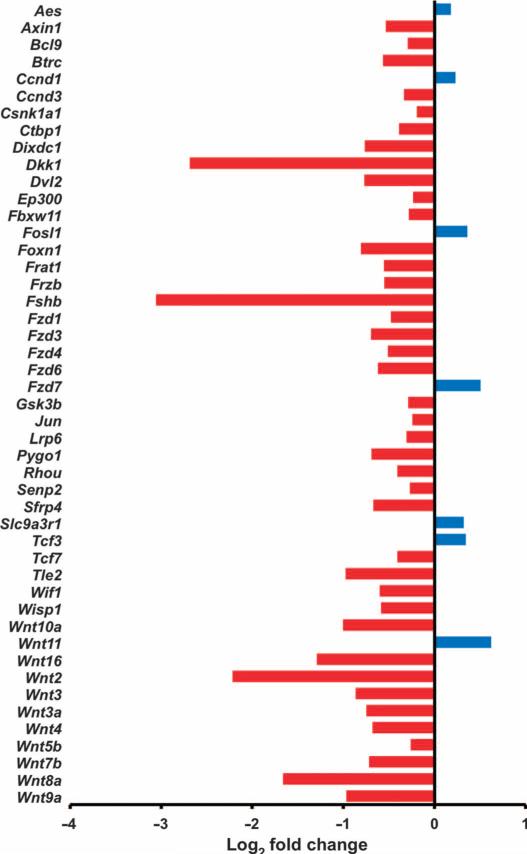
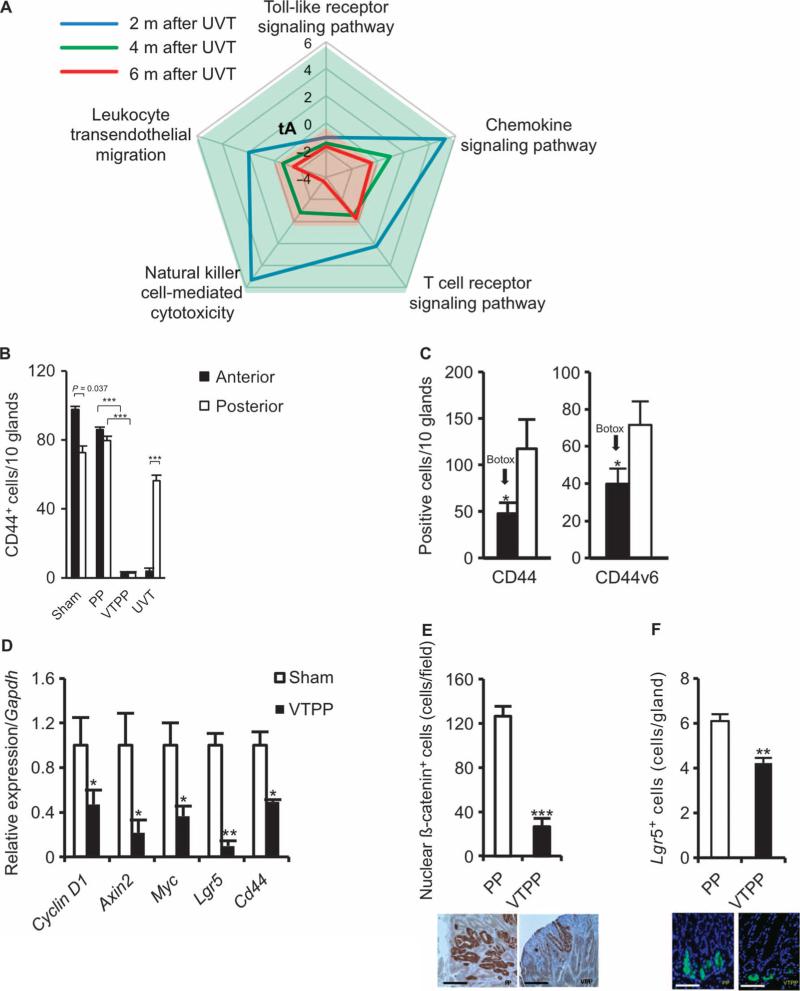
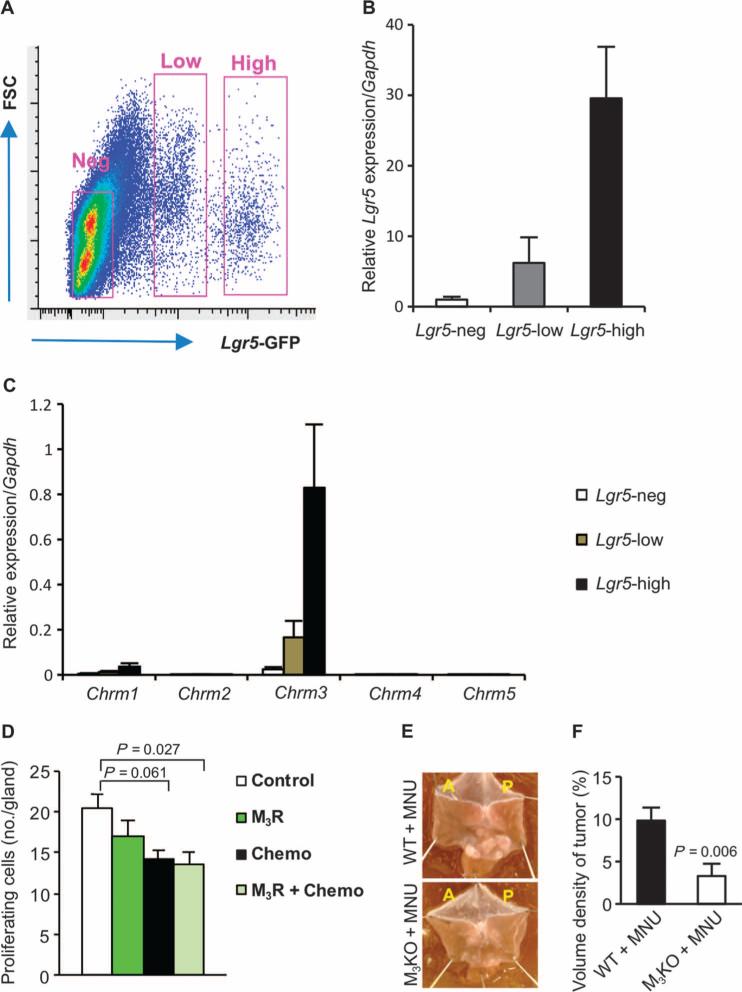
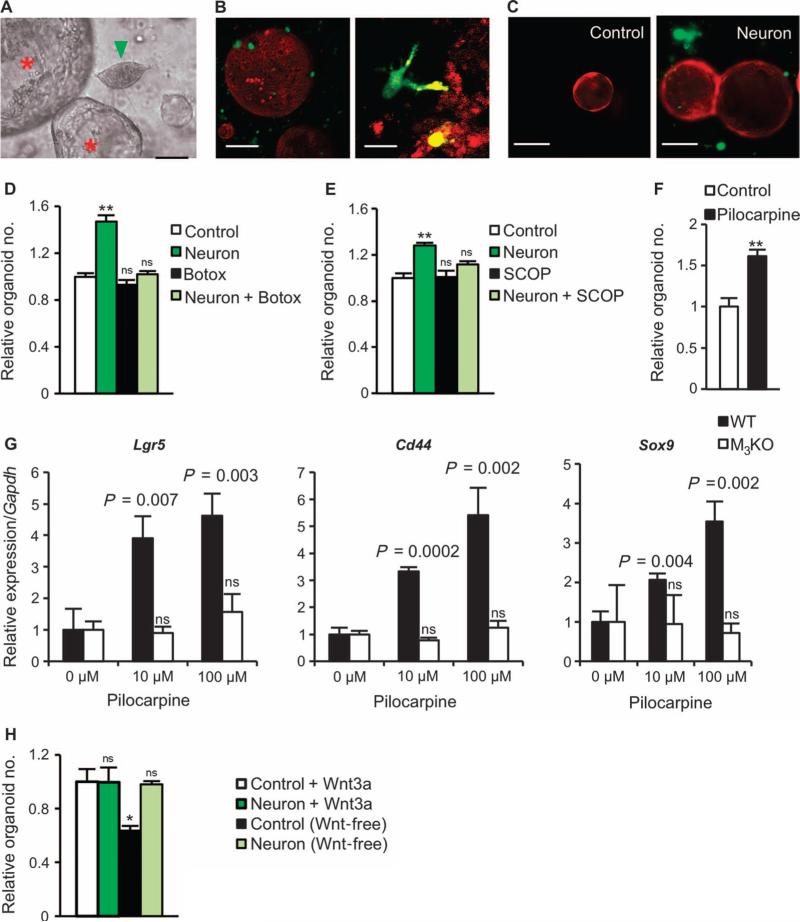
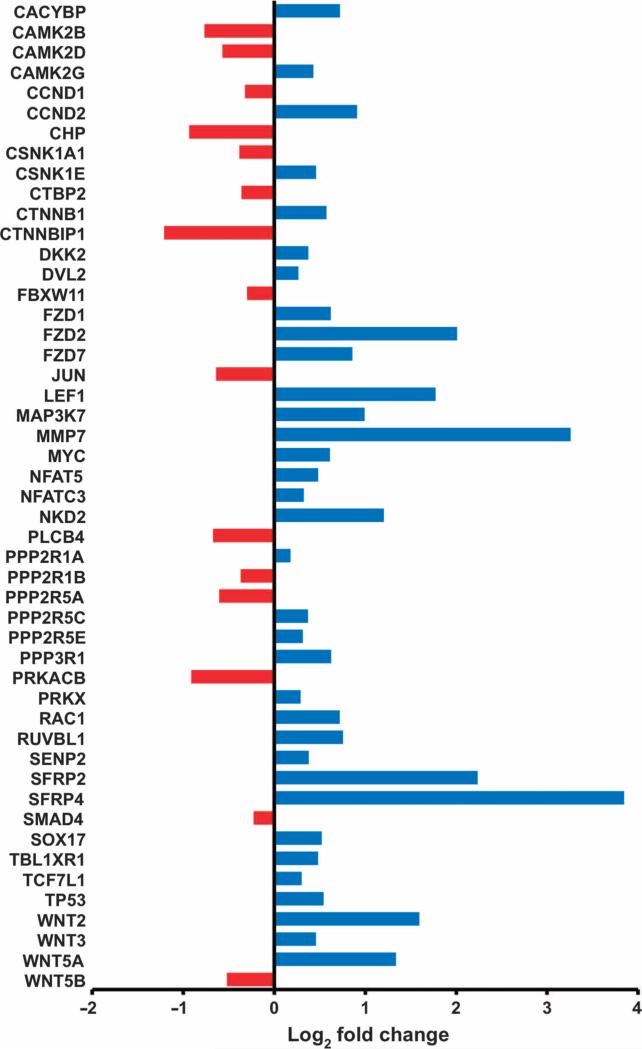
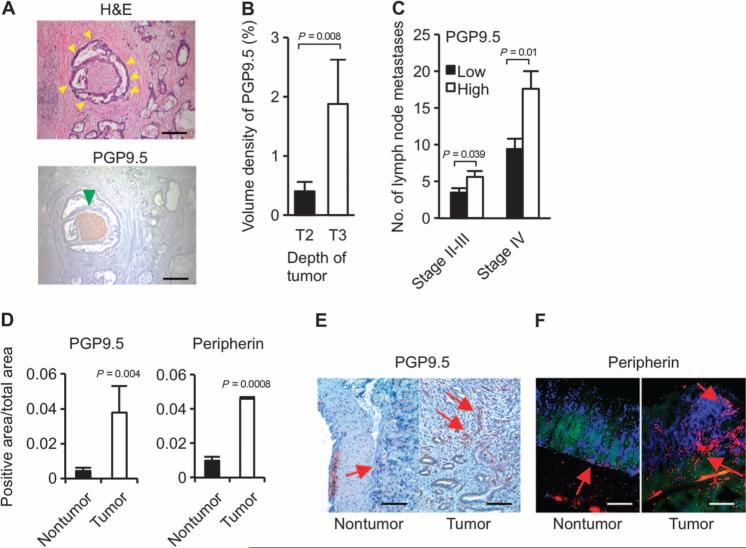
The nervous system plays an important role in the regulation of epithelial homeostasis and has also been postulated to play a role in tumorigenesis. We provide evidence that proper innervation is critical at all stages of gastric tumorigenesis. In three separate mouse models of gastric cancer, surgical or pharmacological denervation of the stomach (bilateral or unilateral truncal vagotomy, or local injection of botulinum toxin type A) markedly reduced tumor incidence and progression, but only in the denervated portion of the stomach. Vagotomy or botulinum toxin type A treatment also enhanced the therapeutic effects of systemic chemotherapy and prolonged survival. Denervation-induced suppression of tumorigenesis was associated with inhibition of Wnt signaling and suppression of stem cell expansion. In gastric organoid cultures, neurons stimulated growth in a Wnt-mediated fashion through cholinergic signaling. Furthermore, pharmacological inhibition or genetic knockout of the muscarinic acetylcholine M3 receptor suppressed gastric tumorigenesis. In gastric cancer patients, tumor stage correlated with neural density and activated Wnt signaling, whereas vagotomy reduced the risk of gastric cancer. Together, our findings suggest that vagal innervation contributes to gastric tumorigenesis via M3 receptor-mediated Wnt signaling in the stem cells, and that denervation might represent a feasible strategy for the control of gastric cancer.


Figures

Fig. 1
Fig. 1. Denervation attenuates tumorigenesis at the preneoplastic stage in mouse models of gastric cancer
(A) Tumor prevalence at the lesser curvature (LC) and greater curvature (GC) of the stomach of INS-GAS mice. (B) Images of carbocyanine dye (DiI)–labeled vagal terminals in an adult mouse stomach. A montage of a low-power image showing the lesser curvature and greater curvature of the gastric wall (top scale bar, 2.0 μm), and higher-power images of lesser curvature (middle) and greater curvature (bottom) show a higher density of vagal innervation in lesser curvature than in greater curvature (89 and 54% of the visual field, estimated by point counting method) (middle and bottom scale bars, 72 μm). (C) Tumor incidence at 12 months of age in INSGAS mice that underwent sham operation (Sham), pyloroplasty alone (PP), bilateral vagotomy with pyloroplasty (VTPP), or anterior unilateral vagotomy (UVT) (A, anterior; P, posterior side of the stomachs) at 6 months of age. ***P = 4.9 × 10⁻⁷ (VTPP versus PP), P = 1.32 × 10⁻⁶ [UVT(A) versus UVT(P)] (Fisher's exact test). (D) Representative microphotographs of histopathological appearance of the anterior and posterior sides of the stomach from INS-GAS mice (at 12 months of age) that underwent sham, PP, VTPP, and UVT at 6 months of age. Scale bars, 100 μm. (E) Pathological score for dysplasia. Means ± SEM. Comparisons between anterior and posterior sides were performed by paired t test within sham (n = 27) and UVT (n = 30), or by Tukey test between PP (n = 25) and VTPP (n = 25). ***P = 5.31 × 10⁻⁵ (UVT), P = 0.0001 or 0.00006 (PP and VTPP, anterior or posterior side, respectively). ns, not significant (P = 0.987). (F) Number of proliferating cells. Means ± SEM. Comparisons between anterior and posterior sides were performed by paired t test within sham (n = 27) and UVT (n = 30), or by Tukey test between PP (n = 25) and VTPP (n = 25). ***P = 5.77 × 10⁻³ (UVT), P = 1.90 × 10⁻⁴ (anterior), and P = 1.49 × 10⁻³ (posterior) between PP and VTPP. ns, not significant (P = 0.229). (G) Representative photographs showing gross appearance of stomachs opened along the greater curvature and corresponding microphotographs of histopathological appearance of the stomachs (antrum) from mice treated with MNU + PP or MNU + VTPP. Scale bars, 100 μm. (H) Volume density of tumor (measured by point counting method). Means ± SEM. Student's t test was used to compare between MNU + PP (n = 11) and MNU + VTPP (n = 9). (I) Representative photograph showing gross appearance of gastric tumors (indicated by dashed line) in a stomach opened along the greater curvature from an Hp-infected H+/K+– ATPase–IL-1β mouse, which underwent UVT in the anterior side (indicated by asterisk).(J)Number of proliferating cells in Hp-infectedH+/K+–ATPase–IL-1β mouse stomachs subjected to UVT in the anterior side. Means ± SEM. ***P = 0.00006 (Student's t test). ns, not significant (P = 0.120) between sham (n = 12) and UVT (n = 12) in the anterior and the posterior sides. (K) Photographs showing the Botox injection procedure (upper left), gross appearance of Botox-injected stomach after 6 months (A, anterior where Botox was injected; P, posterior) (upper right), and representative microphotographs of histopathological appearance of anterior (lower left) and posterior (lower right) stomach (corpus). Red arrow, injection site. Scale bars, 100 μm. (L to N) Volume density of tumor, pathological score for dysplasia, and number of proliferating cells after anterior Botox injection. Means ± SEM (n = 16). ***P = 2.75 × 10⁻¹¹ (L), P = 0.01 (M), or P = 0.001 (N) between the anterior and posterior sides of the stomach (paired t test).
Fig. 2
Fig. 2. Denervation attenuates gastric tumor progression in mice
(A) Gross appearance of mouse stomachs at 18 months of age and representative micro-photographs of the histopatho-logical appearance of the corpus region of the anterior and posterior sides of the stomach from age-matchedINS-GAS mice (Control) and mice that underwent anterior UVT at 8 or 12 months of age. Scale bars, 100 μm. Red arrows, vagotomy side. (B) Volume density of tumor. Means ± SEM. Paired t test between the anterior and the posterior sides of the stomach: P = 0.589 (n = 21, Control), P = 2.56 × 10⁻⁵ (n = 17, UVT at 8months ofage),P=2.17×10⁻⁴ (n = 14, UVT at 10 months), P = 0.055 (n = 12, UVT at 12 months). (C)Pathological score for dysplasia. Means ± SEM. Paired t test between the anterior and the posterior sides of the stomach: P = 0.38 (n = 21, Control), P = 0.002 (n = 17, UVT at 8 months of age), P=0.047(n=14,UVT at 10 months), P=0.018(n=12,UVT at 12 months). (D) Kaplan-Meier curves showing survival of INS-GAS mice that underwentUVTat8(red),10(green), or 12 months of age (blue), or of age-matched INS-GAS mice (Control) (black). P = 0.01 between control and UVT groups at 8 months. (E) Proliferating cells in the anterior and posterior mucosa of the stomach of INS-GAS mice at 2 months after vagotomy and/or Botox injection. Means ± SEM. Paired t test was used to compare the anterior and posterior sides of the stomach. P = 0.291 (n = 6, Vehicle), P = 0.007 [n = 6, unilateral anterior Botox (UB)], P = 0.595 [n = 7, bilateral Botox (BB)], P = 0.326 [n = 7, bilateral Botox plus anterior UVT (BB + UVT)], P = 0.0007 (Vehicle anterior versus UB anterior, Dunnett's test). (F) Volume density of tumor in INS-GAS mice subjected to saline (intraperitoneally) (Control), UB + saline (intraperitoneally), UB + 5-fluorouracil (5-FU) + oxaliplatin (OXP) (intra peritoneally), or UVT + 5-FU + OXP (intraperitoneally). Means ± SEM. Paired t test was used to compare the anterior and posterior sides of the stomach. P = 0.172 (n = 10, Control), P = 0.200 (n = 10, UB + saline), P = 0.0004 (n = 24, UB + 5-FU + OXP), P = 0.006 (n = 16, UVT + 5-FU + OXP). (G) Gross appearance of representative stomachs from INS-GAS mice subjected to 5-FU + OXP with UB or UVT (reduced tumor burden indicated by arrows). (H) Kaplan-Meier curves showing survival of INS-GAS mice that underwent sham operation and 5-FU + OXP treatment (black), UB and 5-FU + OXP (red), or anterior UVT and 5-FU + OXP (blue). *P = 0.041, **P = 0.0069.
Fig. 3
Fig. 3. Denervation leads to inhibition of Wnt signaling in the mouse model of gastric cancer
Gene expression of Wnt signaling pathway (determined by qRT-PCR array analysis) in vagotomized anterior stomach of INS-GAS mice at 12 months of age (6 months UVT). Log2 fold changes of expressed genes in comparison with the posterior side of the same stomach are shown. Red, down-regulation; blue, up-regulation.
Fig. 4
Fig. 4. Denervation alters inflammation-related signaling and suppresses stem cell expansion in mouse models of gastric cancer
(A) Time course of five signaling pathways determined by microarray analysis in the anterior side of the stomach at 2 (blue), 4 (green), and 6 (red) months after anterior UVT compared with the posterior side of the stomach in INSGAS mice. Total net accumulated perturbation (expressed as tA score): −4 to 6. tA score > 0: activation; tA score < 0: inhibition. (B) Numbers of CD44+ cells in the anterior and the posterior sides of the stomach of INS-GAS mice at 6 months after surgery. Means ± SEM. P = 0.037 (n = 27, paired t test) between the anterior and the posterior sides in sham operation (Sham), P = 1.00 × 10⁻⁶ or P = 6.00 × 10⁻⁶ (n = 25, Dunnett's test) between PP and VTPP (anterior and posterior sides, respectively), and P = 1.74 × 10⁻³ (n = 30, paired t test) between the anterior and the posterior sides within anterior UVT. (C) Numbers of CD44-immunoreactive cells (CD44) and CD44v6-immunoreactive cells (CD44v6) in the anterior and the posterior sides of the stomach of INSGAS mice at 6 months after Botox injection. Means ± SEM. P = 0.034 and P = 0.021, respectively (n = 16, paired t test) between the anterior and the posterior sides of the stomach. (D) Relative gene expression of Cyclin D1, Axin2, Myc, Lgr5, and Cd44 in the gastric tumors of sham-operated or VTPP-treated mice 36 weeks after MNU treatment (n = 4 per group). Means ± SEM. P = 0.04 (Cyclin D1), 0.04 (Axin2), 0.03 (Myc), 0.001 (Lgr5), and 0.01 (Cd44) (Student's t test). (E) Number of cells showing nuclear β-catenin accumulation in the gastric tumors of PP- or VTPP-treated mice 36 weeks after MNU treatment (n = 4 per group). Means ± SEM. P = 7.00 × 10⁻⁶ (Student's t test). Representative immunohistochemical microphotographs are shown below. Scale bars, 40 μm. (F) Number of Lgr5+ cells in the stomachs of PP- or VTPP-treated mice 6 weeks after MNU treatment (n = 5 per group). Means ± SEM. P = 4.00 × 10⁻⁶ (Student's t test). Representative Lgr5-GFP+ microphotographs are shown below. Scale bars, 20 μm.
Fig. 5
Fig. 5. M3 receptor signaling in gastric stem cells regulates tumorigenesis in mouse models of gastric cancer
(A) Representative fluorescence-activated cell sorting gating showing forward scatter (FSC) and Lgr5-GFP expression. (B and C) Relative gene expression of Lgr5 and muscarinic receptors (Chrm1 to Chrm5) in sorted Lgr5-negative, Lgr5-low, and Lgr5-high populations. Means ± SEM (n = 4). (D) Number of proliferating cells in the tumors of INS-GAS mice treated with saline (Control, n = 19), M3 receptor antagonist darifenacin (M3R, n = 15), 5-FU + oxaliplatin (Chemo, n = 12), or combination of 5-FU + oxaliplatin + darifenacin (M3R + Chemo, n = 8), respectively. Means ± SEM. P values were calculated by Dunnett's test. (E) Representative photographs showing gross appearance of stomachs opened along the greater curvature from wild-type (WT) or M3 receptor knockout mice (M3KO) treated with MNU. (F) Volume density of tumor in the stomachs of MNU-treated WT (n = 13) versus MNU-treated M3KO mice (n = 7). Means ± SEM (Student's t test).
Fig. 6
Fig. 6. Neurons activate Wnt signaling in gastric stem cells through the M3 receptor
(A to C) Representative microphotographs showing gastric organoids along with neurite outgrowth. (A) Guinea pig enteric neuron (green arrowhead) with gastric organoids (red asterisks). Scale bar, 5 μm. (B) Three-dimensional images (low and high magnifications) obtained by two-photon microscopy of gastric organoids (red) derived from an ACTB-tdTomato mouse and neurons (green) derived from a UBC-GFP mouse. Scale bars, 20 μm (left) and 5 μm (right). In (C), fluorescent images show gastric organoids (red) alone (left, Control) or cocultured with neurons (green) (right, Neuron) at day 4. Scale bars, 10 μm. (D) Relative number of organoids after 72 hours in control, neuron coculture, control plus Botox, or neuron coculture plus Botox. Means ± SEM. n = 4 per group. **P = 0.002 (Student's t test). ns, not significant compared to control. (E) Relative number of organoids after 72 hours in control or neuron coculture with or without scopolamine (SCOP) (1 μg/ml). Means ± SEM. n = 4 per group. **P = 0.003 (Student's t test). ns, not significant compared to control. (F) Relative number of organoids at day 10 with or without 100 μM pilocarpine. Means ± SEM. n = 4 per group. **P = 0.006 (Student's t test) between control and pilocarpine. (G) Relative mRNA expression for Lgr5, Cd44, and Sox9 in relation to Gapdh on day 7 with or without 10 or 100 μM pilocarpine in gastric organoids isolated from WT or M3KO mice. Means ± SEM. Student's t test between 0 μM and 10 or 100 μM pilocarpine. n = 4 per group. (H) Relative number of organoids at day 10 with or without neurons and/or Wnt3a. Means ± SEM. n = 4 per group. ns, not significant. *P = 0.030 compared to Control + Wnt3a (Student's t test).
Fig. 7
Fig. 7. Gastric cancer patients exhibit a dysregulation of Wnt signaling
Gene expression of Wnt signaling pathway (microarray analysis) in human gastric cancer tissue. The graph shows log2 fold changes of expressed genes in comparison with the adjacent noncancerous tissue of the same stomach. Red, down-regulation; blue, up-regulation.
Fig. 8
Fig. 8. PGP9.5 and peripherin may represent neural markers for gastric cancer progression
(A) Representative microphotographs showing human gastric cancer [indicated by yellow arrowheads, hematoxylin and eosin (H&E) staining] and PGP9.5-labeled nerve (green arrowhead). Scale bars, 50 μm. (B) Volume density of PGP9.5-labeled nerves in different levels of depth of tumor invasion [T2 (tumor invading muscularis propria) versus T3 (tumor penetrating subserosal connective tissue without invasion of visceral peritoneum or adjacent structures)] in the stage II and III gastric cancer patients. Means ± SEM (n = 120). P = 0.008 (Student's t test). (C) Number of lymph node metastases in patients with stage II and III or stage IV gastric cancer that has low or high expression of PGP9.5. Means ± SEM (n = 120). P values were calculated by Student's t test. (D) PGP9.5- and peripherin-immunoreactive nerve densities in gastric mucosa of control mice (nontumor) and MNU-treated mice (tumor). PGP9.5 is a ubiquitin-protein hydrolase that is expressed in the neuronal cell bodies and axons in the central and peripheral nervous system. Peripherin is a type III intermediate filament protein that is expressed in peripheral and some central nervous system neurons. Both can be used as neuronal markers in the gut. Means ± SEM (n = 6 per group). P values were calculated by Student's t test. (E and F) Representative immunohistochemical microphotographs showing PGP9.5 and peripherin (indicated by red arrows) in the nontumor and tumor areas of the mouse stomachs. Scale bars, 20 μm (E) and 40 μm (F).

Comment in

References

    1. Katayama Y, Battista M, Kao WM, Hidalgo A, Peired AJ, Thomas SA, Frenette PS. Signals from the sympathetic nervous system regulate hematopoietic stem cell egress from bone marrow. Cell. 2006;124:407–421. - PubMed
    1. Lundgren O, Jodal M, Jansson M, Ryberg AT, Svensson L. Intestinal epithelial stem/ progenitor cells are controlled by mucosal afferent nerves. PLOS One. 2011;6:e16295. - PMC - PubMed
    1. Mattingly RR, Sorisky A, Brann MR, Macara IG. Muscarinic receptors transform NIH 3T3 cells through a Ras-dependent signalling pathway inhibited by the Ras-GTPase-activating protein SH3 domain. Mol. Cell. Biol. 1994;14:7943–7952. - PMC - PubMed
    1. Ayala GE, Dai H, Powell M, Li R, Ding Y, Wheeler TM, Shine D, Kadmon D, Thompson T, Miles BJ, Ittmann MM, Rowley D. Cancer-related axonogenesis and neurogenesis in prostate cancer. Clin. Cancer Res. 2008;14:7593–7603. - PubMed
    1. Shah N, Khurana S, Cheng K, Raufman JP. Muscarinic receptors and ligands in cancer. Am. J. Physiol. Cell Physiol. 2009;296:C221–C232. - PMC - PubMed

Publication types

MeSH terms