Quantitative analysis and modeling of katanin function in flagellar length control
- PMID: 25143397
- PMCID: PMC4230626
- DOI: 10.1091/mbc.E14-06-1116
Quantitative analysis and modeling of katanin function in flagellar length control
Abstract
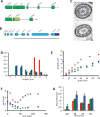
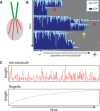
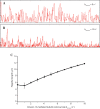
Flagellar length control in Chlamydomonas reinhardtii provides a simple model system in which to investigate the general question of how cells regulate organelle size. Previous work demonstrated that Chlamydomonas cytoplasm contains a pool of flagellar precursor proteins sufficient to assemble a half-length flagellum and that assembly of full-length flagella requires synthesis of additional precursors to augment the preexisting pool. The regulatory systems that control the synthesis and regeneration of this pool are not known, although transcriptional regulation clearly plays a role. We used quantitative analysis of length distributions to identify candidate genes controlling pool regeneration and found that a mutation in the p80 regulatory subunit of katanin, encoded by the PF15 gene in Chlamydomonas, alters flagellar length by changing the kinetics of precursor pool utilization. This finding suggests a model in which flagella compete with cytoplasmic microtubules for a fixed pool of tubulin, with katanin-mediated severing allowing easier access to this pool during flagellar assembly. We tested this model using a stochastic simulation that confirms that cytoplasmic microtubules can compete with flagella for a limited tubulin pool, showing that alteration of cytoplasmic microtubule severing could be sufficient to explain the effect of the pf15 mutations on flagellar length.
© 2014 Kannegaard et al. This article is distributed by The American Society for Cell Biology under license from the author(s). Two months after publication it is available to the public under an Attribution–Noncommercial–Share Alike 3.0 Unported Creative Commons License (http://creativecommons.org/licenses/by-nc-sa/3.0).
Figures


Similar articles
-
PF15p is the chlamydomonas homologue of the Katanin p80 subunit and is required for assembly of flagellar central microtubules.Eukaryot Cell. 2004 Aug;3(4):870-9. doi: 10.1128/EC.3.4.870-879.2004. Eukaryot Cell. 2004. PMID: 15302820 Free PMC article.
-
Katanin localization requires triplet microtubules in Chlamydomonas reinhardtii.PLoS One. 2013;8(1):e53940. doi: 10.1371/journal.pone.0053940. Epub 2013 Jan 8. PLoS One. 2013. PMID: 23320108 Free PMC article.
-
PF19 encodes the p60 catalytic subunit of katanin and is required for assembly of the flagellar central apparatus in Chlamydomonas.J Cell Sci. 2012 Jul 15;125(Pt 14):3357-66. doi: 10.1242/jcs.096941. Epub 2012 Mar 30. J Cell Sci. 2012. PMID: 22467860 Free PMC article.
-
Elucidation of basal body and centriole functions in Chlamydomonas reinhardtii.Traffic. 2003 Jul;4(7):443-51. doi: 10.1034/j.1600-0854.2003.00104.x. Traffic. 2003. PMID: 12795689 Review.
-
Regulation of flagellar length in Chlamydomonas.Semin Cell Dev Biol. 2008 Dec;19(6):494-501. doi: 10.1016/j.semcdb.2008.07.005. Epub 2008 Jul 25. Semin Cell Dev Biol. 2008. PMID: 18692148 Free PMC article. Review.
Cited by
-
Biosynthesis of Linear Protein Nanoarrays Using the Flagellar Axoneme.ACS Synth Biol. 2022 Apr 15;11(4):1454-1465. doi: 10.1021/acssynbio.1c00439. Epub 2022 Mar 10. ACS Synth Biol. 2022. PMID: 35271249 Free PMC article.
-
Chlamydomonas as a model system to study cilia and flagella using genetics, biochemistry, and microscopy.Front Cell Dev Biol. 2024 May 30;12:1412641. doi: 10.3389/fcell.2024.1412641. eCollection 2024. Front Cell Dev Biol. 2024. PMID: 38872931 Free PMC article. Review.
-
Microtubule severing by katanin p60 AAA+ ATPase requires the C-terminal acidic tails of both α- and β-tubulins and basic amino acid residues in the AAA+ ring pore.J Biol Chem. 2015 May 1;290(18):11762-70. doi: 10.1074/jbc.M114.614768. Epub 2015 Mar 24. J Biol Chem. 2015. PMID: 25805498 Free PMC article.
-
Analysis of biological noise in the flagellar length control system.iScience. 2021 Mar 23;24(4):102354. doi: 10.1016/j.isci.2021.102354. eCollection 2021 Apr 23. iScience. 2021. PMID: 33898946 Free PMC article.
-
The short flagella 1 (SHF1) gene in Chlamydomonas encodes a Crescerin TOG-domain protein required for late stages of flagellar growth.Mol Biol Cell. 2022 Feb 1;33(2):ar12. doi: 10.1091/mbc.E21-09-0472. Epub 2021 Nov 24. Mol Biol Cell. 2022. PMID: 34818077 Free PMC article.
References
-
- Blaineau C, Tessier M, Dubessay P, Tasse L, Crobu L, Pages M, Bastien P. A novel microtubule-depolymerizing kinesin involved in length control of a eukaryotic flagellum. Curr Biol. 2007;17:778–782. - PubMed
Publication types
MeSH terms
Substances
Grants and funding
LinkOut - more resources
Full Text Sources
Other Literature Sources

