. 2014 Nov 5;25(22):3515-27.
doi: 10.1091/mbc.E13-01-0005. Epub 2014 Aug 20.

Synergies between Aip1p and capping protein subunits (Acp1p and Acp2p) in clathrin-mediated endocytosis and cell polarization in fission yeast

Affiliations

Synergies between Aip1p and capping protein subunits (Acp1p and Acp2p) in clathrin-mediated endocytosis and cell polarization in fission yeast

Julien Berro et al. Mol Biol Cell. .

Abstract

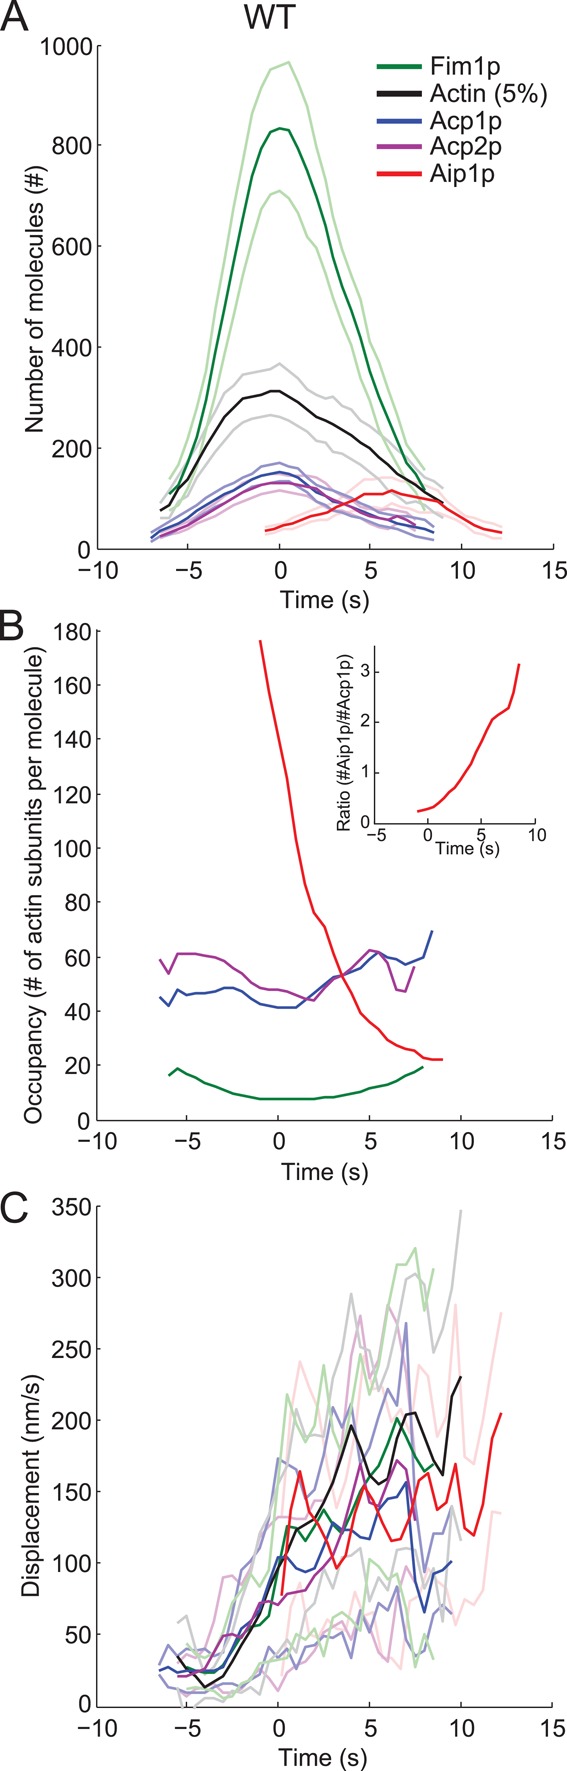
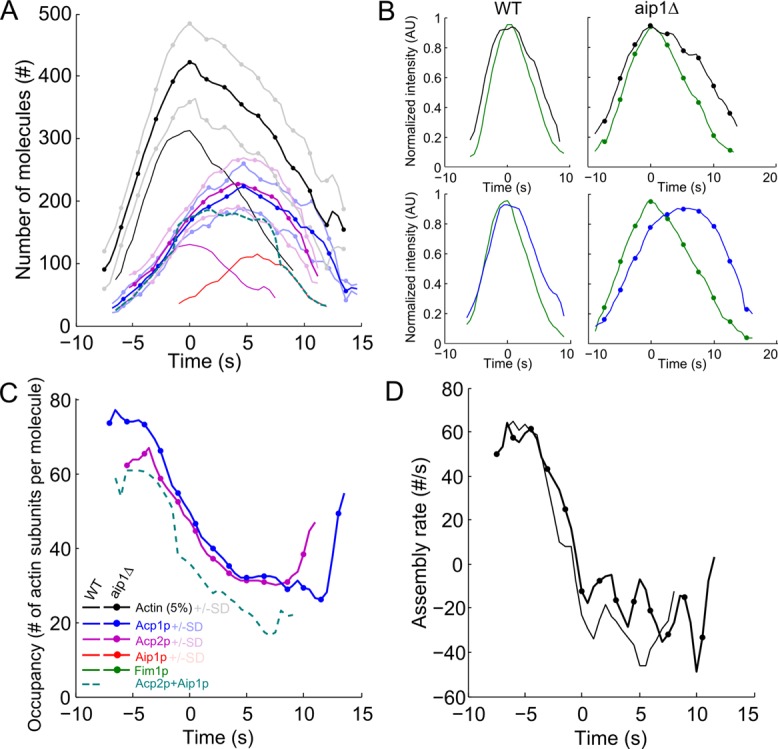
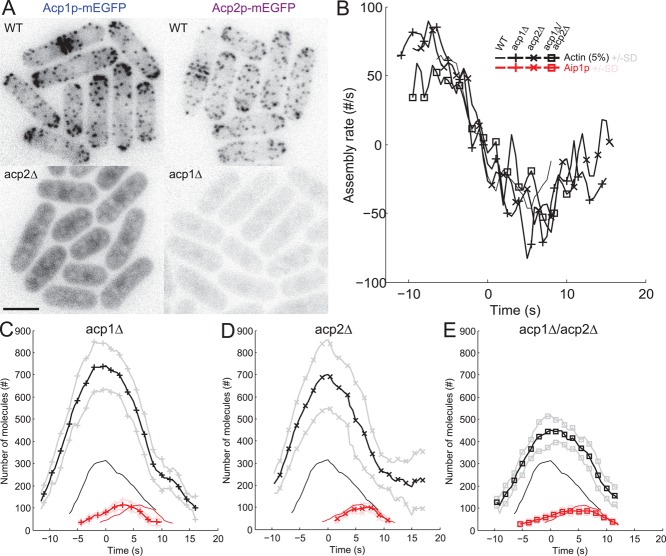
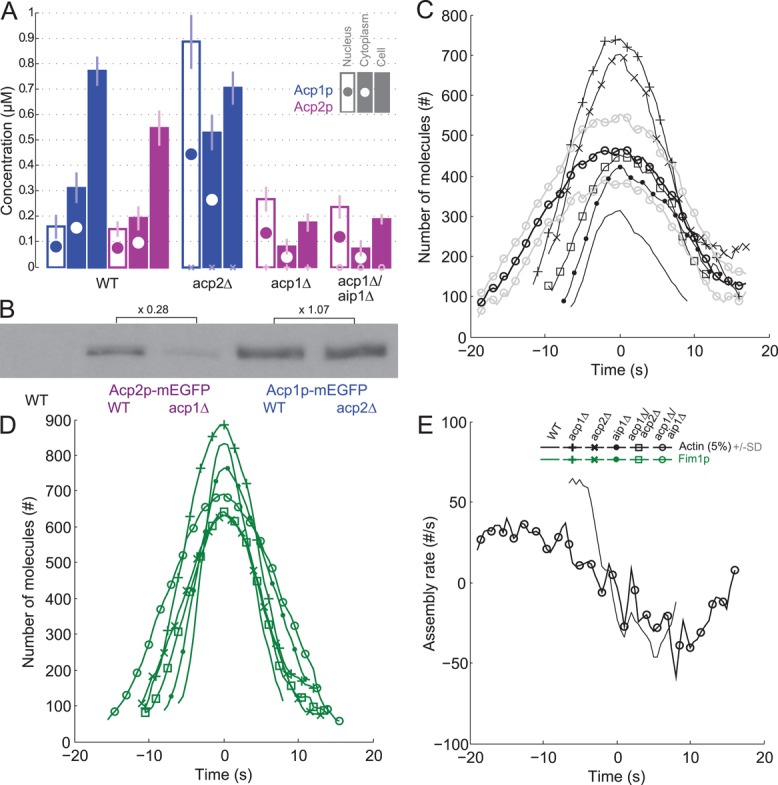
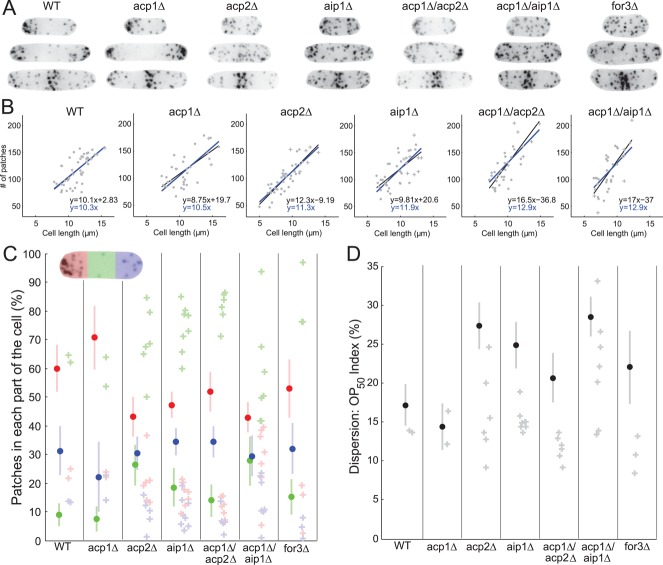
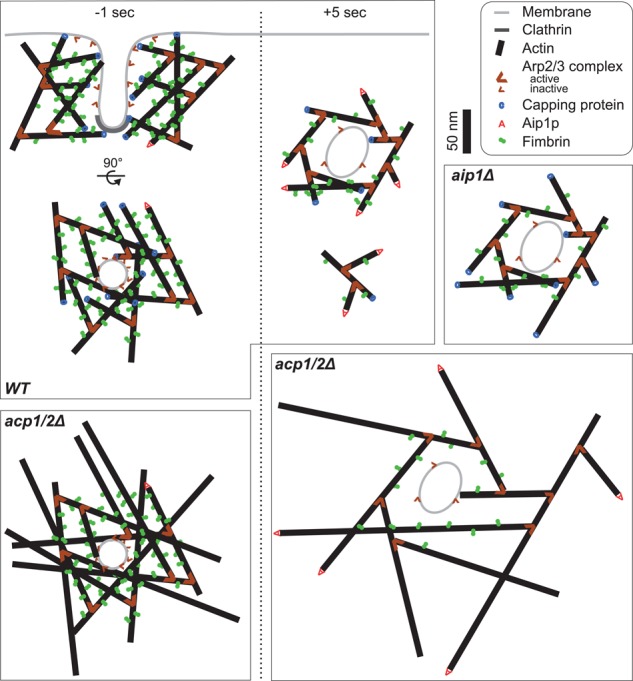
Aip1p cooperates with actin-depolymerizing factor (ADF)/cofilin to disassemble actin filaments in vitro and in vivo, and is proposed to cap actin filament barbed ends. We address the synergies between Aip1p and the capping protein heterodimer Acp1p/Acp2p during clathrin-mediated endocytosis in fission yeast. Using quantitative microscopy and new methods we have developed for data alignment and analysis, we show that heterodimeric capping protein can replace Aip1p, but Aip1p cannot replace capping protein in endocytic patches. Our quantitative analysis reveals that the actin meshwork is organized radially and is compacted by the cross-linker fimbrin before the endocytic vesicle is released from the plasma membrane. Capping protein and Aip1p help maintain the high density of actin filaments in meshwork by keeping actin filaments close enough for cross-linking. Our experiments also reveal new cellular functions for Acp1p and Acp2p independent of their capping activity. We identified two independent pathways that control polarization of endocytic sites, one depending on acp2(+) and aip1(+) during interphase and the other independent of acp1(+), acp2(+), and aip1(+) during mitosis.


Figures

FIGURE 1:
FIGURE 1:
Time course of protein appearance, disappearance, and movements in actin patches. Time zero corresponds to the peak of actin and the onset of movements. Dark lines are the average values over time; light lines are ± 1 SD of the means. Color code: green, Fim1p-mEGFP; black, mEGFP-actin; blue, capping protein subunit Acp1p-mEGFP; purple, capping protein subunit Acp2p-mEGFP; and red, mEGFP-Aip1p. Data sets were aligned according to the two-color data in Figures S1 and S2. (A) Numbers of molecules over time. Fim1p, Acp1p, Acp2p, and Aip1p were tagged in the genome, so the numbers are the total numbers of each protein in patches. mEGFP-actin was expressed from the leu1 locus under the control of the 41xnmt promoter and represents 5% of the total actin. (B) Occupancy of endocytic proteins on actin filaments. The occupancy was calculated as the ratio between the numbers of actin subunits (number of mEGFP-Act1p/5%) and Fim1p-mEGFP, Acp1p-mEGFP, Acp2p-mEGFP, or mEGFP-Aip1p measured in A. (B) Inset, ratio between the numbers of mEGFP-Aip1p and Acp1p-mEGFP. (C) Average displacements over 1-s intervals of patches marked by each tagged protein.
FIGURE 2:
FIGURE 2:
Synergy between capping protein and Aip1p in actin patches revealed by deletions of each protein. Symbols and lines: dark lines are average values; light lines are ± 1 SD of the mean values; plain lines, wild-type cells (same as Figure 1A); (●) aip1∆ cells. Color code: black, mEGFP-actin; blue, capping protein subunit Acp1p-mEGFP; purple, capping protein subunit Acp2p-mEGFP; red, mEGFP-Aip1p; green, fimbrin Fim1p-mEGFP; and teal, sum of Acp2p and Aip1p. Time zero is the peak of actin. Data sets were aligned in time using Fim1p-mCherry according to the two-color data in Figures S1 and S2. (A) Numbers of tagged molecules over time in endocytic patches of wild-type and aip1∆ strains. (B) Normalized intensities over time of actin (first row) and capping protein subunit Acp1p (second row) relative to fimbrin in (first column) wild-type cells and (second column) aip1Δ deletion mutant (see Figures S2 and S5 for delay measurements and statistical analysis). (C) Fimbrin occupancy of filaments in wild-type cells over time (ratio of mEGFP-Act1p/5% to Acp1p-mEGFP or Acp2p-mEGFP molecules measured in A). The teal dashed line is the ratio between the number of actin subunits and the sum of Acp2p and Aip1p molecules in wild-type cells. (D) Net actin assembly rates in patches of (plain line) wild-type and (●) aip1∆ strains.
FIGURE 3:
FIGURE 3:
Effects of deletions of acp1+ and/or acp2+ on the accumulation, disappearance, and movements of actin, fimbrin, and Aip1p in endocytic patches. (A) Localization of capping protein subunits in the absence of the other subunit. Negative-contrast fluorescence micrographs of representative cells expressing Acp1p-mEGFP in wild-type and acp2Δ cells (left column) or Acp2p-mEGFP in wild-type and acp1Δ cells (right column). Scale bar: 5 μm. (B–E) Time zero corresponds to the peak of actin. Color code: black, mEGFP-actin; red, mEGFP-Aip1p. Symbols and lines: dark lines are average values; light lines are ± 1 SD of the mean values; plain lines, wild-type cells (same as Figure 1A); +, acp1∆ cells; x, acp2∆ cells; and ◻, double mutant acp1∆/acp2∆ cells. Data sets were aligned according to the two-color data in Figures S1 and S2. (B) Actin net assembly rates in patches of wild-type, acp1∆, acp2∆, and acp1∆/acp2∆ cells. (C–E) Comparisons of the numbers of molecules over time in endocytic patches of wild-type cells with (C) acp1∆ cells, (D) acp2∆ cells, and (E) double mutant acp1∆/acp2∆ cells.
FIGURE 4:
FIGURE 4:
Evidence for functional differences between capping protein subunits. (A) Nuclear, cytoplasmic, and total cell concentrations of Acp1p-mEGFP and Acp2p-mEGFP in wild-type cells and single mutants acp1Δ and acp2Δ, and double mutants acp1Δ/aip1Δ. Color code: blue, Acp1p-mEGFP; purple, Acp2p-mEGFP. Empty bars with a filled circle, nuclear concentration; filled bar with an empty circle, cytoplasmic concentration; filled bar, total cell concentration. (B) Western blots with antibodies against GFP for Acp2p-mEGFP in wild-type and acp1Δ cells, and Acp1p-mEGFP in wild-type and acp2Δ cells. Intensities of the bands are proportional to total cell concentrations for comparison with the filled bars in B. Numbers represent the relative intensities of bands in corresponding mutants. (C–E) Time courses with time 0 s at the peak of actin assembly. Symbols and lines: dark lines are average values; light lines are ± 1 SD of the mean values; plain lines, wild-type cells (same as Figure 1A); +, acp1∆ cells; x, acp2∆ cells; ●, aip1∆ cells; ◻, double mutant acp1∆/acp2∆ cells; ○, double mutant acp1∆/aip1∆ cells. Color code: black, mEGFP-actin; and green, fimbrin Fim1p-mEGFP. Time zero is the peak of actin. (C) Numbers of mEGFP-actin molecules in all mutants over time. (D) Number of molecules of Fim1p-mEGFP in all mutants over time. (E) Net actin assembly rates in wild-type and acp1Δ/aip1Δ strains over time.
FIGURE 5:
FIGURE 5:
Insights regarding the structure of endocytic patches by analysis of their motions in wild-type and mutant cells. (A) Samples of tracks of patches marked with Fim1p-mEGFP in wild-type, single-deletion mutant strains acp1∆, acp2∆, and aip1∆, and double-deletion mutant strains acp1∆/acp2∆ and acp1∆/aip1∆. The points are positions at 1-s intervals connected by lines, both color-coded in time from blue (appearance of Fim1p-mEGFP) to red (disappearance of Fim1p-mEGFP). The number of points varies with the lifetime of the patch. The gray dotted line is drawn parallel to the plasma membrane to mark the initial positions of patches. Scale bar: 200 nm. (B–E) Evolution of patch parameters over time. Symbols and lines for cell types: black plain lines, wild-type; mustard +, acp1∆; olive x, acp2∆; teal ●, aip1∆; purple ◻, double mutant acp1∆/acp2∆; brown ○, acp1∆/aip1∆. (B) Average displacements over 1 s of patches estimated from mEGFP-Act1p movies. Inset, normalized efficiency plots of the numbers of actin molecules per patch (normalized to the peak value) vs. displacement of the patch. (C) Estimated Stokes' radii of moving endocytic patches extracted from the data in B. Inset, detailed view at late time points. (D) Occupancy of fimbrin on actin filaments. The occupancy was calculated as the ratio between the numbers of actin (mEGFP-Act1p/5%, Figure 4C) and Fim1p-mEGFP (Figure 4D). The schematics show the density of cross-linking in wild-type cells at −8 s and 0 s based on data from this panel and Figures 1B and 2C. (E) Average volumetric densities of actin in moving patches calculated as the ratio between the number of actin molecules (mEGFP-Act1p/5%, Figure 4C) and the volume of a sphere of the Stokes' radius (C) minus the volume of the spherical vesicle with radius of 25 nm. Inset, average radial densities of five endocytic proteins in patches of wild-type cells. Color code: black, Act1p; green, Fim1p; blue, Acp1p; purple, Acp2p; and red, Aip1p. The radial density is calculated as the ratio between the number of molecules and the Stokes' radius at each time t. The schematics are density profiles of actin in wild-type patches at three points in time based on the data in this panel and inset with the assumption that the filaments grow radially around vesicles. The blue lines illustrate how peripheral disassembly of a radially grown meshwork decreases the average distance between molecules in the meshwork, subsequently increasing its volumetric density without changing its radial density.
FIGURE 6:
FIGURE 6:
Endocytic patch polarization and dispersion in wild-type and mutant cells. (A) Negative-contrast fluorescence micrographs of representative cells expressing Fim1p-mEGFP in seven strains indicated at the top of each set. First row, short interphase cells; middle row, medium-sized interphase cells; third row, cells in cytokinesis. (B) Graphs of the total number of patches per cell marked with Fim1p-mEGFP vs. the cell length for the strain indicated above each panel. Each symbol corresponds to an individual cell in interphase (●) or cytokinesis (+). Lines are the best linear correlations for the data (blue, y-intercept equals 0; black, free y-intercept). The equations for these lines are given at the bottom right of each graph. (C) Distributions of endocytic patches in three equal zones along the long axis: red, tip with the larger number of patches; green, middle of the cell; blue, tip with the smaller number of patches. Darkly colored dots are the average proportion of patches in a given part of interphase cells. Lightly colored bars are ± 1 SD of these mean proportions. Lightly colored plus symbols (+) represent the distribution of patches in individual cells in cytokinesis. (D) Dispersion index OP50 (as defined in Berro and Pollard, 2014). Black dots are average values of the OP50 index in interphase cells. Gray bars are ± 1 SD of the means. Plus symbols are OP50 indices for individual cells in cytokinesis.
FIGURE 7:
FIGURE 7:
Scale drawings of 10-nm-thick sections of actin filament networks in endocytic patches of wild-type, acp1Δ, and aip1Δ strains at two time points, (left) just before scission of the clathrin-coated pit (t = −1 s) and (right) during disassembly (t = +5 s). The small actin network below the pinched-off wild-type vesicle at t = +5 s represents a part of the network released after severing by ADF/cofilin. Owing to the two-dimensional representation of the three-dimensional meshwork, some filaments cross-linked by fimbrin are not represented in this drawing. Widely spaced filaments in acp1/2Δ cells cannot be cross-linked. Color code: black line, actin filaments; light gray line, plasma membrane; dark gray, clathrin; thick brown wedges, Arp2/3 complex bound to an actin filament; thin brown wedges, inactive Arp2/3 complex; blue “C,” capping protein; red “A,” Aip1p; green connected disks, fimbrin. Actin, fimbrin, and membrane lengths and thicknesses are drawn to scale. The numbers of molecules of active and inactive Arp2/3 complex, capping protein, Aip1p, and fimbrin, and the overall length of actin filaments come from this study, Sirotkin et al. (2010), and Berro et al. (2010). The geometry of the clathrin-coated pit and the pinched-off vesicle are based on Kukulski et al. (2012).

References

    1. Al Tanoury Z, Schaffner-Reckinger E, Halavatyi A, Hoffmann C, Moes M, Hadzic E, Catillon M, Yatskou M, Friederich E. Quantitative kinetic study of the actin-bundling protein l-plastin and of its impact on actin turn-over. PLoS One. 2010;5:e9210. - PMC - PubMed
    1. Arasada R, Pollard TD. Distinct roles for F-BAR proteins Cdc15p and Bzz1p in actin polymerization at sites of endocytosis in fission yeast. Curr Biol. 2011;21:1450–1459. - PMC - PubMed
    1. Bahler J, Wu JQ, Longtine MS, Shah NG, McKenzie A, III, Steever AB, Wach A, Philippsen P, Pringle JR. Heterologous modules for efficient and versatile PCR-based gene targeting in Schizosaccharomyces pombe. Yeast. 1998;14:943–951. - PubMed
    1. Basi G, Schmid E, Maundrell K. TATA box mutations in the Schizosaccharomyces pombe nmt1 promoter affect transcription efficiency but not the transcription start point or thiamine repressibility. Gene. 1993;123:131–136. - PubMed
    1. Berro J, Pollard TD. Local and global analysis of endocytic patch dynamics in fission yeast using a new “temporal superresolution” realignment method. Mol Biol Cell. 2014;25:3501–3514. - PMC - PubMed

MeSH terms

LinkOut - more resources