. 2014 Oct 15;25(20):3234-46.
doi: 10.1091/mbc.E14-03-0851. Epub 2014 Aug 20.

Systematic lipidomic analysis of yeast protein kinase and phosphatase mutants reveals novel insights into regulation of lipid homeostasis

Affiliations

Systematic lipidomic analysis of yeast protein kinase and phosphatase mutants reveals novel insights into regulation of lipid homeostasis

Aline Xavier da Silveira Dos Santos et al. Mol Biol Cell. .

Abstract

The regulatory pathways required to maintain eukaryotic lipid homeostasis are largely unknown. We developed a systematic approach to uncover new players in the regulation of lipid homeostasis. Through an unbiased mass spectrometry-based lipidomic screening, we quantified hundreds of lipid species, including glycerophospholipids, sphingolipids, and sterols, from a collection of 129 mutants in protein kinase and phosphatase genes of Saccharomyces cerevisiae. Our approach successfully identified known kinases involved in lipid homeostasis and uncovered new ones. By clustering analysis, we found connections between nutrient-sensing pathways and regulation of glycerophospholipids. Deletion of members of glucose- and nitrogen-sensing pathways showed reciprocal changes in glycerophospholipid acyl chain lengths. We also found several new candidates for the regulation of sphingolipid homeostasis, including a connection between inositol pyrophosphate metabolism and complex sphingolipid homeostasis through transcriptional regulation of AUR1 and SUR1. This robust, systematic lipidomic approach constitutes a rich, new source of biological information and can be used to identify novel gene associations and function.


Figures

FIGURE 1:
FIGURE 1:
Workflow of lipid analysis. The lipid profile of yeast knockouts of protein kinase or phosphatase gene was systematically generated. Each strain was grown in standard conditions and processed in independent biological duplicates. Lipids were extracted according to different protocols and subjected to mass spectrometry analysis. Glycerophospholipids (GPLs) and sphingolipids (SLs) were analyzed by electrospray ionization mass spectrometry (ESI-MS) using multiple reaction monitoring. Sterols were analyzed using gas chromatography coupled to mass spectrometry (GC-MS). MS signal intensities were converted to relative concentrations based on standard curves of internal standards spiked in the samples before lipid extraction. Data were normalized and analyzed as described in Materials and Methods and the Supplemental Information.
FIGURE 2:
FIGURE 2:
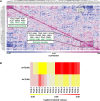
Overview of the screening: effect of kinase and phosphatase knockouts on the lipidome of yeast. (A) Correlation matrix of strains analyzed in the screening. Clusters of mutants involved in nutrient-sensing pathways are highlighted. Top right, vps15Δ and vps34Δ strains clustering together. (B) Strain-oriented query reveals detailed lipid profile of strains snf1Δ and tor1Δ, showing opposite lipid changes in PC species. Data given in Supplemental Tables S4 and S5.
FIGURE 3:
FIGURE 3:
Nutrient-sensing pathways have a strong effect on the lipid profile. (A) The relative impact (RI) of a given knockout gene on the lipidome is a global measurement of disturbance in the lipid profile, calculated by the relative number of lipids that scored as a hit from all lipids analyzed (details in the text). High impact, RI > 0.22. (B) High-impact mutants implicated in nutrient-sensing pathways are highlighted in blue.
FIGURE 4:
FIGURE 4:
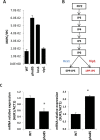
Nutrient-sensing pathways revealed by lipidomic screening. Global analysis of lipid changes revealed a strong effect of major nutrient-sensing pathways in the lipid profile of a cell. (A) Changes in glycerophospholipid profiles of snf1Δ and tor1Δ mutants are anticorrelated and reflect their opposite biological roles in cellular metabolism. (B, C) The snf1Δ mutant was complemented by SNF1, which also reversed its lipid profile back to wild-type cells. EV, empty vector. Data are median and SD of biological triplicates. *p < 0.05, t test.
FIGURE 5:
FIGURE 5:
SNF1 regulates the homeostasis of fatty acid chain length in glycerophospholipids. (A) Scheme of GPL biosynthesis in S. cerevisiae. Under normal conditions, the CDP-DAG pathway (red box) is the major route for synthesis of GPLs with a contribution of the Kennedy pathway (green box). (B) Ratio of long-chain fatty acids (FAs; >C18) over short-chain FAs (<C16) in GPL. WT strain (blue bars) and a strain containing only the Kennedy pathway (PPAΔ, green bars) have a prevalence of long-chain FAs in PI, PS, and PE but not in PC. The strain containing only CDP-DAG pathway (CEDΔ, red bars) has similar amounts of long- and short- chain FAs in PI, PS, and PE and a prevalence of short-chain FAs in PC. SNF1 deletion caused a general increase in the amount of long-chain FAs in all GPLs. No selective effect of SNF1 deletion on the CDP-DAG or Kennedy pathway was observed. Data are represented as ratio of long/short GPLs. Mean and SD of three independent biological replicates are shown. Data given in Supplemental Table S11.
FIGURE 6:
FIGURE 6:
Novel candidates for regulation of sphingolipid homeostasis. (A) Relative changes (log2[normalized data]) in total amounts of ceramides (CER) and the major complex sphingolipid (IPC). Strains that scored as a hit for low levels (blue) or high levels (red) are listed. Details are in the text.
FIGURE 7:
FIGURE 7:
A connection between phosphate metabolism and sphingolipids. (A) Sphingolipid profile of pho85Δ, kcs1Δ, and vip1Δ mutants, showing an imbalance in MIPC/IPC levels in pho85Δ and kcs1Δ. Data for IPC-C 44:0 and MIPC-C 44:0 (from Supplemental Table S8). (B) The inositol pyrophosphate pathway. The 1PP-IP5 (IP7) produced by Vip1 acts as a cofactor of Pho81, an inhibitor of CDK. Inactive CDK results in accumulation of nonphosphorylated Pho4 (not shown) in the nucleus, where it activates gene transcription. (C) Relative amounts of mRNA expression of AUR1 and SUR1 genes from the sphingolipid biosynthesis pathway (see Figure 4). Data from three independent biological replicates. Mean and SD. *p < 0.05, t test.

References

    1. Aguilar PS, Heiman MG, Walther TC, Engel A, Schwudke D, Gushwa N, Kurzchalia T, Walter P. Structure of sterol aliphatic chains affects yeast cell shape and cell fusion during mating. Proc Natl Acad Sci USA. 2010;107:4170–4175. - PMC - PubMed
    1. Alvarez-Vasquez F, Sims KJ, Voit EO, Hannun YA. Coordination of the dynamics of yeast sphingolipid metabolism during the diauxic shift. Theor Biol Med Model. 2007;4:42. - PMC - PubMed
    1. Barbosa AD, Osório H, Sims KJ, Almeida T, Alves M, Bielawski J, Amorim MA, Moradas-Ferreira P, Hannun YA, Costa V. Role for Sit4p-dependent mitochondrial dysfunction in mediating the shortened chronological lifespan and oxidative stress sensitivity of Isc1p-deficient cells. Mol Microbiol. 2011;81:515–527. - PMC - PubMed
    1. Bennett M, Onnebo S, Azevedo C, Saiardi A. Inositol pyrophosphates: metabolism and signaling. Cell Mol Life Sci. 2006;63:552–564. - PMC - PubMed
    1. Berchtold D, Piccolis M, Chiaruttini N, Riezman I, Riezman H, Roux A, Walther TC, Loewith R. Plasma membrane stress induces relocalization of Slm proteins and activation of TORC2 to promote sphingolipid synthesis. Nat Cell Biol. 2012;14:542–547. - PubMed

Publication types