Multicenter Study
. 2014 Aug 20;34(34):11355-65.
doi: 10.1523/JNEUROSCI.2654-13.2014.

Theta and high-frequency activity mark spontaneous recall of episodic memories

Affiliations
Multicenter Study

Theta and high-frequency activity mark spontaneous recall of episodic memories

John F Burke et al. J Neurosci. .

Abstract

Humans possess the remarkable ability to search their memory, allowing specific past episodes to be re-experienced spontaneously. Here, we administered a free recall test to 114 neurosurgical patients and used intracranial theta and high-frequency activity (HFA) to identify the spatiotemporal pattern of neural activity underlying spontaneous episodic retrieval. We found that retrieval evolved in three electrophysiological stages composed of: (1) early theta oscillations in the right temporal cortex, (2) increased HFA in the left hemisphere including the medial temporal lobe (MTL), left inferior frontal gyrus, as well as the ventrolateral temporal cortex, and (3) motor/language activation during vocalization of the retrieved item. Of these responses, increased HFA in the left MTL predicted recall performance. These results suggest that spontaneous recall of verbal episodic memories involves a spatiotemporal pattern of spectral changes across the brain; however, high-frequency activity in the left MTL represents a final common pathway of episodic retrieval.

Keywords: ECoG; episodic retrieval; high-frequency activity; memory; theta.


Figures

Figure 1.
Figure 1.
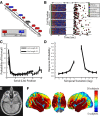
Free recall task. A, In the delayed free recall task, participants are given a list of words, and are then asked to retrieve/vocalize the words in the most recent list. B, Example behavioral data from one participant across four sessions of delayed free recall. C, The probability (y-axis) that a word presented at a given list position (x-axis) was retrieved first (probability of first recall; PFR) during the recall period. Error bars represent ±1 SEM across patients. D, Given a word from a certain list position was retrieved, the probability (y-axis) that the next retrieval was from a word nearby in list position (lag; x-axis). Error bars represent ±1 SEM across patients. E, Example electrode implantation: patient had bilateral depth electrodes (pictured in MRI) and additional cortical subdural electrodes (not visible in image). F, Heat map corresponding to number of patients with electrodes within 12.5 mm of each point across the cortical surface.
Figure 2.
Figure 2.
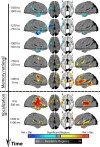
Theta activity (3–8 Hz) across time during retrieval. In each panel, all spherical regions that exhibited a significant (FDR corrected) change in power during spontaneous retrieval are displayed on a three-dimensional brain. The black line to the side of each panel represents time. Power changes reflect a comparison between retrieval (Ret) and a baseline condition (Bas). Increases (Ret > Bas) and decreases (Ret < Bas) in power are shown in red and blue, respectively. The horizontal dashed line on the sagittal views corresponds to the level of the axial cut in the third panel. Color and grayscale renderings represent the percentage of nearby regions exhibiting significant effects and containing more than five patients, respectively. Radiological slice view is shown with right (R) and left (L) hemispheres labeled.
Figure 3.
Figure 3.
HFA (64–95 Hz) across time during retrieval. Identical plot as in Figure 2 displaying changes in HFA power during retrieval.
Figure 4.
Figure 4.
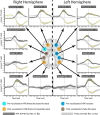
Timing of theta and HFA across ROIs. Each subpanel shows relative power, across time, in both the theta (light gray) and HFA (dark gray) frequency bands during retrieval. The y-axis in each panel represents t-statistics (comparing power during retrieval vs baseline) averaged across patients with electrodes in each ROI; the width of each line is proportional to ±1 SEM. The time on the x-axis corresponds to the midpoint of a 500 ms time epoch, incremented every 10 ms. Yellow asterisks represent significant shifts in power across patient (t test; p < 0.05; Bonferroni corrected across time and frequency band). Each ROI corresponds to a different subpanel. O, Occipital; P, parietal; F, frontal; T, temporal; L, limbic (nonhippocampal); H, hippocampal; N, number of patients in each ROI.
Figure 5.
Figure 5.
Power in six select ROIs during retrieval. Power (Z-scored) across all frequencies was first averaged, for each patient, across all electrodes in each labeled ROI. The resulting distribution of averaged power values, across all patients in each ROI, is shown separately for the time period in the memory retrieval interval in which the ROI is first active (Table 1) as well as the vocalization interval (250–750 ms after vocalization onset). The red and blue lines represent the averaged power across correct recalls and the baseline period, respectively. The yellow boxes represent the theta (3–8 Hz) and the HFA (64–96 Hz) bands used for all analyses. L, Left; R, right; Motor, motor region.
Figure 6.
Figure 6.
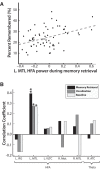
Across patient correlation of power and memory performance. A, For each patient with electrodes in the L MTL, we calculated (1) power in the HFA band (identical to Fig. 6) 2000–250 ms before word presentation and (2) the percentage of correctly recalled items across all sessions. The correlation between these two variables was statistically reliable (r = 0.3911, p = 0.0015). B, We repeated the analysis in A for all ROIs in Figure 5 for power during correct retrievals in the memory retrieval interval (2000–250 ms before vocalization), in the vocalization interval (250–2000 ms after vocalization), as well as for baseline power. HFA power in the L MTL trended toward significance for all three conditions (*p < 0.05), but was only significant after correcting for multiple comparisons during memory retrieval (** FDR corrected, q = 0.05). L, Left; R, right; Motor, motor region.
Figure 7.
Figure 7.
Summary of main effects. Episodic retrieval is defined by three distinct electrophysiological stages: Left, An early stage, 1000–2000 ms before recall, marked by right temporal cortical theta oscillations; Middle, A middle stage, ∼1000 ms before recall, characterized by increased HFA in a left hemispheric network consisting of the L MTL, L VLTC, and L IFG; and Right, A final stage marked by motor/language increase in HFA (and decrease in theta) during vocalization itself. In each stage, activations (marked in yellow) refer to increases in power during spontaneous recall; only high-frequency activity in the Left MTL in the second stage (marked in green) directly correlated with memory performance.

References

    1. Addison PS. The illustrated wavelet transform handbook: introductory theory and applications in science, engineering, medicine and finance. Bristol: Institute of Physics; 2002.
    1. Badre D, Wagner AD. Left ventrolateral prefrontal cortex and the cognitive control of memory. Neuropsychologia. 2007;45:2883–2901. doi: 10.1016/j.neuropsychologia.2007.06.015. - DOI - PubMed
    1. Brassen S, Weber-Fahr W, Sommer T, Lehmbeck JT, Braus DF. Hippocampalprefrontal encoding activation predicts whether words can be successfully recalled or only recognized. Behav Brain Res. 2006;171:271–278. doi: 10.1016/j.bbr.2006.04.002. - DOI - PubMed
    1. Burgess AP, Gruzelier JH. Short duration synchronization of human theta rhythm during recognition memory. Neuroreport. 1997;8:1039–1042. doi: 10.1097/00001756-199703030-00044. - DOI - PubMed
    1. Burke JF, Long NM, Zaghloul KA, Sharan AD, Sperling MR, Kahana MJ. Human intracranial high-frequency activity maps episodic memory formation in space and time. Neuroimage. 2014;85:834–843. doi: 10.1016/j.neuroimage.2013.06.067. - DOI - PMC - PubMed

Publication types

LinkOut - more resources