. 2014 Aug 20;34(34):11485-503.
doi: 10.1523/JNEUROSCI.0210-14.2014.

Activation of TRPML1 clears intraneuronal Aβ in preclinical models of HIV infection

Affiliations

Activation of TRPML1 clears intraneuronal Aβ in preclinical models of HIV infection

Mihyun Bae et al. J Neurosci. .

Abstract

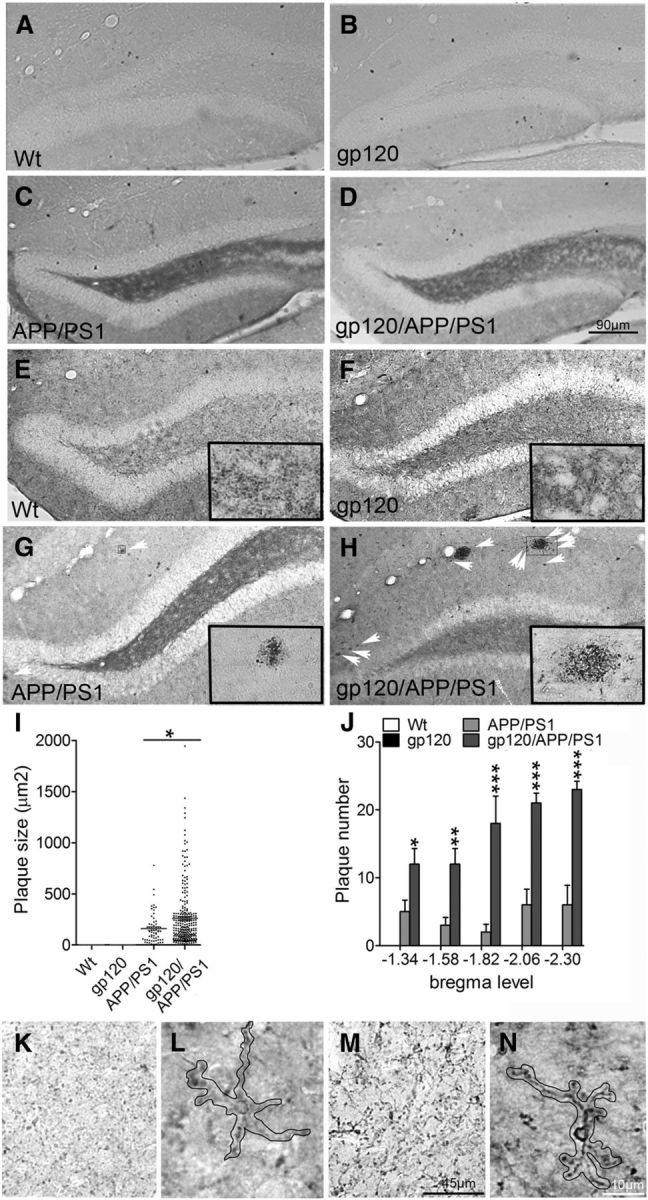
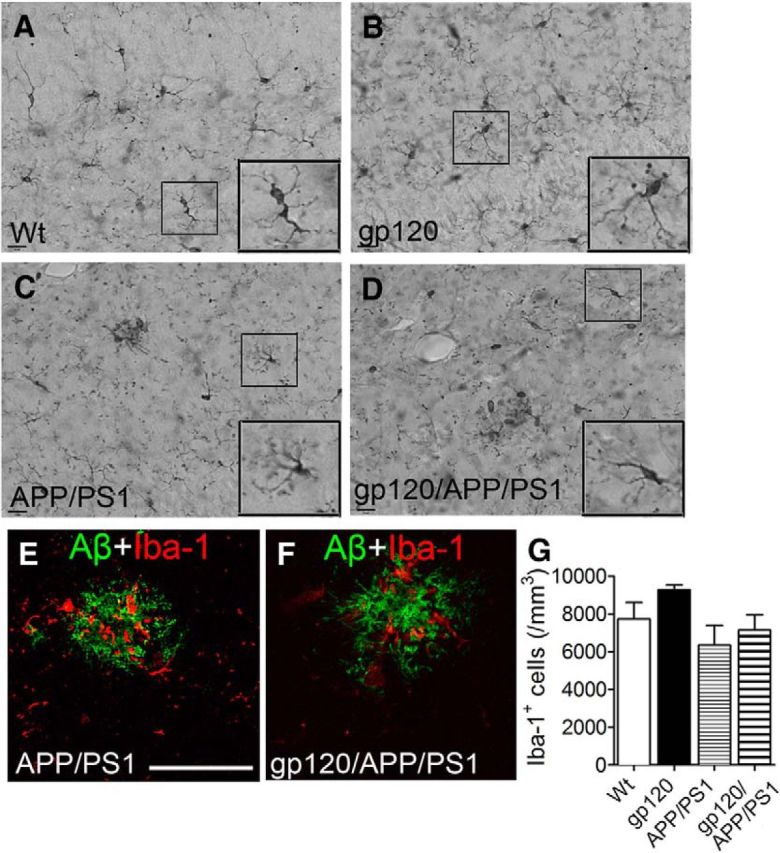
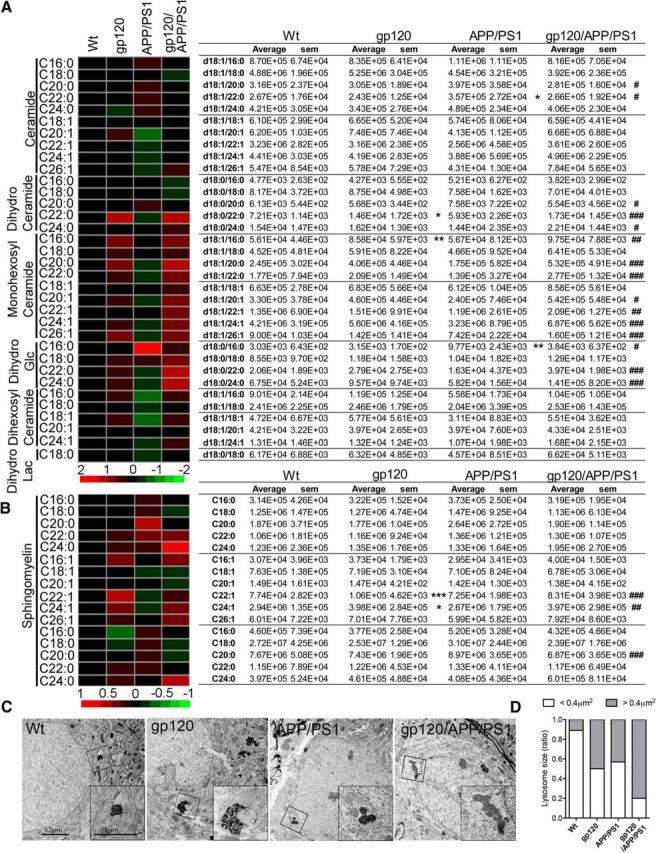
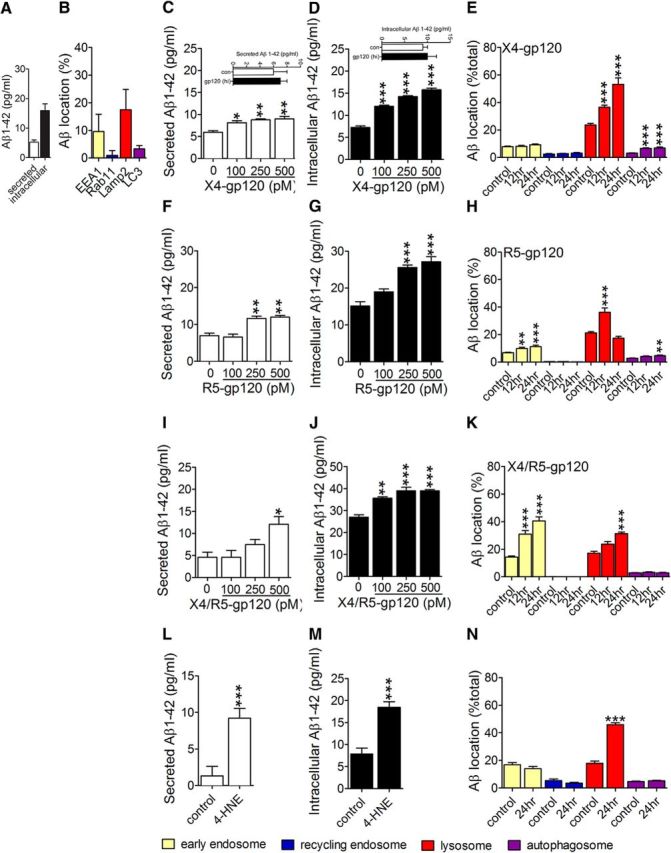
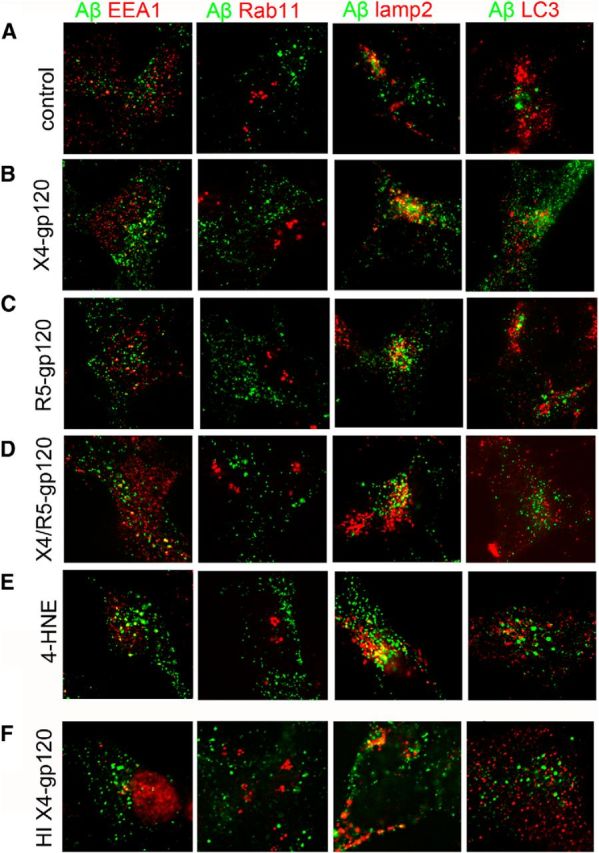
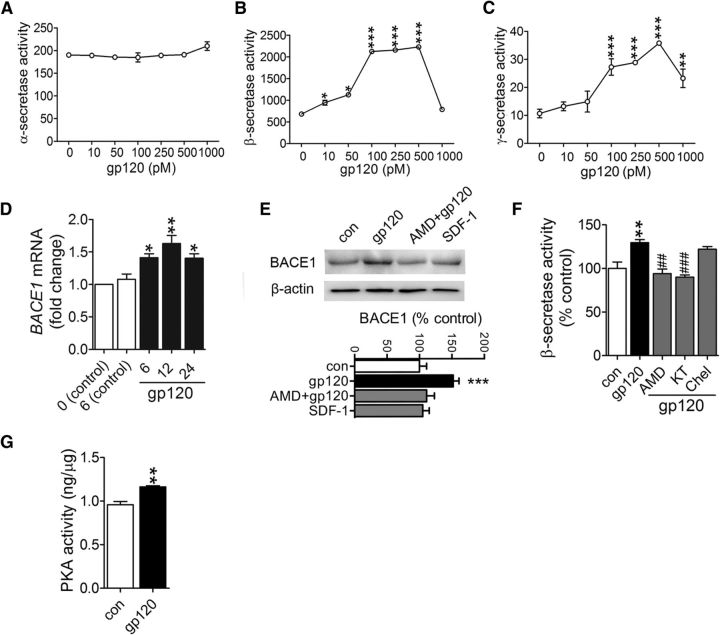
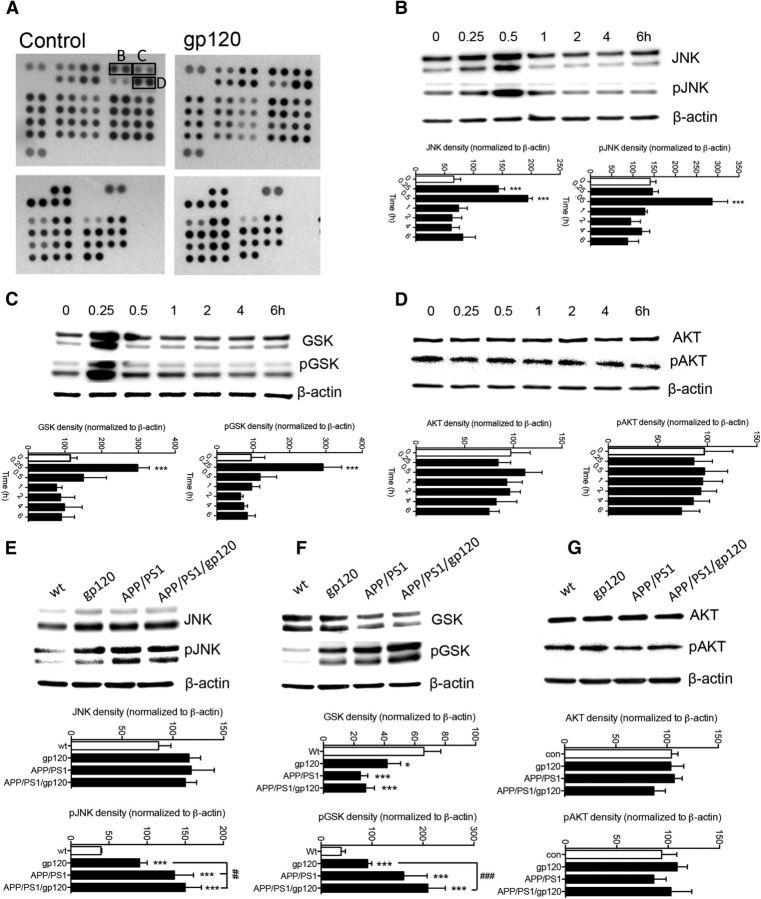
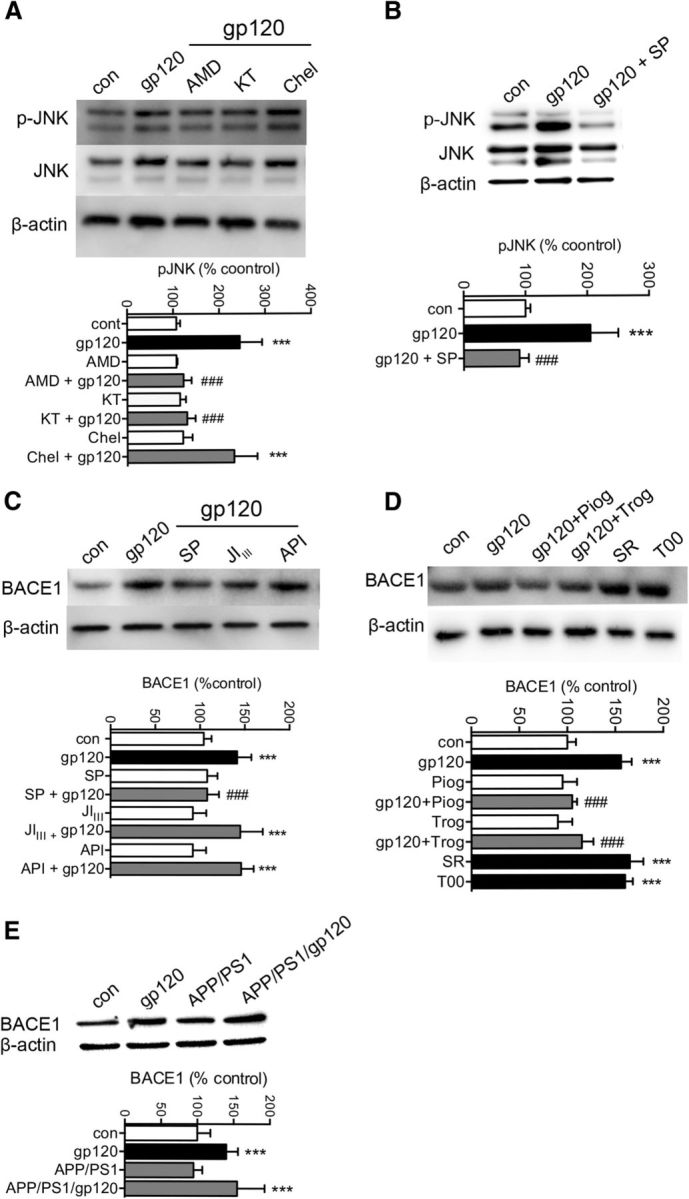
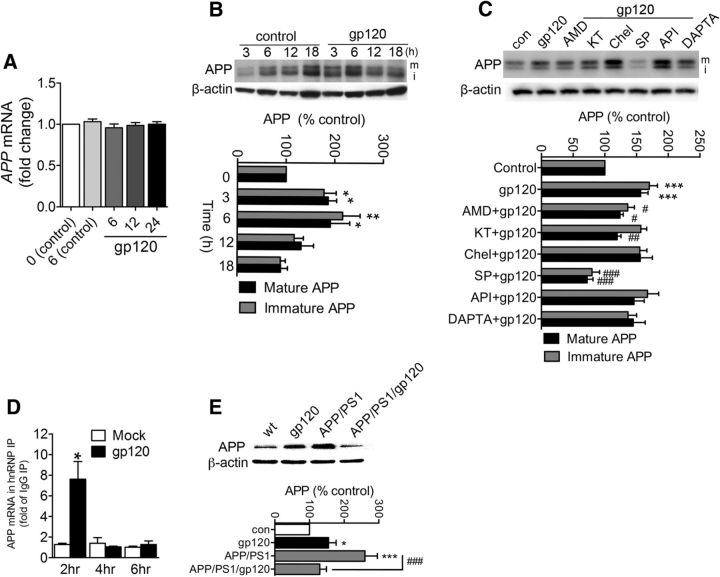
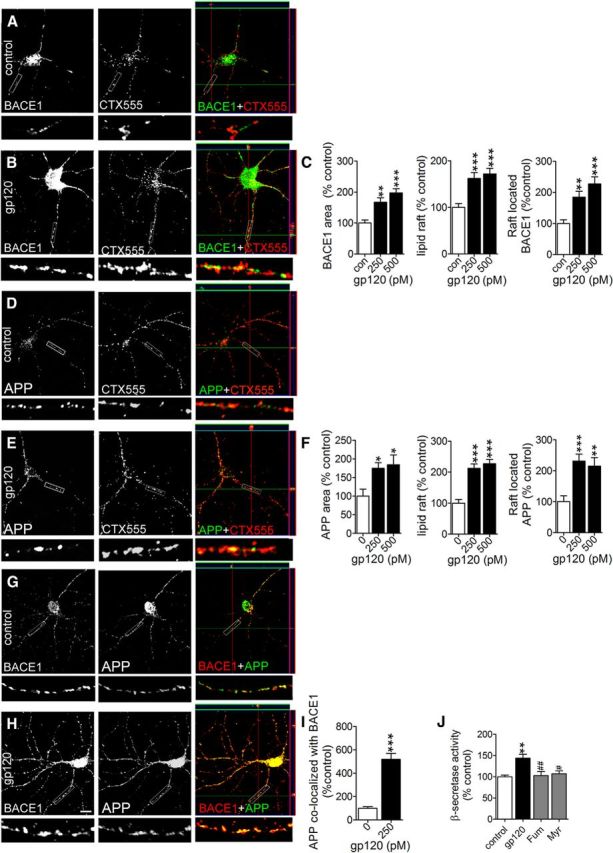
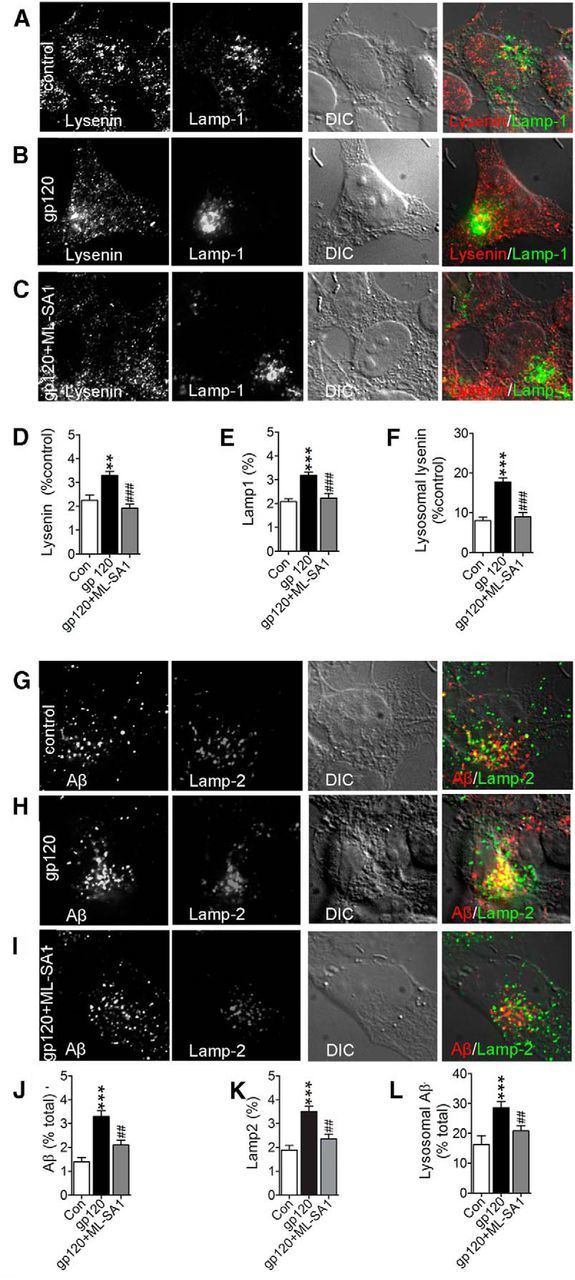
Antiretroviral therapy extends the lifespan of human immunodeficiency virus (HIV)-infected patients, but many survivors develop premature impairments in cognition. These residual cognitive impairments may involve aberrant deposition of amyloid β-peptides (Aβ). By unknown mechanisms, Aβ accumulates in the lysosomal and autophagic compartments of neurons in the HIV-infected brain. Here we identify the molecular events evoked by the HIV coat protein gp120 that facilitate the intraneuronal accumulation of Aβ. We created a triple transgenic gp120/APP/PS1 mouse that recapitulates intraneuronal deposition of Aβ in a manner reminiscent of the HIV-infected brain. In cultured neurons, we found that the HIV coat protein gp120 increased the transcriptional expression of BACE1 through repression of PPARγ, and increased APP expression by promoting interaction of the translation-activating RBP heterogeneous nuclear ribonucleoprotein C with APP mRNA. APP and BACE1 were colocalized into stabilized membrane microdomains, where the β-cleavage of APP and Aβ formation were enhanced. Aβ-peptides became localized to lysosomes that were engorged with sphingomyelin and calcium. Stimulating calcium efflux from lysosomes with a TRPM1 agonist promoted calcium efflux, luminal acidification, and cleared both sphingomyelin and Aβ from lysosomes. These findings suggest that therapeutics targeted to reduce lysosomal pH in neurodegenerative conditions may protect neurons by facilitating the clearance of accumulated sphingolipids and Aβ-peptides.

Keywords: HIV; amyloid; dementia; endosome; lysosome; neuron.


Figures

Figure 1.
Figure 1.
Aβ deposition is accelerated in gp120/APP/PS1 mice compared with APP/PS1 mice. A, B, Two-month-old wt and gp120 mice do not show evidence of Aβ deposition. C, D, Diffuse Aβ appears in the dentate gyrus of 2-month-old APP/PS1, and gp120/APP/PS1 mice. E, F, Six-month-old wt and gp120 mice are negative for Aβ deposition. G, H, In 6-month-old APP/PS1 and gp120/APP/PS1 mice Aβ containing plaques are apparent throughout cortical and subcortical regions. Plaques are more frequent and larger in gp120/APP/PS1 mice compared with APP/PS1 mice. Arrows show examples of Aβ plaques, and insets show magnification of the indicated region. IL, Sterological counts of plaque size, and number of plaques by genotype and bregma level. In 6-month-old APP/PS1 mice faint staining of diffuse Aβ can been seen in neuropil, and as small intraneuronal deposits in some cells. M, N, In 6-month -old gp120/APP/PS1 mice prominent intraneuronal staining is apparent. A single neuron in each panel is outlined. Data are mean ± SD; n = 3 mice/group. ANOVA with Tukey post hoc comparisons; *p < 0.05, **p < 0.01, ***p < 0.001 compared with control.
Figure 2.
Figure 2.
Microglial cells surround amyloid plaques. Iba-1 staining of (A) wt, (B) gp120, (C) APP/PS1, and (D) gp120/APP/PS1 mouse hippocampus. Insets are magnifications of the indicated regions. Immunofluorescent staining showing an Aβ immunopositive plaques (82E1) and microglia (Iba-1) in (E) APP/PS1 and (F) gp120/APP/PS1 mice. G, Sterological quantification of Iba-1-immunopositive cells for the indicated mouse genotypes. Scale bar, 100 μm. ANOVA with Tukey post hoc comparisons.
Figure 3.
Figure 3.
Sphingolipid accumulation and lysosomal pathology in gp120/APP/PS1 mice. A, B, Heat maps and associated counts of the indicated ceramide and sphingomyelin species for wt, gp120, APP/SP1, and gp120/APP/PS1 mice showing that multiple-long and very-long chain ceramides were increased in the cortex of the gp120/APP/PS1 transgenic mice. Data are mean ± SEM; n = 5/group. ANOVA with Tukey post hoc comparisons; *p < 0.05, p < 0.01, ***p < 0.001 compared with control, #p < 0.05, ##p < 0.01, ###p < 0.001 compared with gp120. C, Representative electron microscopy images showing ultrastructural analysis of endolysosomal phenotypes in brain tissues from the indicated genotype. Lysosomes in wt mice show typical electron dense lysosomal inclusions. In gp120 mice, lysosomes are enlarged and contain lipid inclusions known as lipofuscin. Although lysosomes appear to be phenotypically normal in APP/PS1 mice, they are enlarged, partially fused, and contain lipofuscin in gp120/APP/PS1 mice. Insets, are magnifications of the indicated region. Scale bars: 2 μM in main figure and 1 μM in insets. D, Quantitative analysis of lysosomal size expressed as percentage of lysosomes with size <0.4 μm2 (white bars) compared with lysosomes >0.4 μm2 (black bars) for the indicated genotypes. Data are mean ± SEM of 45–60 cells in each of three independent experiments per condition. ANOVA with Tukey post hoc comparisons; *p < 0.05, **p < 0.01, ***p < 0.001 compared with wt.
Figure 4.
Figure 4.
HIV-gp120 induces Aβ formation and perturbs clearance. A, Secreted and intracellular levels of Aβ1–42 in SHSY5Y cells stably expressing human APP were determined by ELISA 24 h after media change. B, Intracellular distribution of Aβ (82E1) in early endosomes (EEA1), recycling endosomes (Rab11), lysosomes (LAMP2), and autophagosomes (LC3) were determined by quantitative immunofluorescence. C, D, Cells were treated for 24 h with the indicated concentrations of X4-gp120. Secreted and intracellular concentrations of Aβ1-42 were determined by ELISA. Insets show results for heat inactivated (hi) X4-gp120 (500 pM). E, Colocalization of Aβ with EEA1, Rab11, LAMP2, and LC3 was quantified 12 and 24 h after exposure to X4-gp120 (250 pm). F, G, Secreted and intracellular Aβ1–42 was quantified 24 h after exposure to the indicated concentrations of R5-gp120 by ELISA. H, Colocalization of Aβ with EEA1, Rab11, LAMP2, and LC3 was quantified 12 and 24 h after exposure to R5-gp120 (250 pm). I, J, Secreted and intracellular levels of Aβ1-42 were determined by ELISA 24 h after exposure to the indicated concentrations of X4/R5-gp120. K, Colocalization of Aβ with Rab11, LAMP2, and LC3 was quantified 12 and 24 h after exposure to X4/R5-gp120 (100 pm). L, M, Aβ1-42 secretion and intraneuronal deposition were quantified by ELISA in neuronal cells treated with 4-HNE for 24 h (100 nM). N, Immunofluorescent quantification of Aβ colocalized with Rab11, LAMP2, and LC3 24 h after exposure to 4-HNE (100 nM). Data are mean ± SEM of at least 21 cells, and three independent experiments per condition. ANOVA with Tukey post hoc comparisons; *p < 0.05, **p < 0.01, ***p < 0.001 compared with corresponding control.
Figure 5.
Figure 5.
Aβ localizes to lysosomes in neuronal cells exposed to gp120. Representative fluorescent images from SHY5Y cells stably expressing human APP exposed to (A) control, (B) X4-gp120 (250 pm), (C) R5-gp120, (D) X4/R5gp120 (250 pm), (E) 4HNE (10 nm), and (F) heat-denatured X4-gp120 (500 pM) for 24 h. Merged images for Aβ (82E1) with markers for early endosomes (EEA1), recycling endosomes (Rab11), lysosomes (lamp2), and autophagosomes (LC3).
Figure 6.
Figure 6.
Induction of BACE1 transcriptional activation by gp120-mediated suppression of PPARγ. Figures show (A) ∝-secretase (B) β-secretase, and (C) γ-secretase activity in primary neurons treated for 6 h with the indicated dose of gp120 (10–1000 pm). D, qPCR results showing BACE1 mRNA for the indicated time points following control or gp120 exposures. E, Representative Western blot showing BACE1 protein levels in primary neurons treated for 6 h with gp120 (250 pm), or SDF 1α (20 nm), or pretreated for 30 min with the CXCR4 inhibitor AMD 3100 (10 μm) before the addition of gp120. Densitometric analyses of BACE1 protein expression for the indicated conditions are normalized to β-actin. F, β-secretase activity measured in neurons treated with gp120 (250 pm) for 6 h, or pretreated for 30 min with AMD3100 (AMD, 10 μm), the PKA inhibitor KT5720 (KT; 1 μm), or the PKC inhibitor chlerythrine (Chel; 1 μm) before additions of gp120. G, PKA phosphotransferase activity was measured in primary neurons treated with gp120 (250 pm) for 6 h. ANOVA with Tukey post hoc comparisons; *p < 0.05, **p < 0.01, ***p < 0.001 compared with the corresponding control or time 0; #p < 0.05, ##p < 0.01, ###p < 0.001 compared with gp120.
Figure 7.
Figure 7.
HIV gp120 activated a restricted set of kinases. A, Proteome profiler array to identify phosphorylated kinases in primary neurons under control conditions and following gp120 (100 pm) treatment for 30 min. The indicated spots refer to kinases confirmed by the corresponding Western blots. The expression and phosphorylation of (B) c-JNK, (C) GSK, and (D) AKT were confirmed in neurons treated with gp120 (100 pm) for the indicated time points. Protein expression and phosphorylation of (E) JNK, (F) GSK, and (G) AKT were also confirmed in hippocampus from 6-month-old mice of the indicated genotypes. Data are mean ± SD for at-least n = 3 independent experiments per condition. ANOVA with Tukey post hoc comparisons; *p < 0.05, **p < 0.01, ***p < 0.001 compared with the corresponding control; #p < 0.05, ##p < 0.01, ###p < 0.001 compared with gp120.
Figure 8.
Figure 8.
HIV gp120 promotes the release of Bace1 transcriptional repression through induction of the MAP kinase pathway and PPARγ. A, Representative Western blot showing total JNK and pJNK protein expression in cells treated for 30 min with gp120 (250 pm), or pretreated with AMD 3100 (10 μM), KT 5720 (1 μM), or Chelerythrine (1 μM) for 30 min before gp120 treatments. Quantitative densitometric analysis of Western blots showing pJNK for the indicated treatments. B, Representative Western blot and densitometric analysis showing total JNK and pJNK in cells treated for 30 min with gp120 (250 pm) or pretreated with the JNK inhibitor SP600125 (SP, 20 μm) for 30 min before gp120. C, Representative Western blot and densitometric analysis showing BACE1 protein levels in primary neurons treated with gp120 (250 pm) for 6 h, or pretreated with SP600125 (SP; 20 μm), a peptide inhibitor that blocks the interaction of JNK with cJUN (JIIII; 10 μm), or an inhibitor of AKT (API; 20 μm) for 30 min before gp120. D, Representative Western blot and densitometric analysis showing BACE1 protein levels in neurons treated with gp120 (250 pm) for 6 h, or pretreated for 30 min with the agonists of PPARγ Pioglitazone (Piog; 10 μm) and Triglitazone (Trog; 20 μm) before gp120 treatments. Neurons were exposed to antagonists of PPARγ SR202 (SR; 20 μm) and T007907 (T00; 10 μm) for 6 h in the absence of gp120. E, Representative Western blot and densitometric analysis of BACE1 protein levels in hippocampus for the indicated genotypes of 6-month-old mice. Data are mean ± SD for at least n = 3 independent experiments per condition. ANOVA with Tukey post hoc comparisons; *p < 0.05, **p < 0.01, ***p < 0.001 compared with the corresponding control; #p < 0.05, ##p < 0.01, ###p < 0.001 compared with gp120.
Figure 9.
Figure 9.
Increased APP production by gp120 is linked to increased interaction of the translation enhancer hnRNP C with APP mRNA. A, Time course (0–24 h) showing APP mRNA levels in SHSY5Y cells stably expressing human APP exposed to gp120 (250 pm) for the indicated time points. B, Representative Westen blot, and densitometric quantification showing immature (lower band; i) and mature (upper band; m) APP protein levels in cells exposed to gp120 (250 pm) for the indicated treatment times. C, Representative Western blot, and densitometric quantification of neuronal cells exposed to gp120 (250 pm) for 6 h, or pretreated with AMD3100 (AMD, 10 μm), KT5720 (KT, 1 μm), chlerythrine (Chel, 1 μm), SP600125 (SP, 20 μm), API-1 (API, 20 μm), or DAPTA (5 nm) 30 min before gp120 treatments. D, RIP analysis of APP mRNA associated with hnRNP C. At the times indicated following treatment with gp120, hnRNP C was immunoprecipitated using anti-hnRNP C antibody (IgG was used in control parallel immunoprecipitations) and the levels of APP mRNA present in the IP materials were quantified by RT-qPCR analysis. Data were calculated as the levels of APP mRNA relative to GAPDH mRNA in each IP sample. hnRNP IP results were then normalized to IgG IP. Data are the means ± SEM from n > 3 independent experiments per condition. E, Representative Western blot and densitometric quantification of APP from hippocampus of 6-month-old mice with the indicated genotypes. ANOVA with Tukey post hoc comparisons; *p < 0.05, **p < 0.01, ***p < 0.001 compared with the corresponding control; #p < 0.05, ##p < 0.01, ###p < 0.001 compared with gp120.
Figure 10.
Figure 10.
The association of APP with BACE1 is stabilized in lipid raft membrane microdomains following treatment with gp120. Representative images are 100× magnifications of primary neurons. At the bottom of each image are shown enlargements of the indicated neurite. Immunofluorescent images showing BACE1, CTX555 immunopositive membrane microdomains (lipid rafts), merged images, and orthogonal views for (A) control and (B) cultures treated for 6 h with gp120 (250 pm). Colocalized BACE1 and CTX555 appear yellow in merged images. C, Quantitation of fluorescence for BACE1, lipid rafts, and BACE1 colocalized to lipid rafts for the indicated concentrations of gp120. Representative immunofluorescent images show APP, and CTX555 immunopositive lipid rafts for (D) control and (E) cultures treated for 6 h with with gp120 (250 pm). Colocalized APP and CTX555 appear yellow in merged images. F, Quantitation of fluorescence for APP, lipid rafts, and APP colocalized to lipid rafts for the indicated concentrations of gp120. Representative images showing APP, BACE1, and merged images for (G) control and (H) neurons treated for 6 h with gp120 (250 pm). Colocalized APP and BACE1 appear yellow in merged images. I, Quantitation of colocalized APP and BACE1. J, BACE activity in primary neuronal cultures treated for 6 h with gp120 (250 pm), or pretreated with fumonisin β1 (Fum, 10 μm), or myriocin (Myr, 10 μm) followed by gp120. K, Secreted and intracellular Aβ1-42 measured by ELISA in cells treated with gp120 (250 pm) or with gp120 in the presence of β-cyclodextrin (5 mm). Quantitative data are mean ± SEM for at least n = 3 independent experiments per condition. ANOVA with Tukey post hoc comparisons; *p < 0.05, **p < 0.01, ***p < 0.001 compared with the corresponding control.
Figure 11.
Figure 11.
Calcium rapidly accumulates in the lysosomes of neurons treated with gp120. Representative images are of primary neurons transfected with the single wavelength genetically encoded calcium indicator GCaMP3-TRPML1. Representative images show peak lysosomal calcium release for the indicated conditions and corresponding differential interference contrast images (DIC). Time-lapse images were acquired at baseline, and following simulation with the TRPML1 agonist ML-SA1 (10 μm) in (AC) control cells, or (DF) neurons treated with gp120 (100 pm) for 6 h. G, Quantitation of maximal fluorescence intensity for the indicated conditions showing that ML-SA1-induced calcium release from lysosomes was increased following pretreatment with gp120. Applications of the calcium ionophore ionomycin produced similar maximal calcium increases in response to ML-SA1, suggesting that the probe was similarly expressed in all cells. Data are mean ± SEM of 21 cells/condition from three separate experiments. ANOVA with Tukey post hoc comparisons; ***p < 0.001 compared with control; ###p < 0.001 compared with gp120. H, Data from time-lapse experiments showing that ML-SA1 produced a rapid decline in endolysosomal pH. I, Summary data showing that gp120 increases endolysosomal pH, and that ML-SA1 reduces pH in control and gp120 pretreated cultures. Data are mean ± SEM of three cultures/condition. ANOVA with Tukey post hoc comparisons; **p < 0.01, ***p < 0.001.
Figure 12.
Figure 12.
Activation of TRPML1 clears sphingomyelin and Aβ from lysosomes. Representative fluorescent images from SHSY5Y cells stably expressing human APP showing the sphingomyelin binding protein lysenin, the lysosomal associated membrane protein 1 (Lamp-1), DIC, and the merged images for (A) control, (B) cells treated for 6 h with gp120 (250 pm), and (C) cells treated for 3 h with gp120 then stimulated for 3 h with ML-SA1 in the continued presence of gp120. Colocalized lysenin and Lamp-1 appear yellow in merged images. Quantitative immunofluorescence for (D) lysenin, (E) Lamp-1, and (F) lysenin colocalized with Lamp-1 show that pretreatment with gp120 increased and ML-SA1 treatment reduced the amount of sphingomyelin localized to lysosomes. Representative fluorescent images showing Aβ (82E1), Lamp-2, DIC, and the merged images for (G) control, (H) cells treated for 24 h with gp120 (250 pm), and (I) cells exposed to gp120 for 24 h followed by 6 h with ML-SA1 in the continued presence of gp120. Colocalized Aβ and Lamp-2 in merged images appear yellow. Quantitative immunofluorescence for (J) Aβ, (K) Lamp-2, and (L) Aβ colocalized with Lamp-2 show that gp120 increased, and ML-SA1 decreased the amount of Aβ localized to lysosomes. Quantitative fluorescence data are mean ± SEM of 30–50 cells per experimental condition obtained from three independent experiments. ANOVA with Tukey post hoc comparisons; **p < 0.01, ***p < 0.001 compared with control; ##p < 0.01, ###p < 0.001 compared with gp120.

References

    1. Achim CL, Adame A, Dumaop W, Everall IP, Masliah E. Increased accumulation of intraneuronal amyloid beta in HIV-infected patients. J NeuroImmune Pharmacol. 2009;4:190–199. doi: 10.1007/s11481-009-9152-8. - DOI - PMC - PubMed
    1. Akay C, Lindl KA, Shyam N, Nabet B, Goenaga-Vazquez Y, Ruzbarsky J, Wang Y, Kolson DL, Jordan-Sciutto KL. Activation status of integrated stress response pathways in neurones and astrocytes of HIV-associated neurocognitive disorders (HAND) cortex. Neuropathol Appl Neurobiol. 2012;38:175–200. doi: 10.1111/j.1365-2990.2011.01215.x. - DOI - PMC - PubMed
    1. Alirezaei M, Kiosses WB, Flynn CT, Brady NR, Fox HS. Disruption of neuronal autophagy by infected microglia results in neurodegeneration. PloS One. 2008;3:e2906. doi: 10.1371/journal.pone.0002906. - DOI - PMC - PubMed
    1. Ances BM, Christensen JJ, Teshome M, Taylor J, Xiong C, Aldea P, Fagan AM, Holtzman DM, Morris JC, Mintun MA, Clifford DB. Cognitively unimpaired HIV-positive subjects do not have increased 11C-PiB: a case-control study. Neurology. 2010;75:111–115. doi: 10.1212/WNL.0b013e3181e7b66e. - DOI - PMC - PubMed
    1. Ances BM, Ortega M, Vaida F, Heaps J, Paul R. Independent effects of HIV, aging, and HAART on brain volumetric measures. J Acquir Immune Defic Syndr. 2012a;59:469–477. doi: 10.1097/QAI.0b013e318249db17. - DOI - PMC - PubMed

Publication types

MeSH terms

Substances

LinkOut - more resources