. 2014 Aug 20;34(34):11504-13.
doi: 10.1523/JNEUROSCI.1971-14.2014.

Regulation of blood flow in the retinal trilaminar vascular network

Affiliations

Regulation of blood flow in the retinal trilaminar vascular network

Tess E Kornfield et al. J Neurosci. .

Abstract

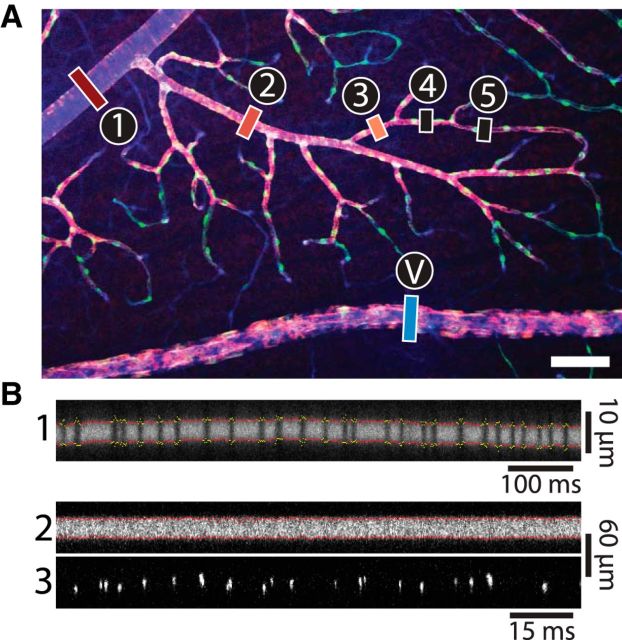
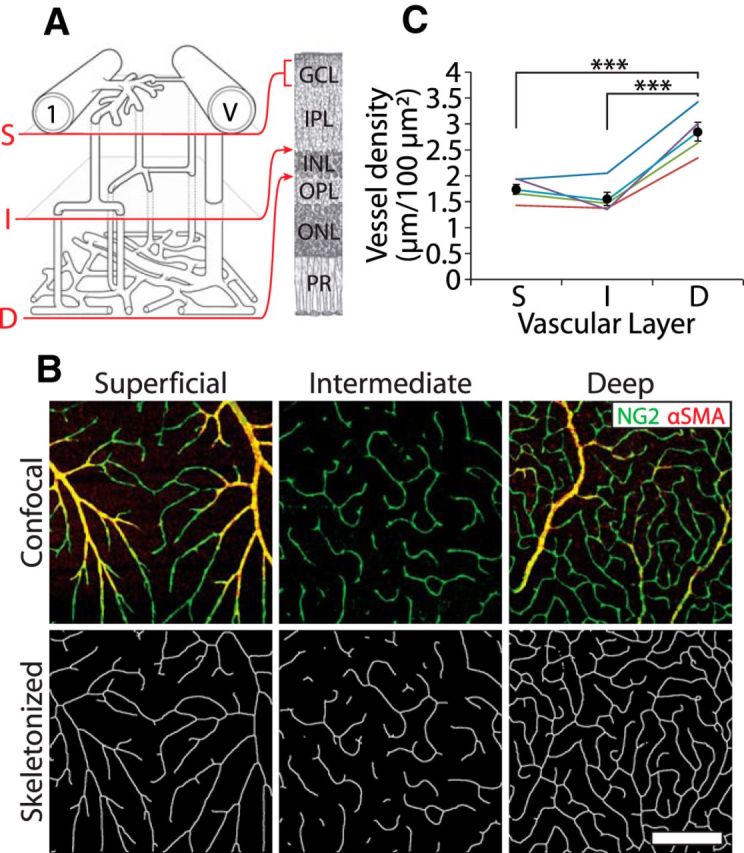
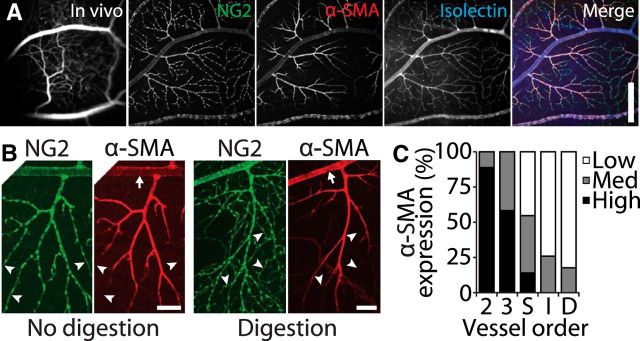
Light stimulation evokes neuronal activity in the retina, resulting in the dilation of retinal blood vessels and increased blood flow. This response, named functional hyperemia, brings oxygen and nutrients to active neurons. However, it remains unclear which vessels mediate functional hyperemia. We have characterized blood flow regulation in the rat retina in vivo by measuring changes in retinal vessel diameter and red blood cell (RBC) flux evoked by a flickering light stimulus. We found that, in first- and second-order arterioles, flicker evoked large (7.5 and 5.0%), rapid (0.73 and 0.70 s), and consistent dilations. Flicker-evoked dilations in capillaries were smaller (2.0%) and tended to have a slower onset (0.97 s), whereas dilations in venules were smaller (1.0%) and slower (1.06 s) still. The proximity of pericyte somata did not predict capillary dilation amplitude. Expression of the contractile protein α-smooth muscle actin was high in arterioles and low in capillaries. Unexpectedly, we found that blood flow in the three vascular layers was differentially regulated. Flicker stimulation evoked far larger dilations and RBC flux increases in the intermediate layer capillaries than in the superficial and deep layer capillaries (2.6 vs 0.9 and 0.7% dilation; 25.7 vs 0.8 and 11.3% RBC flux increase). These results indicate that functional hyperemia in the retina is driven primarily by active dilation of arterioles. The dilation of intermediate layer capillaries is likely mediated by active mechanisms as well. The physiological consequences of differential regulation in the three vascular layers are discussed.

Keywords: blood flow; capillary; functional hyperemia; pericyte; rat; retina.


Figures

Figure 1.
Figure 1.
Measurement of blood vessel diameter and RBC flux in the retina. A, Confocal image of a whole-mount retina labeled for the blood vessel marker isolectin (blue), the contractile protein α-SMA (red), and the pericyte marker NG2 (green). Blood vessel order in the superficial vascular layer is indicated. First-order arterioles (1) branch from the central retinal artery. Each subsequent branch (2-5) has a higher order. Venules (V) connect with the central retinal vein. Scale bar, 100 μm. B, In vivo confocal line-scan images of vessels in the retina, labeled by intravenous injection of FITC dextran. For line-scan images of capillaries (B1), vessel diameter is calculated as the distance between the borders of the vessel lumen (red dots). Segments in which diameter cannot be measured accurately (yellow dots) are ignored. Flux is measured by counting the passage of single RBCs (black vertical lines). In larger vessels, diameter is also measured as the distance between the borders of the vessel lumen (B2; red dots), and flux is calculated by counting the passage of fluorescently labeled RBCs, imaged at a different wavelength (B3; bright vertical lines).
Figure 2.
Figure 2.
Vessel density in the three vascular layers. A, Schematic of the trilaminar vascular network showing the first-order arteriole (1) and venule (V) and the connectivity of the superficial (S), intermediate (I), and deep (D) vascular layers and their locations within the retina. GCL, Ganglion cell layer; IPL, inner plexiform layer; INL, inner nuclear layer; OPL, outer plexiform layer; ONL, outer nuclear layer; PR, photoreceptors. Drawing modified from Paques et al. (2003). B, Top row, Representative confocal images of the superficial, intermediate, and deep vascular layers, labeled for NG2 (green) and α-SMA (red). Bottom row, The images are skeletonized for calculation of vessel density. Scale bar, 200 μm. C, Vessel density in the three vascular layers, measured in five retinas. ***p < 0.001.
Figure 3.
Figure 3.
Flicker-evoked dilation of retinal vessels. A, Time course of flicker-evoked dilation of superficial layer vessels. Mean ± SEM are shown. The open horizontal bar in this and other figures indicates the flicker stimulus. B, Scatter plot of flicker-evoked vasodilation (maximum change during the first 4 s of stimulation) versus baseline vessel diameter for superficial layer vessels. Data are color coded by vessel order. C, Mean baseline diameter of retinal vessels by vessel order. D, Mean flicker-evoked dilation (maximum change during the first 4 s of stimulation) by vessel order. ***p < 0.001, compared with first order; ##p < 0.01, compared with second order. E, Time course of flicker-evoked dilation in the three vascular layers. F, Scatter plot of flicker-evoked vasodilation (mean dilation during the 15 s stimulus) versus baseline vessel diameter for the three vascular layers. G, Mean flicker-evoked dilations for the three vascular layers. ***p < 0.001. Order 1-3 vessels are in the superficial vascular layer. D, deep layer capillaries; I, intermediate layer capillaries; S, superficial layer capillaries (order 4 and higher vessels); V, venule. Abbreviations apply to subsequent figures.
Figure 4.
Figure 4.
Flicker-evoked response frequency and onset time in the retinal vasculature. A, Percentage of vessels responding to flicker stimulation, defined as a response >3 SDs above baseline. B, Time course of flicker-evoked dilation of vessels in the superficial vascular layer. Note that the flicker stimulus (open bar) continues beyond the end of the traces. C, Vessel diameter traces in B are normalized for comparison of onset times. D, The onset time of vessels of different order, shown as box plots, with the + symbol indicating outliers. For details of onset time calculation, see Materials and Methods.
Figure 5.
Figure 5.
Flicker-evoked increases in RBC flux. A, Time course of flicker-evoked RBC flux increases in first-order arterioles and venules. B, Time course of RBC flux increase in second- and third-order vessels and superficial layer capillaries (S). C, Scatter plot of RBC flux increase (mean during the first 2 s of stimulation) versus baseline vessel diameter, color coded by vessel order. D, Mean increase in flicker-evoked RBC flux (mean during the first 2 s of stimulation) by vessel order. E, Time course of RBC flux increases in the capillaries of the three vascular layers. F, Scatter plot of RBC flux increases in capillaries (mean during the 15 s stimulus) versus baseline flux in the three vascular layers. G, H, Baseline RBC flux (G) and flux increases (H) for capillaries in the three vascular layers. *p < 0.05; ***p < 0.001.
Figure 6.
Figure 6.
Pericyte proximity does not determine dilation amplitude. A, Whole-mount confocal image of superficial layer vessels labeled for α-SMA (red) and NG2 (green). Pericyte somata are indicated by arrowheads. Scale bar, 20 μm. B, Scatter plot of flicker-evoked dilation versus distance from pericyte somata for capillaries in the three vascular layers. C, Time course of flicker-evoked capillary dilation for each of the three vascular layers, measured at sites close (≤10 μm), at a medium distance (>10 and ≤25 μm), and far (>25 μm) from pericyte somata. D, Mean distance from pericyte somata for capillaries in each vascular layer that responded to flicker with a dilation (Dil), a constriction (Con), or no change in diameter (NC).
Figure 7.
Figure 7.
Expression of α-SMA decreases with increasing vessel order in the retinal vasculature. A, A retinal region imaged in vivo (first panel) and as a whole-mount, labeled for the pericyte marker NG2, the contractile protein α-SMA, and with the vessel marker Isolectin-IB4. The three labels are merged in the last panel. Scale bar, 400 μm. B, Retinal vessels are labeled for NG2 and α-SMA with no enzymatic digestion (left panels) and with digestion with collagenase/dispase (right panels). Arrows indicate first-order vessels in which strong α-SMA labeling is observed after enzyme digestion. High branch order vessels often express low levels of α-SMA (arrowheads). Scale bars, 100 μm. C, The strength of α-SMA expression (low, medium, or high) is indicated for vessels of each order.

References

    1. Attwell D, Buchan AM, Charpak S, Lauritzen M, Macvicar BA, Newman EA. Glial and neuronal control of brain blood flow. Nature. 2010;468:232–243. doi: 10.1038/nature09613. - DOI - PMC - PubMed
    1. Bandopadhyay R, Orte C, Lawrenson JG, Reid AR, De Silva S, Allt G. Contractile proteins in pericytes at the blood-brain and blood-retinal barriers. J Neurocytol. 2001;30:35–44. doi: 10.1023/A:1011965307612. - DOI - PubMed
    1. Barrett MJ, Tawhai MH, Suresh V. Arteries dominate volume changes during brief functional hyperemia: evidence from mathematical modelling. Neuroimage. 2012;62:482–492. doi: 10.1016/j.neuroimage.2012.05.005. - DOI - PubMed
    1. Bill A, Sperber GO. Aspects of oxygen and glucose consumption in the retina: effects of high intraocular pressure and light. Graefes Arch Clin Exp Ophthalmol. 1990;228:124–127. doi: 10.1007/BF00935720. - DOI - PubMed
    1. Blinder P, Tsai PS, Kaufhold JP, Knutsen PM, Suhl H, Kleinfeld D. The cortical angiome: an interconnected vascular network with noncolumnar patterns of blood flow. Nat Neurosci. 2013;16:889–897. doi: 10.1038/nn.3426. - DOI - PMC - PubMed

Publication types

MeSH terms