

Total fructose intake and risk of hypertension: a systematic review and meta-analysis of prospective cohorts
- PMID: 25144126
- PMCID: PMC4261182
- DOI: 10.1080/07315724.2014.916237
Total fructose intake and risk of hypertension: a systematic review and meta-analysis of prospective cohorts
Abstract
Objectives: Although most controlled feeding trials have failed to show an adverse effect of fructose on blood pressure, concerns continue to be raised regarding the role of fructose in hypertension. To quantify the association between fructose-containing sugar (high-fructose corn syrup, sucrose, and fructose) intake and incident hypertension, a systematic review and meta-analysis of prospective cohort studies was undertaken.
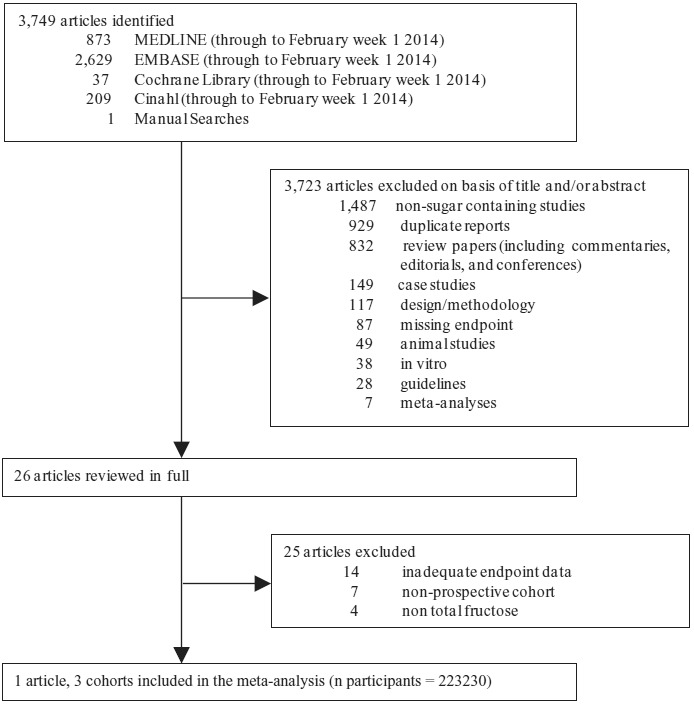
Methods: MEDLINE, EMBASE, CINAHL and the Cochrane Library (through February 5, 2014) were searched for relevant studies. Two independent reviewers reviewed and extracted relevant data. Risk estimates were aggregated comparing the lowest (reference) quintile with highest quintile of intake using inverse variance random effect models and expressed as risk ratios (RR) with 95% confidence intervals (CIs). Interstudy heterogeneity was assessed (Cochran Q statistic) and quantified (I(2) statistic). The Newcastle-Ottawa Scale assessed study quality. Clinicaltrials.gov NCT01608620.
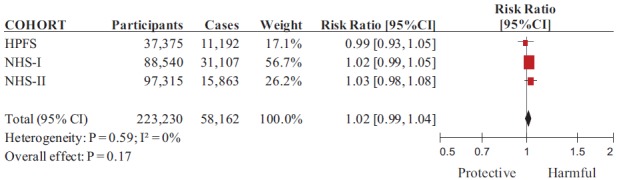
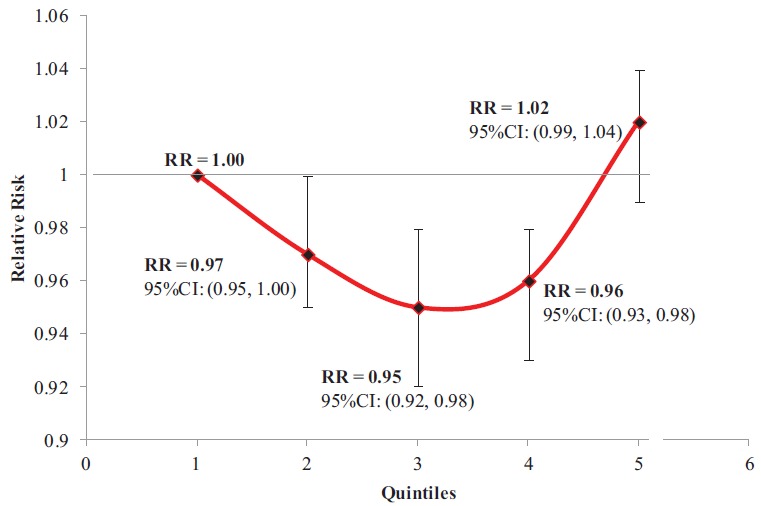
Results: Eligibility criteria were met by 3 prospective cohorts (n = 37,375 men and 185,855 women) with 58,162 cases of hypertension observed over 2,502,357 person-years of follow-up. Median fructose intake was 5.7-6.0% total energy in the lowest quintile and 13.9-14.3% total energy in the highest quintile. Fructose intake was not associated with incident hypertension (RR = 1.02, 95% CI, 0.99-1.04), with no evidence of heterogeneity (I(2) = 0%, p = 0.59). Spline curve modeling showed a U-shaped relationship with a negative association at intakes ≤50th percentile (∼10% total energy) and a positive association at higher intakes.
Conclusions: Total fructose intake was not associated with an increased risk of hypertension in 3 large prospective cohorts of U.S. men and women.
Keywords: fructose; hypertension; meta-analysis; prospective cohort; systematic review.
Figures
References
-
- World Health Organization . Global Health Risks: Mortality and Burden of Disease Attributable to Selected Major Risks. Geneva: World Health Organization; 2009.
-
- Chobanian AV. Bakris GL. Black HR. Cushman WC. Green LA. Izzo JL. Jones DW. Materson BJ. Oparil S. Wright JT. Roccella EJ. The Seventh Report of the Joint National Committee on Prevention, Detection, Evaluation, and Treatment of High Blood Pressure: the JNC 7 report. JAMA. 2003;289:2560–2572. - PubMed
-
- Lawes CM. Vander Hoorn S. Law MR. Elliott P. MacMahon S. Rodgers A. Blood pressure and the global burden of disease 2000. Part II: estimates of attributable burden. J Hypertens. 2006;24:423–430. - PubMed
-
- Daskalopoulou SS. Khan NA. Quinn RR. Ruzicka M. McKay DW. Hackam DG. Rabkin SW. Rabi DM. Gilbert RE. Padwal RS. Dawes M. Touyz RM. Campbell TS. Cloutier L. Grover S. Honos G. Herman RJ. Schiffrin EL. Bolli P. Wilson T. Feldman RD. Lindsay MP. Hemmelgarn BR. Hill MD. Gelfer M. Burns KD. Vallee M. Prasad GV. Lebel M. McLean D. Arnold JM. Moe GW. Howlett JG. Boulanger JM. Larochelle P. Leiter LA. Jones C. Ogilvie RI. Woo V. Kaczorowski J. Trudeau L. Bacon SL. Petrella RJ. Milot A. Stone JA. Drouin D. Lamarre-Cliche M. Godwin M. Tremblay G. Hamet P. Fodor G. Carruthers SG. Pylypchuk G. Burgess E. Lewanczuk R. Dresser GK. Penner B. Hegele RA. McFarlane PA. Sharma M. Campbell NR. Reid D. Poirier L. Tobe SW. The 2012 Canadian hypertension education program recommendations for the management of hypertension: blood pressure measurement, diagnosis, assessment of risk, and therapy. Can J Cardiol. 2012;28:270–287. - PubMed
Publication types
MeSH terms
Substances
Associated data
Grants and funding
LinkOut - more resources
Full Text Sources
Other Literature Sources
Medical
Miscellaneous